


What is Technical Analysis?
Technical analysis forecasts the probable future price movements of a financial instrument'—such as a stock, forex pair, or commodity——based on historical market data. Unlike fundamental analysis, which evaluates economic indicators, corporate performance, and sector trends, technical analysis concentrates solely on price action and trading volume.
The foundation of technical analysis is built on three core principles:
- Market Action Discounts Everything: All pertinent information (including economic data, company fundamentals, and market sentiment) is already embedded in the price.
- Prices Move in Trends: Once a trend is established, it is more likely to continue than to reverse.
- History Tends to Repeat Itself: Market patterns tend to recur because they reflect consistent human behavior and psychology.
Technical traders believe that analyzing current and historical price movements offers the most reliable signals for forecasting future price action. By examining chart patterns, identifying trends, and applying various technical indicators,
traders can make informed decisions on optimal entry and exit points.
Begin chart analysis like a professional with TMGM'’s advanced trading platforms.
Selecting the appropriate time frame is one of the first decisions a technical analyst must make. The chosen time frame should align with your trading style and objectives:
Common Time Frames for Technical Analysis:
- 5-minute chart: Primarily used for ultra-short-term trading and scalping
- 15-minute chart: Preferred by day traders seeking more context than a 5-minute chart provides
- Hourly chart: Offers a balanced perspective for intraday trading
- 4-hour chart: Favored by swing traders holding positions for several days
- Daily chart: Standard for position traders and longer-term analysis
- Weekly/Monthly charts: Used to identify long-term trends and major support/resistance zones
Your choice of time frame significantly influences your analysis. Price movements that appear significant on a 15-minute chart may be mere noise on daily or weekly charts. Conversely, critical support levels visible on daily charts may not be apparent in shorter time frames.
To illustrate, the same price action can look very different across time frames. A strong uptrend on a daily chart may show as a pullback or consolidation on an hourly chart, providing different trading signals depending on the time frame analyzed.
Candlesticks
Candlestick charting is the most widely used method to visualize price movements. Each candlestick represents price action within a single period of any chosen time frame. For example, each candlestick on an hourly chart reflects one hour of price activity, while on a 4-hour chart, each represents four hours.
Candlesticks are "constructed" as follows: The highest point marks the highest traded price during the period, and the lowest point marks the lowest price. The "body" (the colored block, typically red or blue) indicates the opening and closing prices. A blue candlestick body shows that the closing price (top of the body) was higher than the opening price (bottom of the body); a red body indicates the opening price was higher than the closing price.
Candlestick colors are a matter of convention. Some traders use white and black (the default and most common), others prefer green and red or blue and yellow. Regardless of color choice, they provide a quick visual cue to determine whether the price closed higher or lower for the period. Candlestick charts often offer clearer visual patterns than traditional bar charts.
Candlestick Patterns – Dojis
Candlestick patterns, formed by one or a series of two or three candlesticks, are among the most popular technical indicators for spotting potential market reversals or trend shifts.
Doji candlesticks, for example, signal market indecision and may indicate an impending trend reversal. A doji’s defining feature is that the opening and closing prices are equal, resulting in a flat candlestick body. The longer the upper and/or lower "shadows" or "tails" (the wicks representing the high-low range) on a doji, the stronger the indication of market indecision and possible reversal.
Several doji variations exist, each with a specific name:
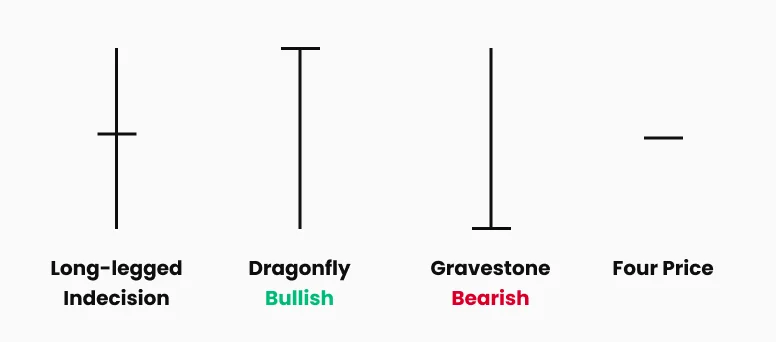
Figure 1: Variations of Doji Candlesticks
- The standard doji is the long-legged doji, where prices extend roughly equally in both directions, opening and closing near the midpoint of the range. This candlestick visually represents market indecision. When it appears following a prolonged uptrend or downtrend, it often signals a potential reversal or trend change.
- After a sustained downtrend, the dragonfly doji suggests a possible bullish reversal. This pattern shows sellers pushing prices significantly lower (long lower tail), but the price recovers to close at the period’s high, indicating rejection of the downward pressure.
- The gravestone doji'—named for its appearance—signals bearish sentiment. Opposite to the dragonfly doji, it reflects strong rejection of upward price attempts, suggesting a potential downside reversal.
- The rare four-price doji, where the market opens, closes, and trades at the same price throughout the period, epitomizes complete indecision with no directional bias.
Technical Indicators – Moving Averages
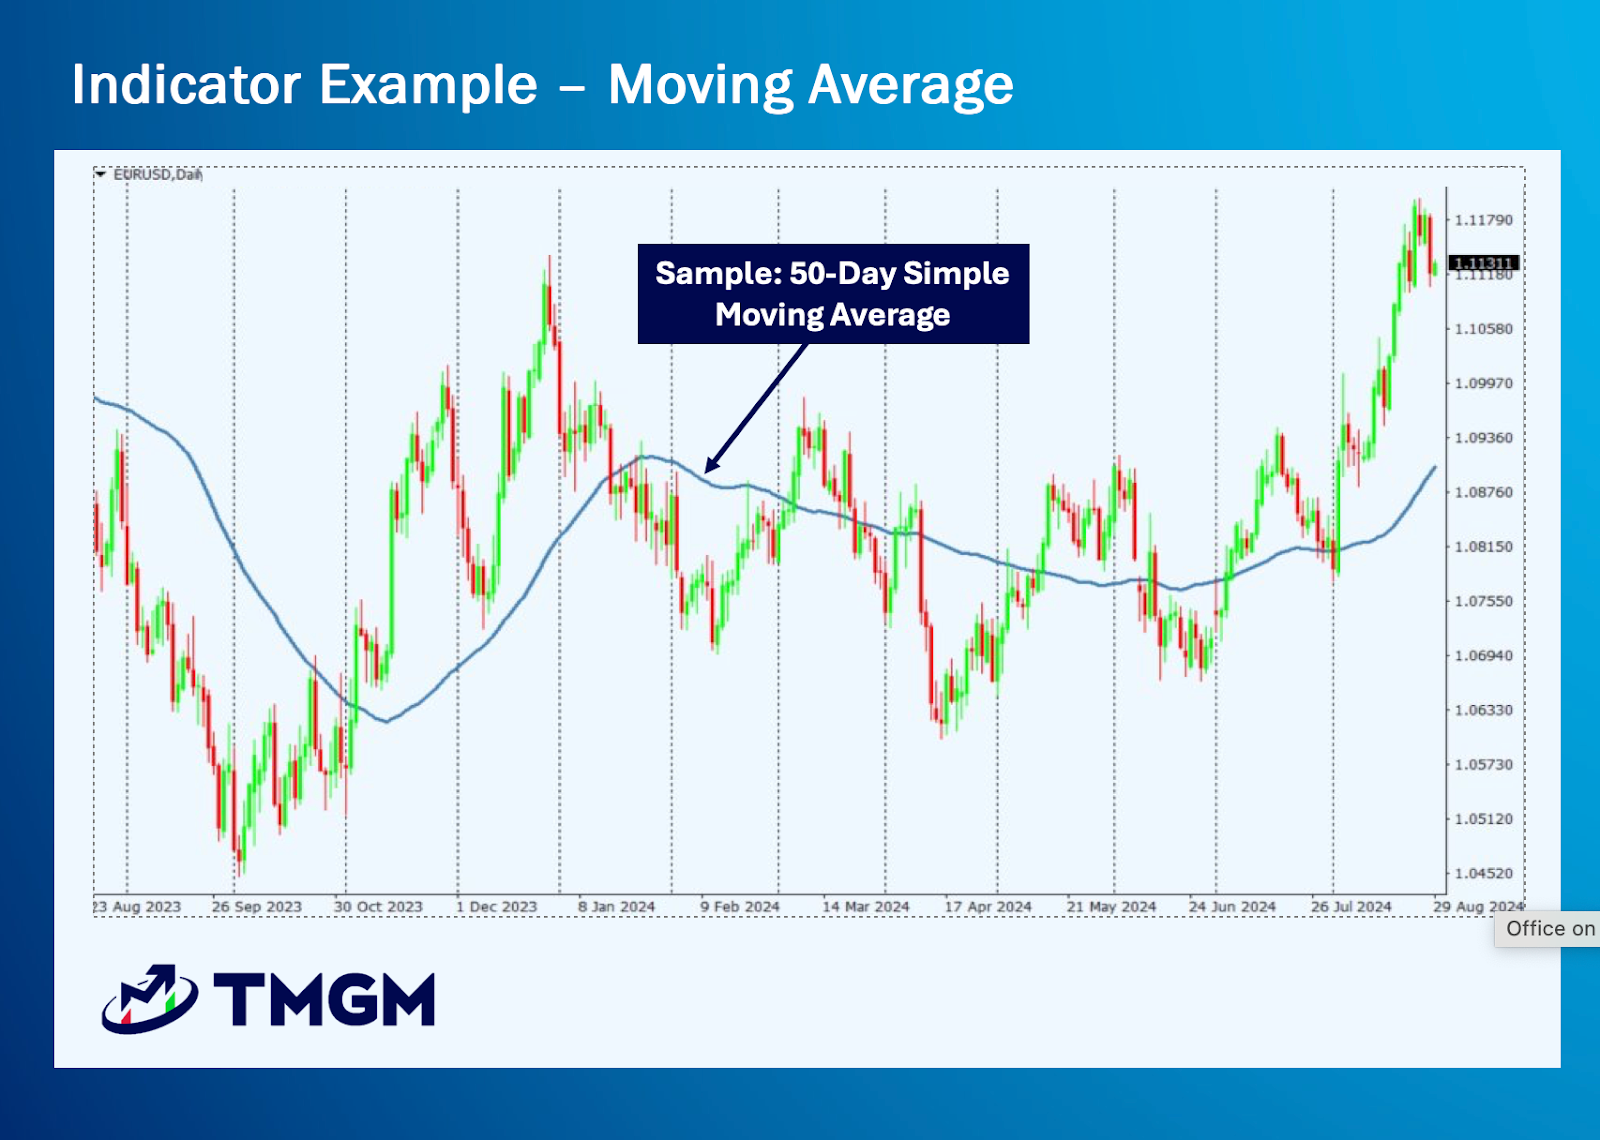
Figure 2: Technical Indicators – Moving Averages
Beyond candlestick patterns, technical traders have access to a vast array of technical indicators to support trading decisions.
Moving averages are the most widely used technical indicator. Many strategies incorporate one or more moving averages. A simple moving average strategy might be: "Buy when price stays above the 50-period exponential moving average (EMA); sell when price falls below the 50 EMA".
Moving average crossovers are also popular. For instance, a trader might buy when the 10-period moving average crosses above the 50-period moving average.
Longer-period moving averages carry more weight. For example, price crossing above or below a 100- or 200-period moving average is generally considered more significant than crossing a 5-period moving average.
Technical Indicators – Pivots and Fibonacci Levels
Daily pivot points, which also identify multiple support and resistance levels, are widely used to pinpoint potential trade entry and exit levels. Pivot points often coincide with key support/resistance or range-bound trading zones. A price breakout through the pivot and associated levels is often interpreted as a strong directional move.
Pivot points and their support/resistance levels are calculated using the previous trading day’s high, low, open, and close prices.
Fibonacci levels are another essential tool. Fibonacci, a 12th-century mathematician, developed ratios that are widely applied in technical analysis. These ratios help identify trade entry points and profit targets during trending markets.
Key Fibonacci ratios include 0.24, 0.38, 0.62, and 0.76, often expressed as percentages (23%, 38%, etc.). These ratios complement each other: 24% is the complement of 76%, and 38% complements 62%.
Many technical indicators automatically calculate and overlay Fibonacci levels on charts.
Fibonacci Retracements
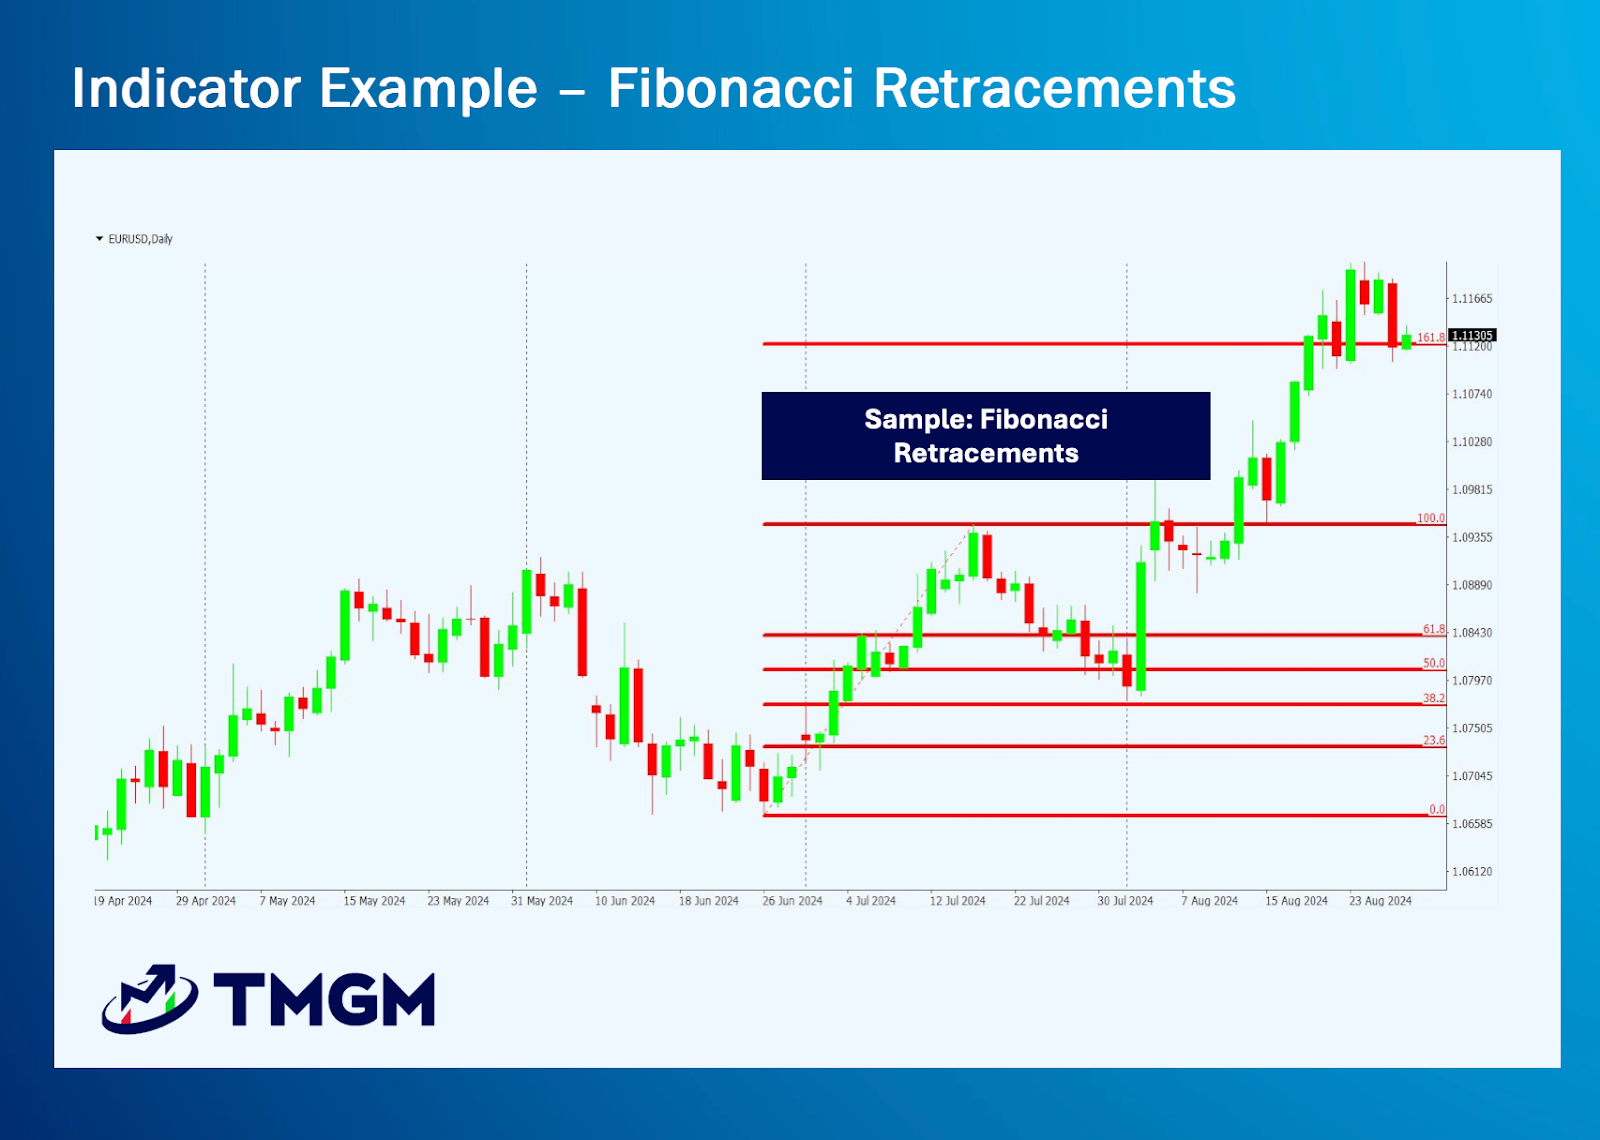
Figure 3: Technical Indicators – Fibonacci Retracements
Fibonacci retracements are the most commonly used Fibonacci tool. After a sustained uptrend or downtrend, prices often retrace partially before resuming the trend. Fibonacci retracements help identify low-risk entry points during these pullbacks.
For example, suppose stock "A" rises steadily from $10 to $40, then begins to pull back. Many traders look to buy during such retracements.
Fibonacci levels suggest retracements often reach 24%, 38%, 62%, or 76% of the prior move. Traders watch these levels for signs of support and potential resumption of the uptrend. For instance, a 38% retracement from $40 would be around $31 ($40 - 38% of $30), a common entry point.
Fibonacci Extensions
Continuing the example, after buying at $31, traders seek profit targets using Fibonacci extensions, which project potential price extensions beyond the original move. Extension levels are set at 126%, 138%, 162%, and 176% of the initial move, measured from the retracement low. For a 38% retracement low at $31, the 126% extension target is calculated as $31 + ($30 x 1.26) = $68, providing a profit-taking price level.
These calculations are automated by charting software; simply apply a Fibonacci indicator to visualize all levels.
Even if you don’t use pivot or Fibonacci levels directly, tracking them is valuable because many traders base decisions on these levels, leading to increased market activity and potential price reactions around these points.
Technical Indicators – Momentum Indicators
While moving averages and many indicators focus on market direction, another category—momentum indicators—measures market strength.
Popular momentum tools include the Stochastic Oscillator, Relative Strength Index (RSI), Moving Average Convergence Divergence (MACD), and Average Directional Movement Index (ADX).
By gauging the intensity of price movement, momentum indicators help determine whether price action reflects insignificant range-bound trading or a significant trend. They can also serve as early warnings of trend exhaustion. For example, if a security has been in a strong uptrend for months but momentum indicators show weakening strength, it may signal a good time to take profits.
Because momentum indicators typically do not indicate trend direction, they are often combined with other technical tools within comprehensive trading strategies.
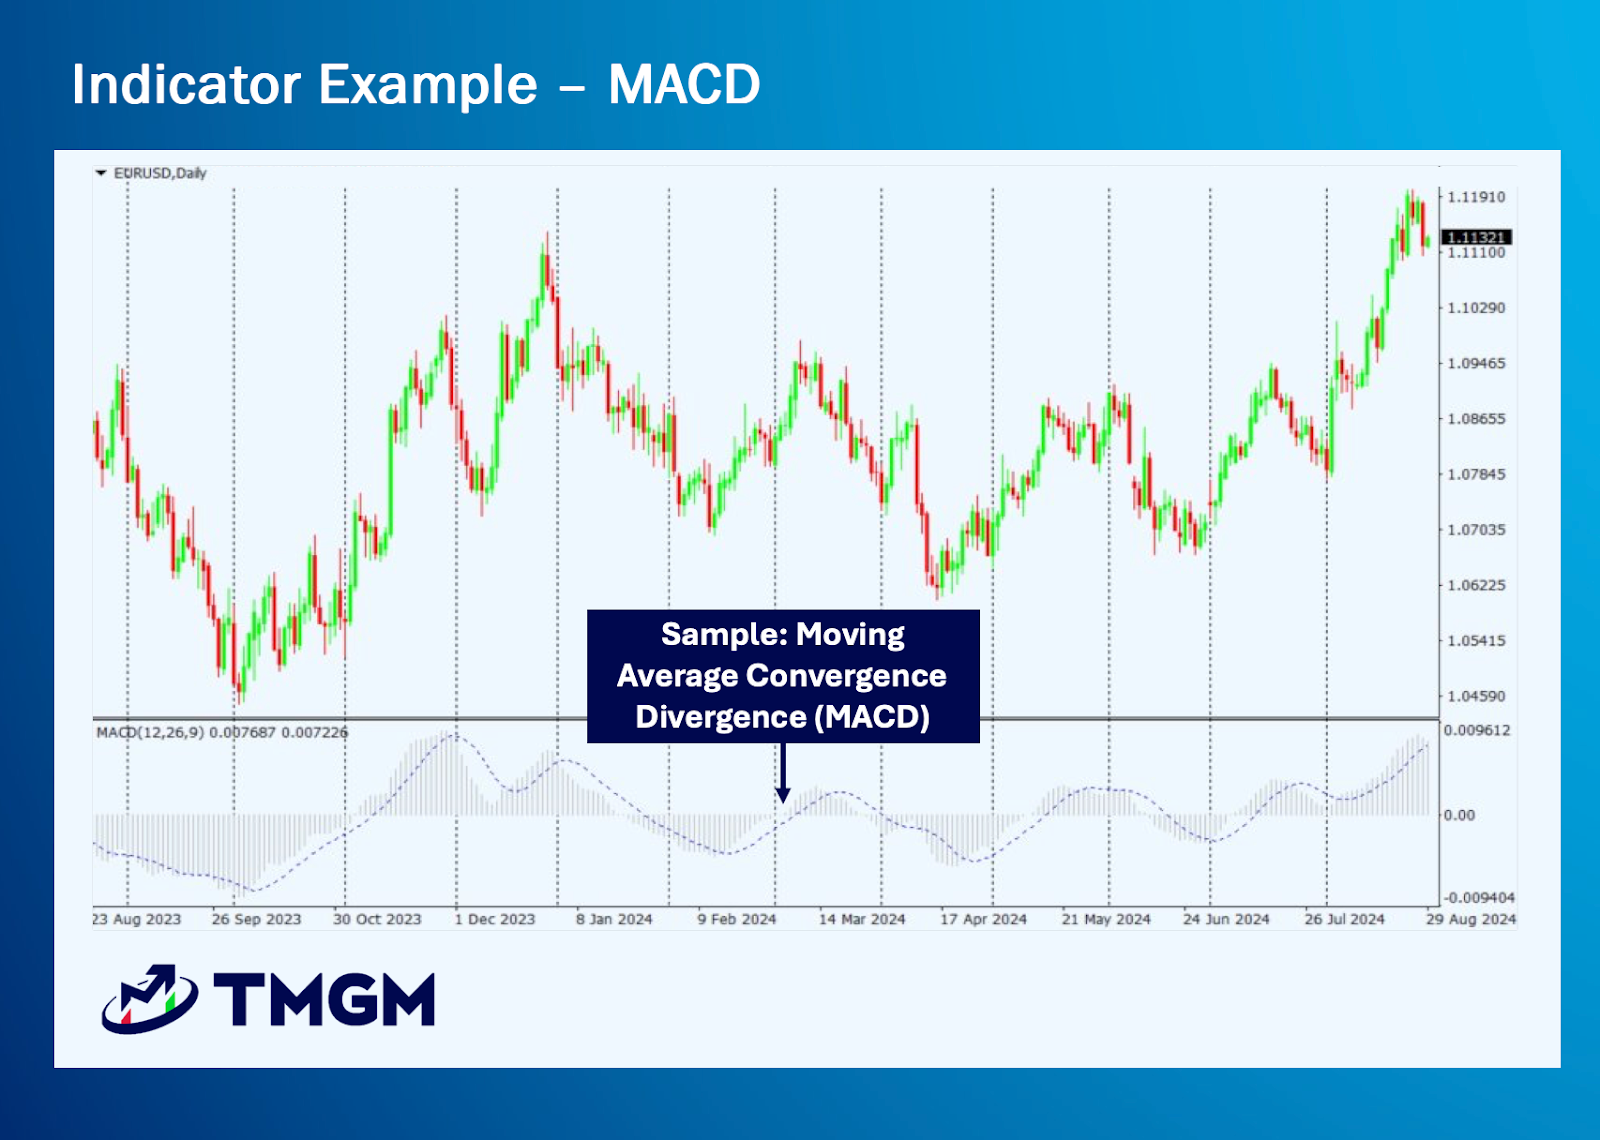
Figure 4: Technical Indicators –MACD
Technical Analysis – Conclusion
Remember, no technical indicator is infallible. None provides 100% accurate signals consistently.
Savvy traders remain alert for signs that their indicators may be misleading. While proficient technical analysis can enhance trading profitability, managing risk and preparing for adverse market moves often contribute more to long-term success than merely anticipating gains.
Free Trading Courses and Resources
Success in trading requires skill, knowledge, and practice. TMGM offers free courses and webinars for traders at all levels. Test your strategies risk-free with a demo account funded with US$100,000 in virtual capital before trading live.


