


What is the MACD Oscillator?
The Moving Average Convergence Divergence (MACD) oscillator is one of the most popular and widely utilized technical analysis indicators among traders and analysts for assessing market momentum. Developed in the late 1970s, it has become an essential tool for technical analysts aiming to identify potential trend reversals, momentum shifts, and trading opportunities.
MACD distinguishes itself from other technical indicators by combining trend-following and momentum oscillator elements, offering traders a versatile instrument that provides insights across various market conditions. Unlike many indicators that deliver a single type of signal, the MACD offers multiple analytical perspectives on price action.
Traders and analysts employ a range of technical indicators to detect market trends, anticipate potential trading shifts, and ultimately execute trades successfully or advise clients accordingly. Among these, the MACD has remained popular for decades due to its effectiveness and straightforward application.
History and Development of the MACD
Gerald Appel, a renowned technical analyst and publisher of the "Systems and Forecasts" financial newsletter, developed the Moving Average Convergence Divergence in the late 1970s. His objective was to create an indicator capable of identifying changes in the strength, direction, momentum, and duration of a stock'’s price trend.
Appel initially introduced only the MACD line and the signal line. It was not until 1986 that Thomas Aspray enhanced the indicator by adding the histogram feature, which made the MACD more visually informative and easier for traders to interpret.
Despite being over 40 years old, the MACD remains relevant in contemporary trading environments, spanning traditional stock markets, forex, commodities, and cryptocurrency trading. Its longevity underscores its utility and effectiveness across diverse market types and timeframes.
Core Components of the MACD
The MACD indicator comprises three key components that work in tandem to provide traders with valuable insights into market dynamics:
The MACD Line
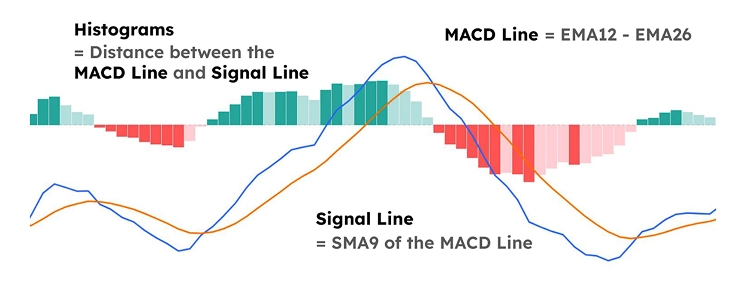
Figure 1: Explanation of the MACD Indicator
The MACD line is the primary component of the indicator and represents the difference between two exponential moving averages (EMAs), typically the 12-period EMA and the 26-period EMA. This line oscillates above and below the zero line (also known as the centerline) as the EMAs converge, cross, and diverge.
When the shorter-term EMA (12-period) rises above the longer-term EMA (26-period), the MACD line moves above zero, indicating increasing bullish momentum. Conversely, when the shorter-term EMA falls below the longer-term EMA, the MACD line moves below zero, signaling increasing bearish momentum.
The Signal Line
The signal line is a 9-period EMA of the MACD line itself. It serves as a trigger for buy and sell signals when the MACD line crosses above or below it. The signal line smooths the MACD line’s fluctuations, facilitating the identification of potential entry and exit points.
When the MACD line crosses above the signal line, it generates a bullish signal, indicating a potential buying opportunity. When it crosses below, it produces a bearish signal, suggesting a potential selling opportunity.
The MACD Histogram
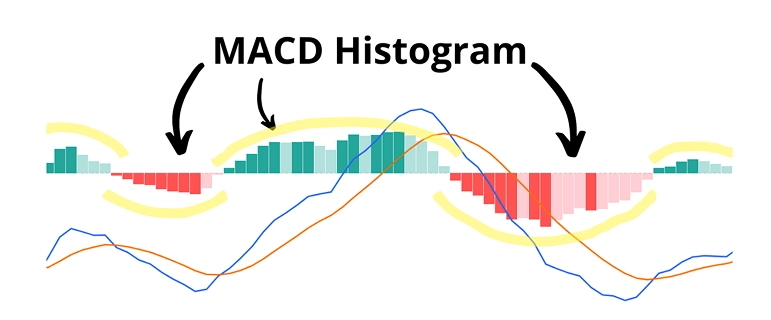
Figure 2: MACD Histogram
The MACD histogram visualizes the difference between the MACD line and the signal line. When the MACD line is above the signal line, the histogram is positive (displayed as bars above zero). When the MACD line is below the signal line, the histogram is negative (bars below zero).
The height of the histogram bars reflects the distance between the MACD line and the signal line. As this distance widens, histogram bars grow taller, indicating strengthening momentum in the trend’s direction. Conversely, shrinking bars suggest weakening momentum.
How is MACD Calculated?
The MACD measures the evolving relationship between short-term and long-term EMAs. Understanding its calculation helps traders comprehend how the indicator functions and why it delivers valuable signals.
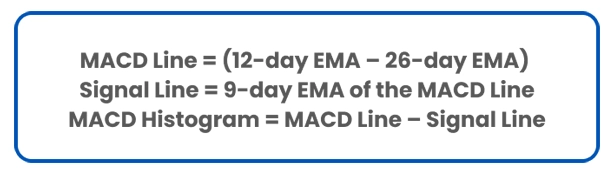
The basic formula to calculate the MACD is:
Traders and analysts typically use closing prices over 12-day and 26-day periods to compute the EMAs for the MACD calculation. Subsequently, a 9-day EMA of the MACD line is plotted as the signal line to help identify potential market turning points.
Step-by-Step Calculation Example
To illustrate the MACD calculation, here is a simplified example:
Calculate the 12-day EMA of the asset’s priceFor a stock trading at various prices over 12 days, calculate the 12-day EMA, weighting recent prices more heavily.
Calculate the 26-day EMA of the asset’s priceSimilarly, calculate the 26-day EMA, which responds more slowly to price changes than the 12-day EMA.
Calculate the MACD LineSubtract the 26-day EMA from the 12-day EMA: MACD Line = (12-day EMA − 26-day EMA)
Calculate the Signal LineCompute the 9-day EMA of the MACD Line calculated in the previous step.
Calculate the MACD HistogramSubtract the Signal Line from the MACD Line: MACD Histogram = MACD Line − Signal Line
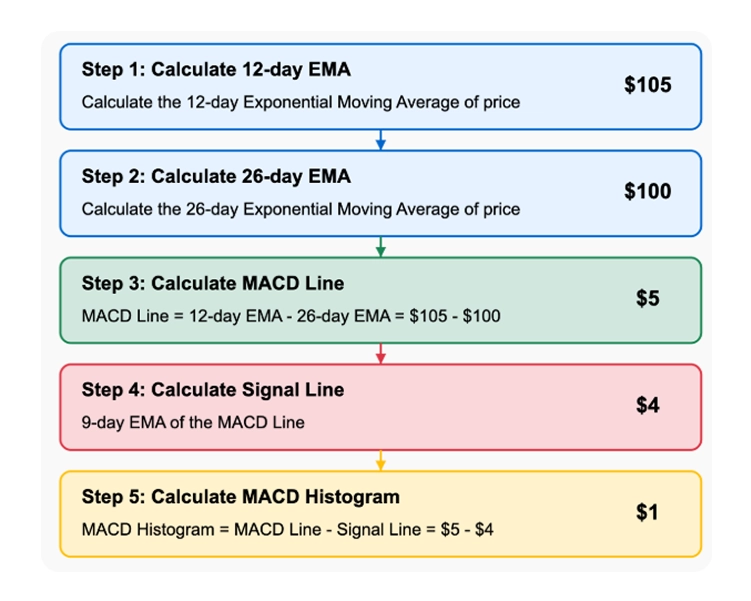
Figure 3: MACD Calculation Process
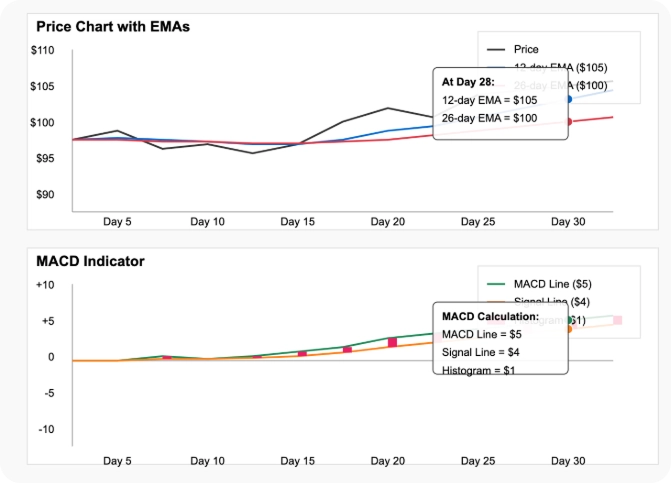
Figure 4: MACD Chart Visualization
For example, if the 12-day EMA is $105 and the 26-day EMA is $100:
MACD Line = $105 − $100 = $5
If the 9-day EMA of the MACD Line (Signal Line) is $4
MACD Histogram = $5 − $4 = $1
Customizing MACD Parameters
While the standard MACD parameters are 12, 26, and 9, traders can adjust these to align with their specific trading strategies or timeframes:
- Faster MACD: Using shorter periods (e.g., 5, 13, and 4) creates a more responsive indicator that generates more signals but may increase false positives.
- Slower MACD: Using longer periods (e.g., 19, 39, and 9) produces a more conservative indicator that generates fewer but potentially more reliable signals.
Experienced traders often experiment with different parameter settings to find the optimal combination for their trading style, specific assets, and preferred timeframes.
How to Interpret the MACD?
The MACD is based on the movement of moving averages either converging (coming together) or diverging (moving apart). The indicator oscillates above and below the zero line (centerline), signaling when the shorter moving average crosses the longer one.
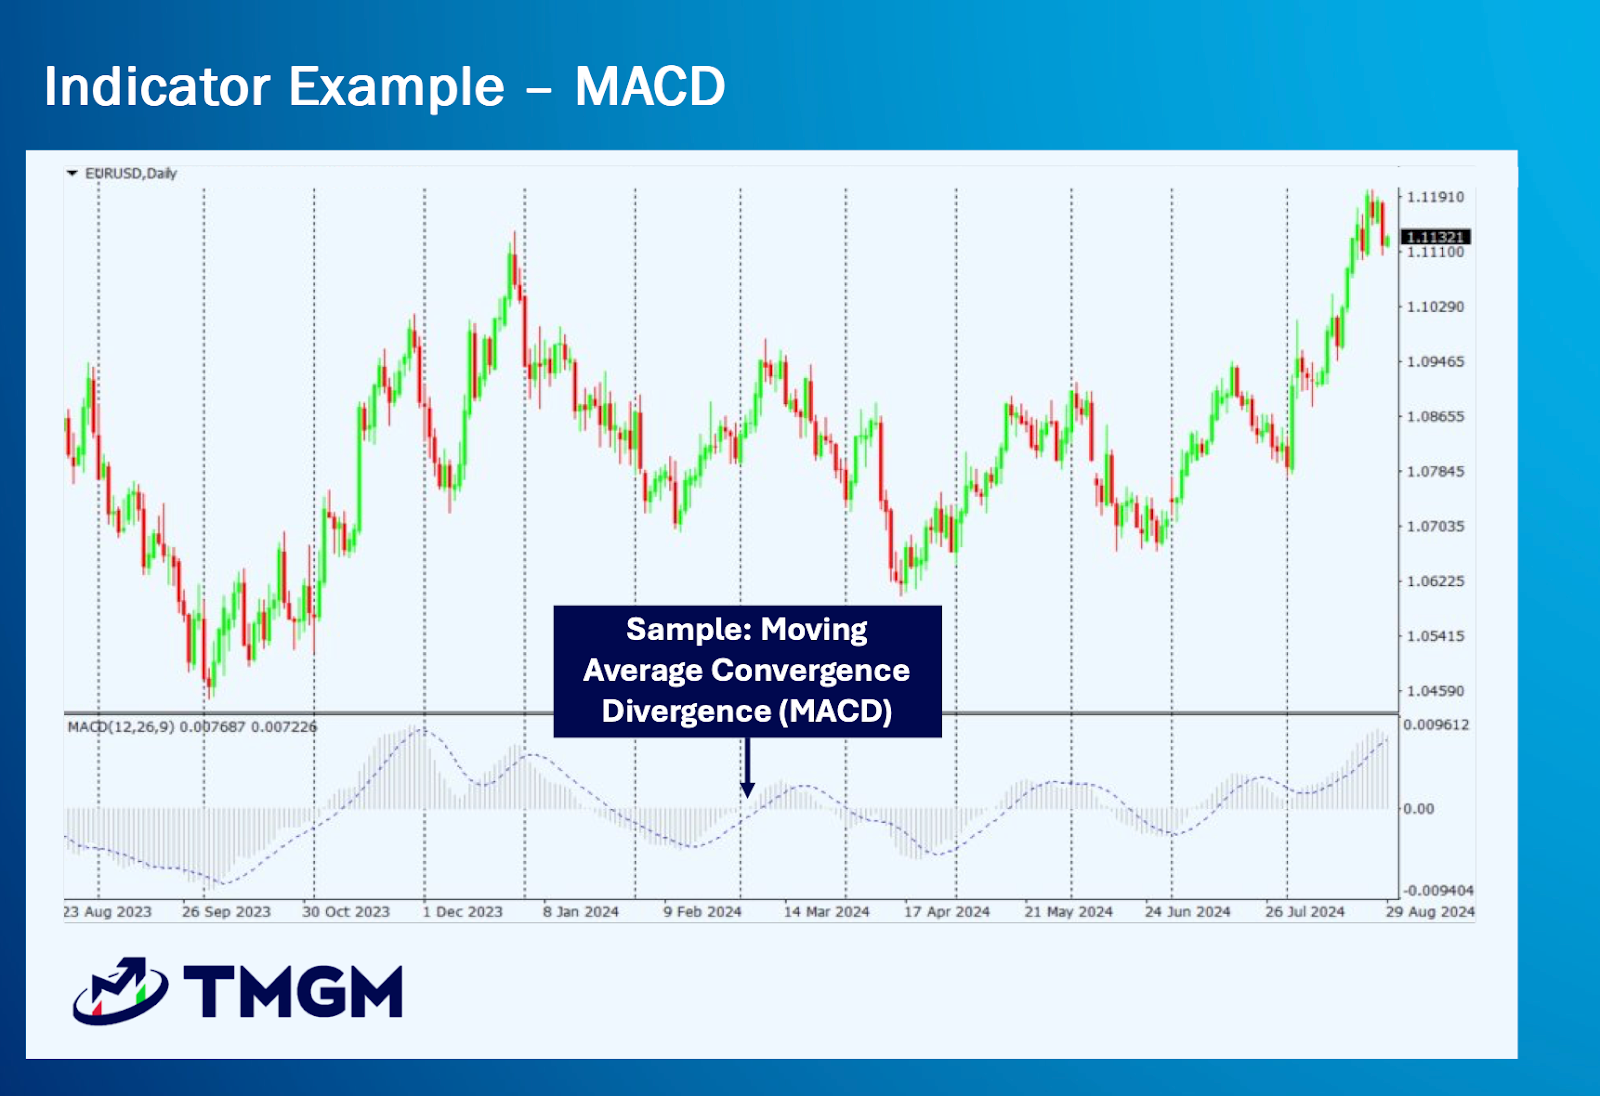
Figure 5: MACD Chart
Crossing the Zero Line
Zero line crossovers occur when the MACD line passes through the centerline, indicating potential trend direction changes:
- Bullish Zero Line Crossover: When the MACD line moves from below to above zero, it signals the 12-day EMA has crossed above the 26-day EMA, indicating a potential iptrend and a buying opportunity.
- Bearish Zero Line Crossover: When the MACD line moves from above to below zero, it indicates the 12-day EMA has fallen below the 26-day EMA, suggesting a potential downtrend and a selling opportunity.
Zero line crossovers are commonly used to identify the overall trend: above zero indicates bullishness; below zero indicates bearishness.
Signal line crossovers occur more frequently than zero line crossovers, offering more trading opportunities but also a higher chance of false signals, especially in sideways or volatile markets.
Moving Average Divergence
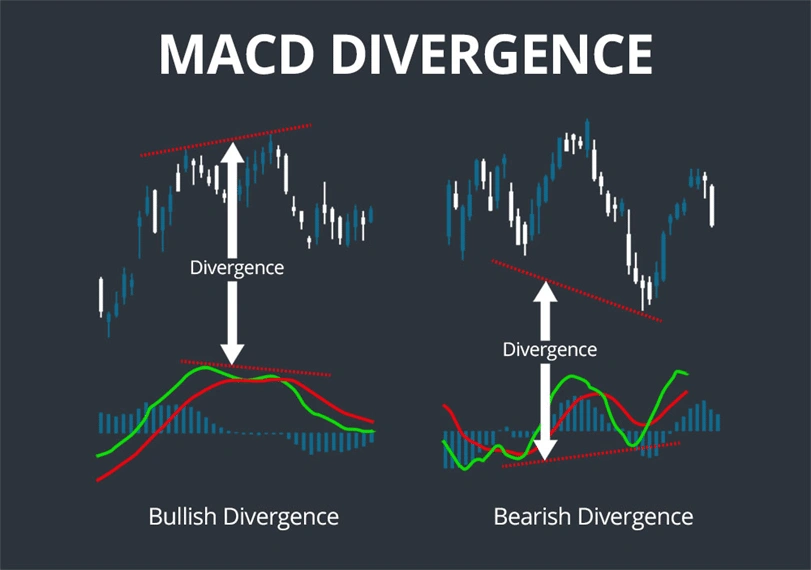
Figure 6: MACD Divergence
Analysts often monitor the MACD for divergence from price action. Divergence occurs when price and the MACD move in opposite directions, signaling potential trend reversals:
- Bullish Divergence: When price forms lower lows but the MACD forms higher lows, indicating weakening bearish momentum and a possible trend reversal upwards.
- Bearish Divergence: When price makes higher highs but the MACD forms lower highs, indicating weakening bullish momentum and a potential downward trend reversal.
Divergences are stronger signals when occurring after extended price moves and when the MACD is significantly above or below zero.
Histogram Analysis
The MACD histogram offers additional insights into momentum shifts:
Increasing Positive Histogram: Growing histogram bars above zero indicate strengthening bullish momentum.
Decreasing Positive Histogram: Shrinking histogram bars above zero suggest weakening bullish momentum, potentially signaling a bearish crossover.
Increasing Negative Histogram: Expanding histogram bars below zero signal strengthening bearish momentum.
Decreasing Negative Histogram: Contracting histogram bars below zero indicate weakening bearish momentum, possibly preceding a bullish crossover.
Histogram analysis is valuable for identifying early momentum changes before crossovers occur, helping traders anticipate trend shifts.
Finding Entry and Exit Points with MACD
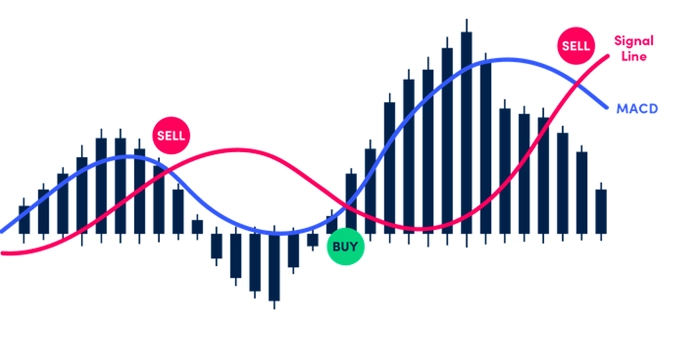 Figure 7: Entry and Exit Points
One of the MACD’s key benefits is aiding traders in identifying potential entry and exit points. Proper interpretation of MACD signals can significantly improve trading outcomes.
Entry Points Using MACD
The MACD offers several signal types that can indicate entry points:
1. Signal Line CrossoversThe most common buy signal occurs when the MACD line crosses above the signal line:
Buy Signal: MACD line crosses above the signal line
Stronger Buy Signal: When this crossover occurs below zero, it may indicate a reversal from a downtrend
2. Zero Line CrossoversWhen the MACD line crosses above zero, it signals the shorter-term EMA has crossed above the longer-term EMA:
Buy Signal: MACD line crosses above zero, suggesting a potential new uptrend
3. Bullish DivergenceOne of the strongest MACD signals:
Buy Signal: When price makes a new low but MACD forms a higher low
This indicates weakening bearish momentum despite falling prices
4. Histogram Reversals
Buy Signal: When the histogram starts increasing from negative territory (becoming less negative)
This can provide an early indication before an actual MACD line/signal line crossover
Exit Points Using MACD
Similarly, the MACD helps identify optimal exit points:
1. Signal Line Crossovers
Sell Signal: MACD line crosses below the signal line
Stronger Sell Signal: When this crossover occurs above zero after a prolonged uptrend
2. Zero Line Crossovers
Sell Signal: The MACD line crosses below zero, indicating a shift from bullish to bearish momentum
3. Bearish Divergence
Sell Signal: When price makes a new high but MACD forms a lower high
This suggests weakening bullish momentum despite rising prices
4. Overextended MACD
Sell Signal: When the MACD line extends too far above the signal line
This often indicates an overbought condition, suggesting a correction is likely
Practical MACD Trading Tips
Avoid False Signals: Confirm MACD signals with additional indicators or price action before executing trades.
Consider the Trend: MACD signals are more reliable when aligned with the overall market trend.
Timeframe Matters: Signals on higher timeframes (daily, weekly) tend to be more dependable than those on lower timeframes
(1-minute, 5-minute).Signal Strength: The wider the gap between the MACD and signal line during a crossover, the stronger the potential move.
Look for Confluence: The most effective trades occur when multiple MACD signals coincide.
Mind the Context: The implications of a signal line crossover vary depending on its position relative to the zero line.
Example MACD Entry and Exit Strategy
Here'’s a straightforward MACD trading strategy commonly used by traders:
Entry (Buy):
Wait for the MACD line to cross above the signal line
Confirm that the histogram is expanding
Ensure the crossover aligns with the prevailing trend
Look for supporting price action, such as a bounce off support
Exit (Sell):
Sell when the MACD line crosses below the signal line
Exit when a bearish divergence forms after a prolonged uptrend
Take profits at targets identified by other technical analysis
Exit if your predetermined stop-loss is triggered
Remember, no indicator is flawless. Always apply sound risk management, regardless of the strength of a MACD signal.
MACD Trading Strategies
The MACD’s flexibility makes it suitable for various trading strategies. Below are some of the most common and effective MACD-based approaches:
MACD Crossover Strategy
The MACD crossover strategy is among the most widely adopted:
Entry Rules:
For long positions: Enter when the MACD line crosses above the signal line while both are below zero.
For short positions: Enter when the MACD line crosses below the signal line while both are above zero.
Exit Rules:
For long positions: Exit when the MACD line crosses below the signal line.
For short positions: Exit when the MACD line crosses above the signal line.
This strategy performs best in trending markets and can be enhanced by considering the overall trend and using additional confirmation indicators.
Zero Line Crossover Strategy
The zero-line crossover strategy targets major trend shifts:
Entry Rules:
For long positions: Enter when the MACD line crosses above zero.
For short positions: Enter when the MACD line crosses below zero.
Exit Rules:
For long positions: Exit when the MACD line crosses below zero.
For short positions: Exit when the MACD line crosses above zero.
This approach typically generates fewer signals than the crossover strategy but may identify more significant trend changes.
Divergence Trading Strategy
The divergence strategy focuses on discrepancies between price action and MACD readings:
Entry Rules:
For long positions: Enter on bullish divergence (price makes lower lows, MACD makes higher lows).
For short positions: Enter on bearish divergence (price makes higher highs, MACD makes lower highs).
Exit Rules:
For long positions: Exit at previous resistance or on bearish divergence.
For short positions: Exit at previous support or on bullish divergence.
Divergence strategies often provide earlier reversal signals but require experience to identify and interpret accurately.
Limitations of the MACD
While versatile and popular, the MACD has limitations:
- Lagging Indicator: Being based on moving averages, the MACD inherently lags price action. Signals often appear after a significant portion of the move has occurred.
- False Signals: The MACD can produce false signals, especially in choppy or sideways markets, leading to unprofitable trades.
- No Volatility Consideration: Unlike indicators such as Bollinger Bands or Average True Range, the MACD does not account for market volatility, which can affect signal reliability.
- Standardized Settings: The default 12, 26, and 9 settings may not suit all assets or timeframes. Customization requires experience and testing.
- No Support/Resistance Identification: The MACD does not identify specific support or resistance levels, which are critical for setting stop-loss and take-profit orders.
Being aware of these limitations enables traders to use the MACD more effectively, often by combining it with complementary indicators or adjusting their strategies accordingly.
The Bottom Line
The MACD is a versatile technical indicator blending trend-following and momentum components, valuable across various market conditions. Its capacity to identify trend changes, momentum shifts, and reversal points has sustained its popularity among traders for decades.
Exercise caution when signal line crossovers occur at extreme highs or lows. Similarly, shallow or plateauing crossovers warrant vigilance. Market volatility can cause atypical MACD behavior.
For optimal use of the MACD, consider these practices:Use Multiple Timeframes: Analyze MACD on higher timeframes to establish the overall trend, then use lower timeframes for entry signals.
Combine with Other Indicators: Use MACD alongside complementary indicators to confirm signals and reduce false positives.
Consider Market Context: Interpret MACD signals differently depending on whether the market is trending, ranging, or highly volatile.
Practice Patience: Wait for clear, strong signals rather than trading every crossover.
Implement Proper Risk Management: Always apply appropriate stop-loss orders and position sizing, regardless of signal strength.
Regular practice with the MACD will help you recognize its typical patterns and nuances, enhancing your ability to interpret extreme or unusual movements. The more you integrate this versatile indicator into your trading, the more effective it will become.Start Trading with MACD at TMGM
Ready to apply MACD analysis to your trading strategy? TMGM offers advanced charting tools with MACD indicators, enabling traders to effectively incorporate this technical analysis method.
Why Choose TMGM for Your Trading Needs:
Advanced Charting Platforms – Access professional-grade charting with customizable MACD settings and multi-timeframe analysis.
Educational Resources – Learn to trade MACD with comprehensive guides, webinars, and expert insights.
Efficient Order Execution – Execute trades with competitive processing speeds.
Competitive Spreads – Trade with low spreads on various instruments.
Trading Support – Get assistance from our market analysts.
Risk-Free Practice – Test MACD strategies with virtual funds on a free demo account.
Join thousands of successful traders who rely on TMGM's powerful technical analysis tools and expert guidance. Experience the TMGM difference in your MACD trading journey.


