


What is Swing Trading?
Swing trading occupies the middle ground between the frenetic pace of day trading and the passive approach of long-term investing. The objective is not to trade every minor fluctuation, but to identify a potential price move—a "swing"—and remain in the trade only for the duration of that specific trend or correction.
Traders utilize this method to profit from the natural flow of market cycles, often analyzing 4-hours, Daily charts and Weekly Charts to identify setups that may take time to fully play out.
| Feature | Description |
|---|---|
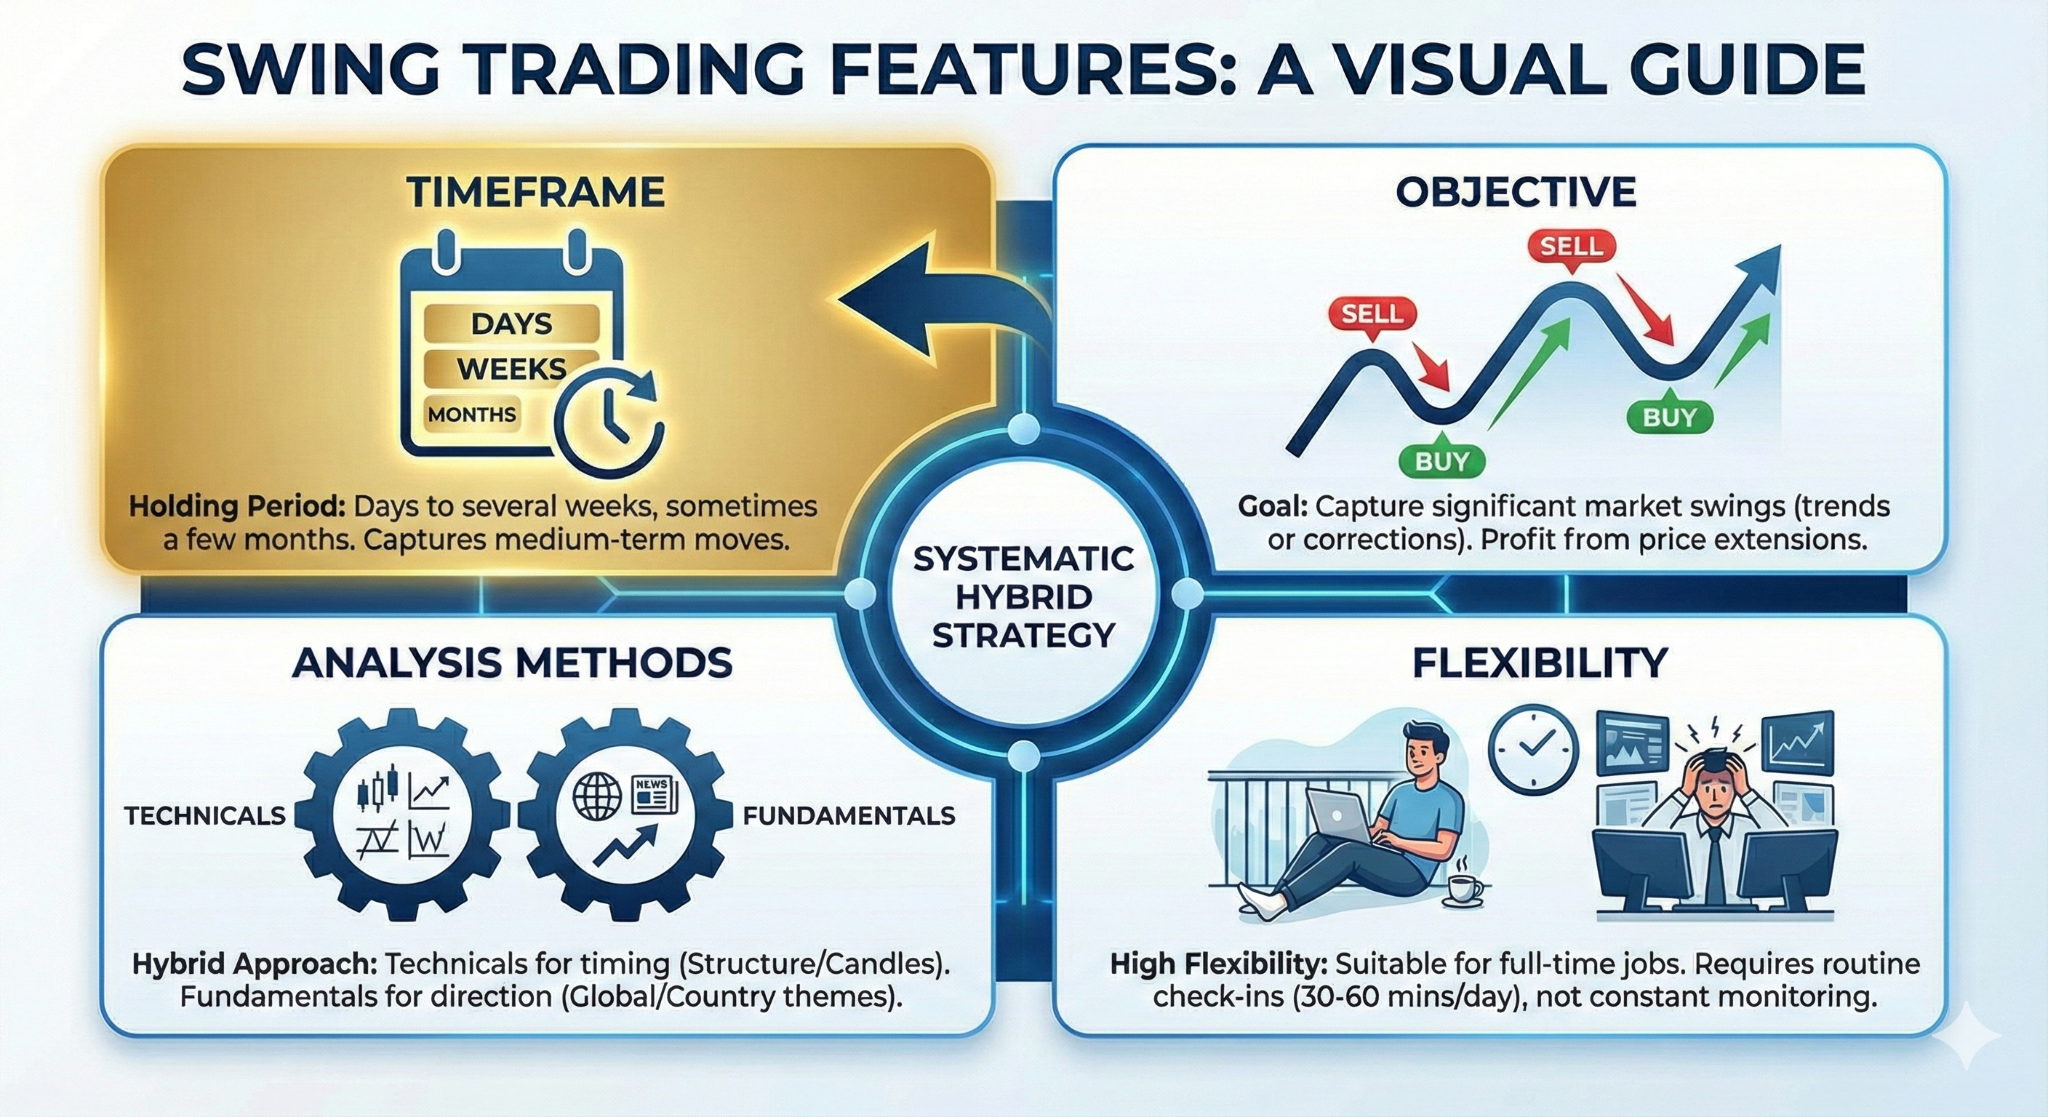
| Timeframe | Days to several weeks, sometimes a few months. |
| Objective | Capture a significant portion of a market swing (trend or correction). |
| Analysis Methods | Hybrid: Technicals for timing (Structure/Candles), Fundamentals for direction (upward trend or downward trend). |
| Flexibility | High. Suitable for those with full-time jobs as it requires routine check-ins rather than constant monitoring. |
Swing Trading vs Day Trading
The primary distinction is the holding period and the associated risk profile. Day traders liquidate all positions before the market close to avoid overnight gaps. Swing traders accept this overnight risk in exchange for capturing larger price extensions that intraday volatility cannot offer.
| Comparison Point | Swing Trading | Day Trading |
|---|---|---|
| Holding Period | Overnight to several months. | Minutes to hours (Closed same day). |
| Leverage Usage | Low to Medium (to withstand volatility). | High (to amplify profits due to small percentage moves in a day). |
| Risk Factors | Overnight gaps, fundamental shifts. | Intraday noise, high transaction costs. |
| Screen Time | Low (Analysis 30-60 mins/day). | High (Full-time attention required). |
How Swing Trading Works (The Hybrid Model)
Successful swing trading is a systematic process of identifying value by layering different types of analysis. While the chart triggers the trade, the "Why" behind the move often determines its longevity.
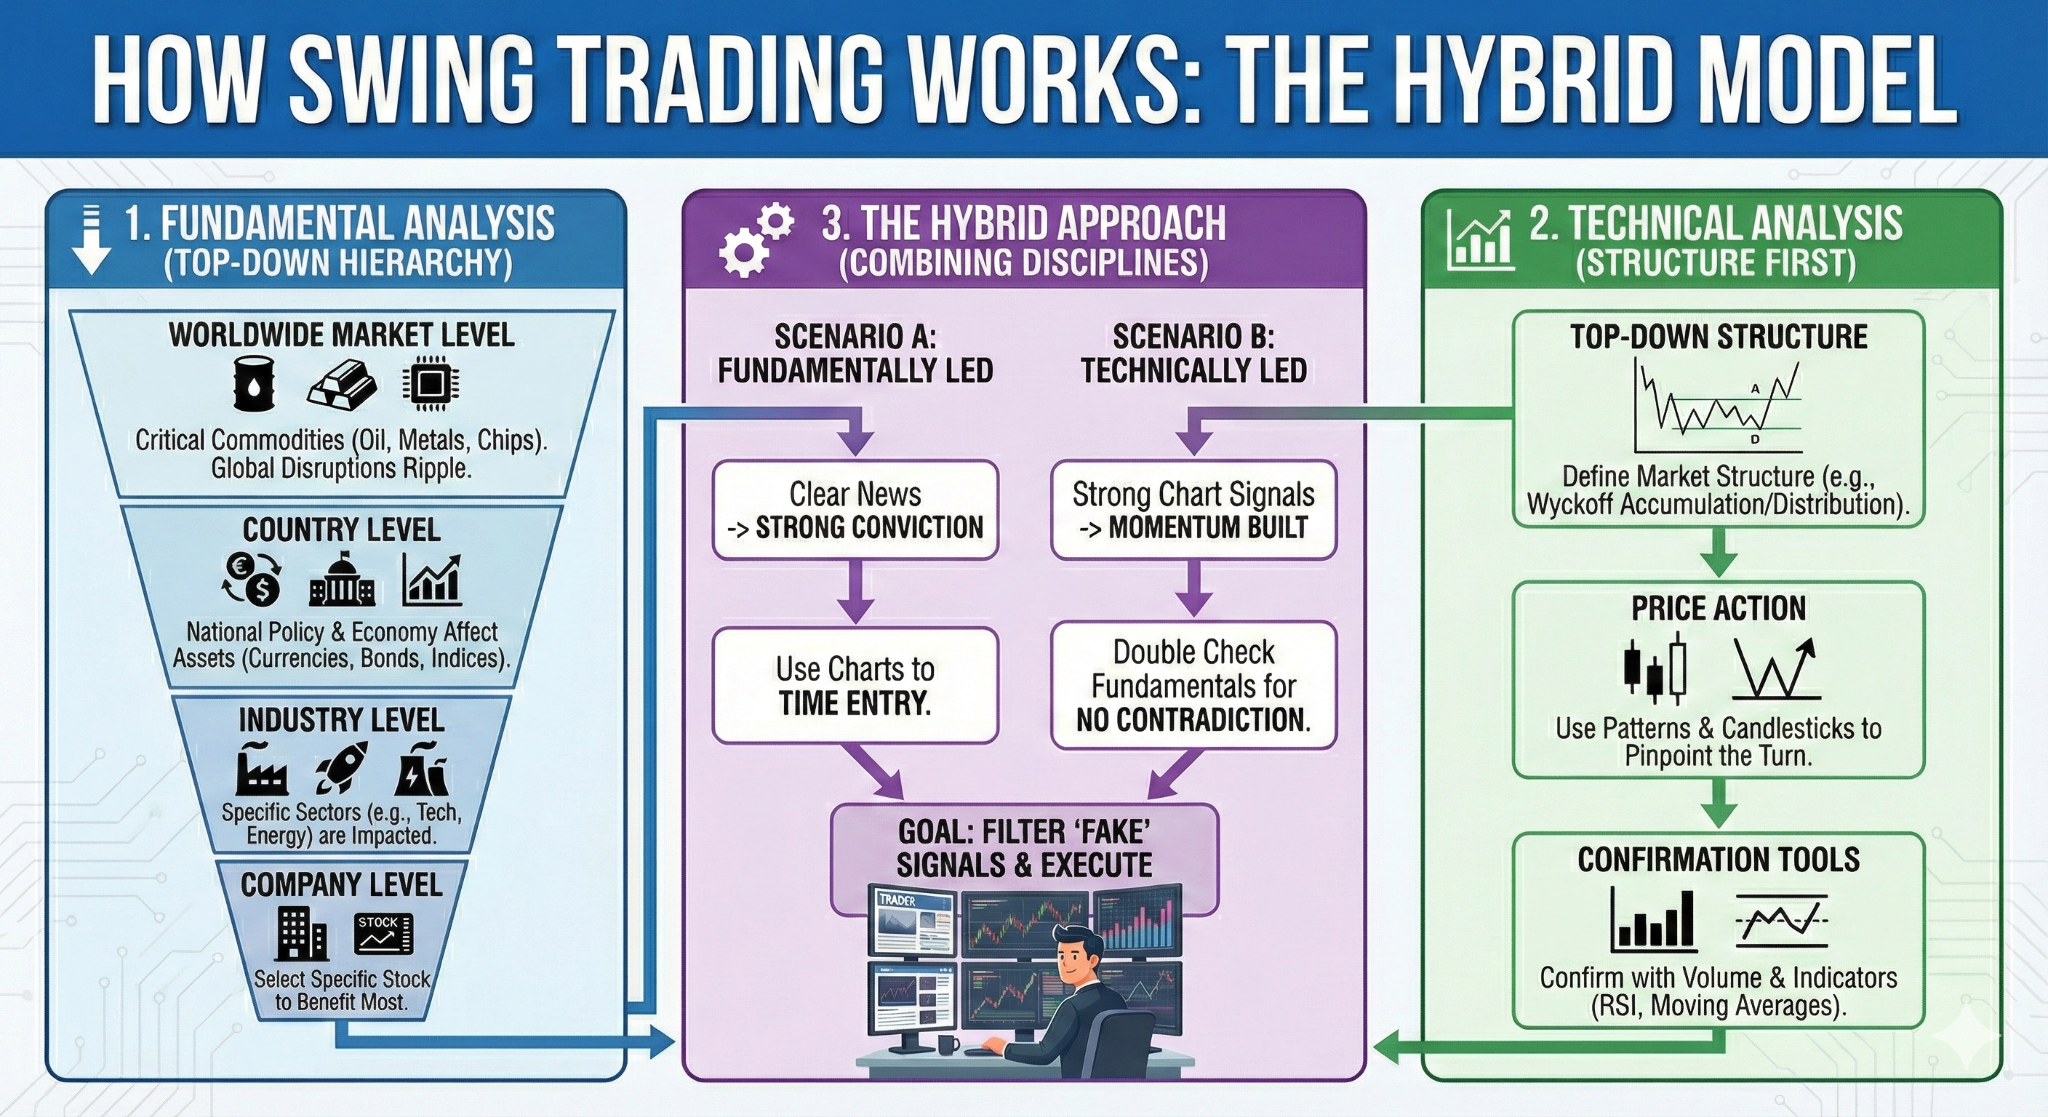
Fundamental Analysis: The Top-Down Hierarchy
For swing traders, fundamental analysis is not about reading balance sheets for 10-year value; it is about understanding the macro-catalysts that will push prices for the next few weeks.
You must approach this from a Top-Down perspective:
Worldwide Market Level: Evaluate critical commodities that grease the global economy, such as Oil, Metals, Rare Earths, and Chips. Disruptions here ripple through everything.
Recent Examples: Geo-political disruptions (e.g., Venezuela oil sanctions, US-China rare earth supply restrictions, US chip export restrictions to China).
Country Level: National health affects asset classes like Currencies, Bonds, and Country-specific Stock Indices (e.g., SPY, Nikkei, Hang Seng).
Recent Examples: Government policies (e.g., Strategic reserves for minerals, crypto deregulation, tariffs, or initiatives to restart domestic manufacturing).
Industry Level: Country-level policies trickle down to specific sectors (e.g., Defense, Tech, Energy).
Company Level: Finally, select the specific stock or asset within that industry that stands to benefit most.
Technical Analysis: Structure First
Once the fundamental direction is clear, technical analysis to decide when to execute or enter the position (buy or sell).
Top-Down Structure: Start by defining the Market Structure. The Wyckoff Method is widely considered the gold standard here for identifying Accumulation (buying) and Distribution (selling) phases.
Price Action: Zoom in on Chart Patterns and specific Candlestick formations to pinpoint the exact turn.
Confirmation Tools: Use Volume to confirm the validity of a bias (your guess) (e.g., high volume on a breakout) and standard Technical Indicators (like RSI or Moving Averages) only as secondary confirmation tools.
The Hybrid Approach
The most robust swing strategies combine both disciplines to filter out "fake" signals.
Scenario A (Fundamentally Led): You start with fundamentals. The news is loud and certain (e.g., a new tariff policy), giving you strong conviction. You then turn to the charts strictly to time your entry, waiting for the technical structure to align with your bias.
Scenario B (Technically Led): You encounter a chart with strong signals (e.g., a Strong Breakout Chart Pattern) indicating momentum has already been built. You then "double check" the fundamentals to ensure there is no impending news (like an earnings miss) that contradicts the chart or a confirmation of such theory.
How to Find Swing Candidates (The Quality Screen)
Before you analyze a chart, you must first filter the noise. With thousands of assets available, use a "Quality Screen" to narrow your focus to high-probability candidates.
Fundamental Screen: The Industry Leader
Focus on Market Leaders, not laggards. In a strong sector (e.g., Semiconductors), the industry leader (e.g., Nvidia) will typically move first and furthest compared to a smaller competitor.
Criteria: Look for the stock with the strongest relative strength in its sector, this means that they usually run first before the industry index runs. Metrics like P/E, P/B, ROE, Market Share are also useful.
Technical Screen: Liquidity & Cap
Swing trading requires Liquidity. You need to be able to enter and exit without moving the price yourself.
Market Cap: Filter for Mid-to-Large Cap stocks (e.g., >$2B). These stocks are less susceptible to manipulation and "pump and dump" schemes common in penny stocks.
Volume: Ensure the stock trades a minimum of 500k-1M shares per day. Thinly traded stocks often have wide spreads and erratic gaps that trigger stop-losses unnecessarily.
The Swing Trader's Routine
One of the biggest advantages of swing trading is the structured lifestyle. You do not need to be glued to a screen.
Weekend Routine (Top-Down): Spend 1-2 hours on Sunday reviewing Global Macro themes. Check commodities (Oil, Gold), check the weekly close of major indices (S&P 500, Nasdaq), and identify which sectors are rotating into favor.
Daily Quick Checks (Market Close): Spend 30 minutes after the market closes (or just before). Review your active positions and scan your watchlist for "trigger candles" on the Daily chart. Place your limit orders for the next day.
Intraday (The "Do Nothing" Phase): Ignore the noise. Unless a major news event hits, intraday price action are often just distractions. Trust your closing-basis analysis.
Common Swing Trading Strategies
There are many Swing Trading Strategies practiced by traders. We will only mention the most popular ones here, to keep it brief.
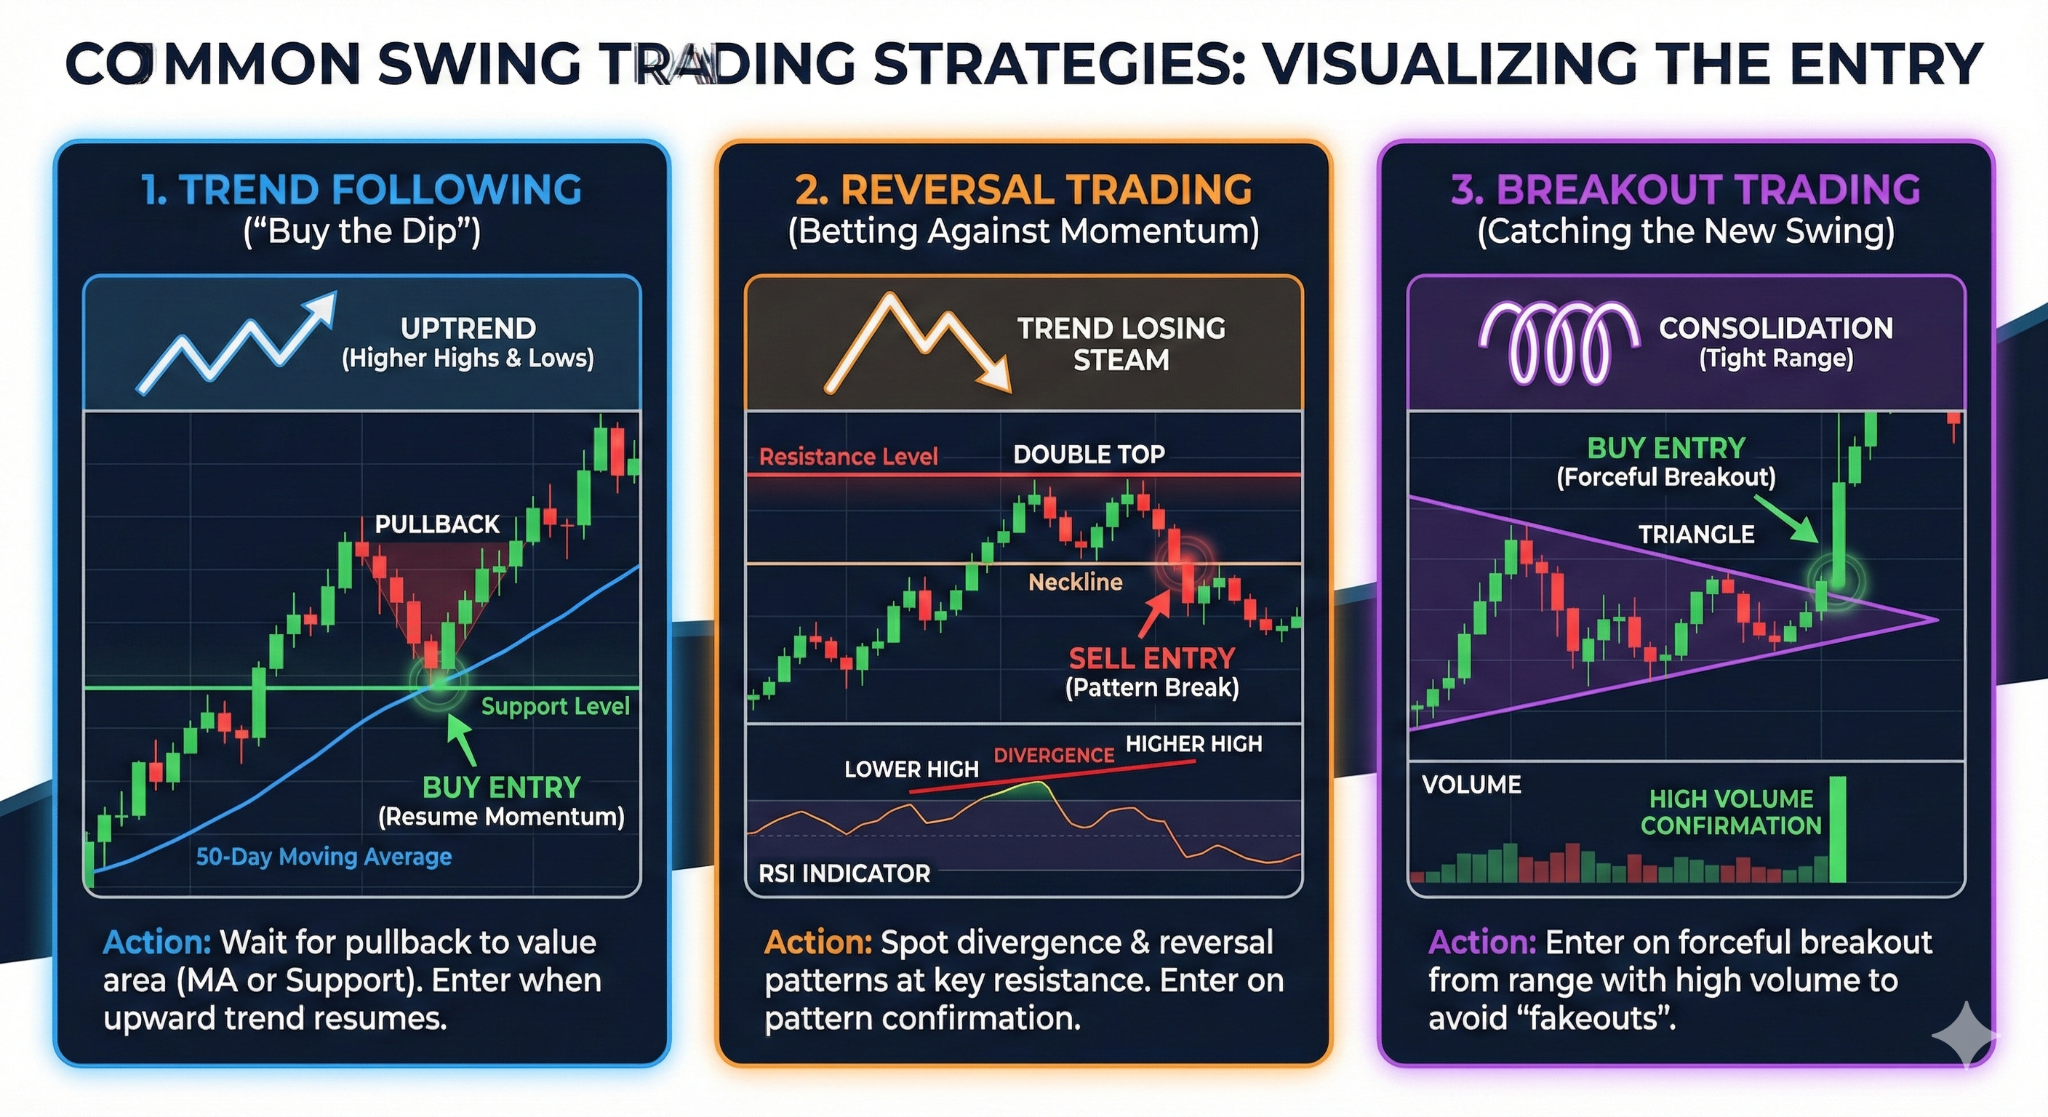
Trend Following
This is the classic "buy the dip" strategy.
Concept: Identify a clear uptrend (Higher Highs and Higher Lows).
Action: Wait for the price to pull back to a value area, such as the 50-day Moving Average or a previous resistance-turned-support level. Enter when price resumes the upward momentum.
Reversal Trading
Betting against the current momentum when it is overextended.
Concept: Identify a trend that is losing steam, often signaled by Divergence (e.g., Price makes a higher high, but RSI makes a lower high).
Action: Look for reversal patterns like Double Tops or Head and Shoulders at key higher-timeframe resistance levels.
Breakout Trading
Catching the start of a new swing after a period of consolidation.
Concept: Price compresses into a tight range (Triangle or Wedge).
Action: Enter when price forcefully breaks out of the range with high volume. The volume confirmation is critical to avoid "fakeouts."
Complete Swing Trading Plan with Risk Management
A swing trader without a plan is just a gambler with a chart. Your edge is defined by how you manage capital, not just your entries.
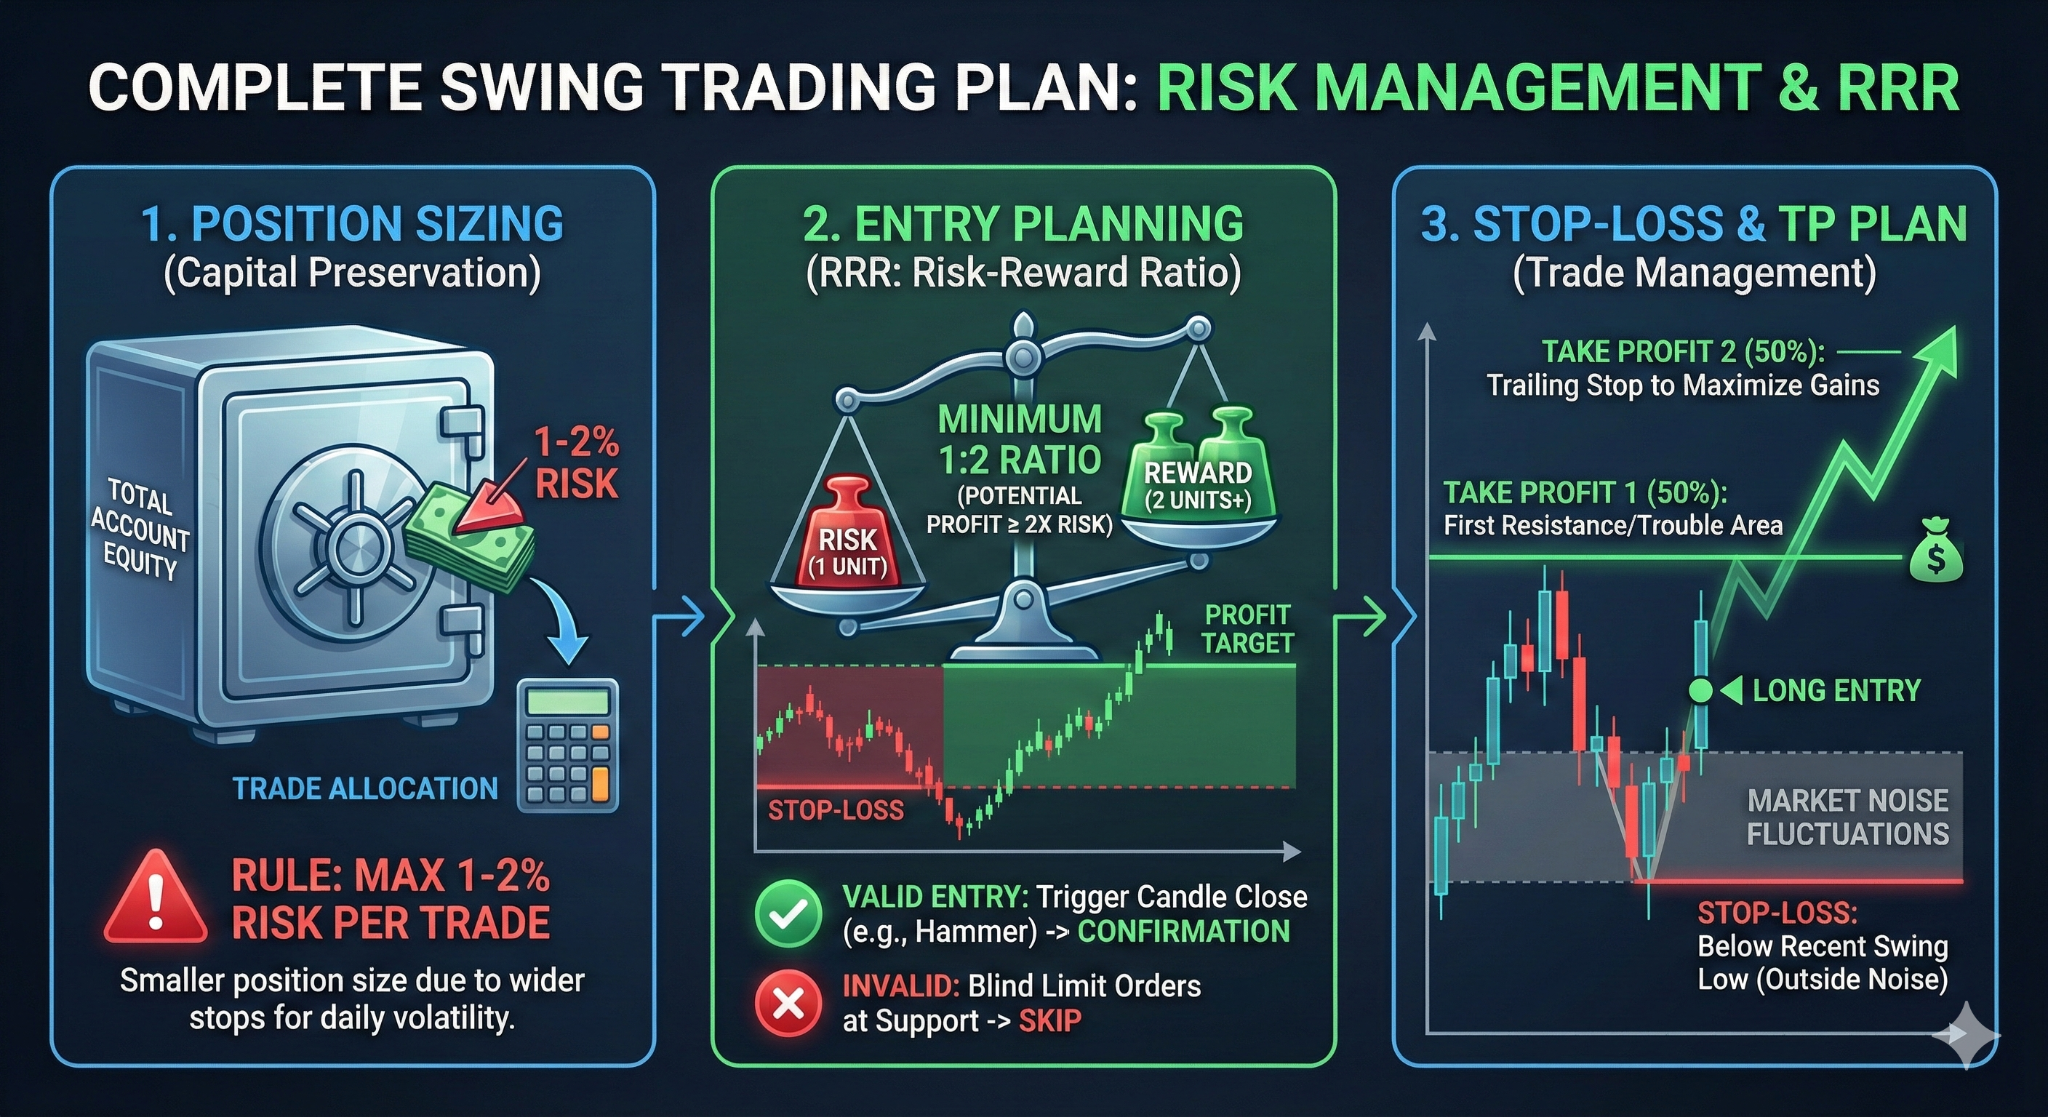
Position Sizing
Never risk more than 1-2% of your total account equity on a single swing trade. Because stop-losses in swing trading are often wider (to accommodate daily volatility), your position size must be smaller than that of a day trader to maintain the same dollar risk.
Entry Planning (RRR)
Before clicking "buy," calculate the Risk-Reward Ratio (RRR).
The Rule: If the potential profit is not at least 2x the potential risk (1:2 ratio), skip the trade.
Validation: Wait for a "trigger candle" (like a Hammer or Engulfing bar) to close before entering. Do not place limit orders blindly at support.
Stop-loss & TP Plan
Stop-Loss: Place stops outside the "noise" fluctuations of the market—typically below the most recent "swing low" for longs.
Take Profit: Scale out. Sell 50% of the position at the first trouble area (Resistance) and let the remaining 50% run with a Trailing Stop.
Advantages & Disadvantages
Advantages
Time Freedom: You can analyze markets before or after work, making it compatible with a full-time career.
Reduced Spread Impact: Because targets are larger (e.g., 100+ pips or 5%+ moves), the cost of the spread impacts your P&L significantly less than in scalping.
Calmer Psychology: Decisions are made on closed candles (Daily/4H), reducing impulsive emotional reactions to tick-by-tick noise.
Disadvantages
Overnight/Weekend Risk: Holding positions when the market is closed exposes you to "gaps"—where price opens significantly lower or higher against you, bypassing your Stop Loss.
Swap Fees: Holding CFD or Forex positions overnight incurs financing fees (swaps), which can eat into profits if the trade drags on too long.
Opportunity Cost: Capital is tied up in a single trade for days, preventing you from utilizing it elsewhere.
FAQ
What is the best timeframe for swing trading?
The Daily (D1) chart is the standard for identifying the overall trend and key levels, while the 4-Hour (H4) chart is typically used to fine-tune entry and exit execution.
How much capital do I need to start swing trading?
While you can start with small amounts, swing trading generally requires more capital than day trading (e.g., $2,000 - $5,000) to allow for proper position sizing with wider stop-losses while adhering to the 1% risk rule.
Can I swing trade cryptocurrencies?
Yes, crypto is highly suitable for swing trading due to its strong trending nature and high volatility. However, risk management must be tighter as crypto markets operate 24/7 and can experience massive moves while you sleep.
is swing trading profitable
how to select stocks for swing trading


