
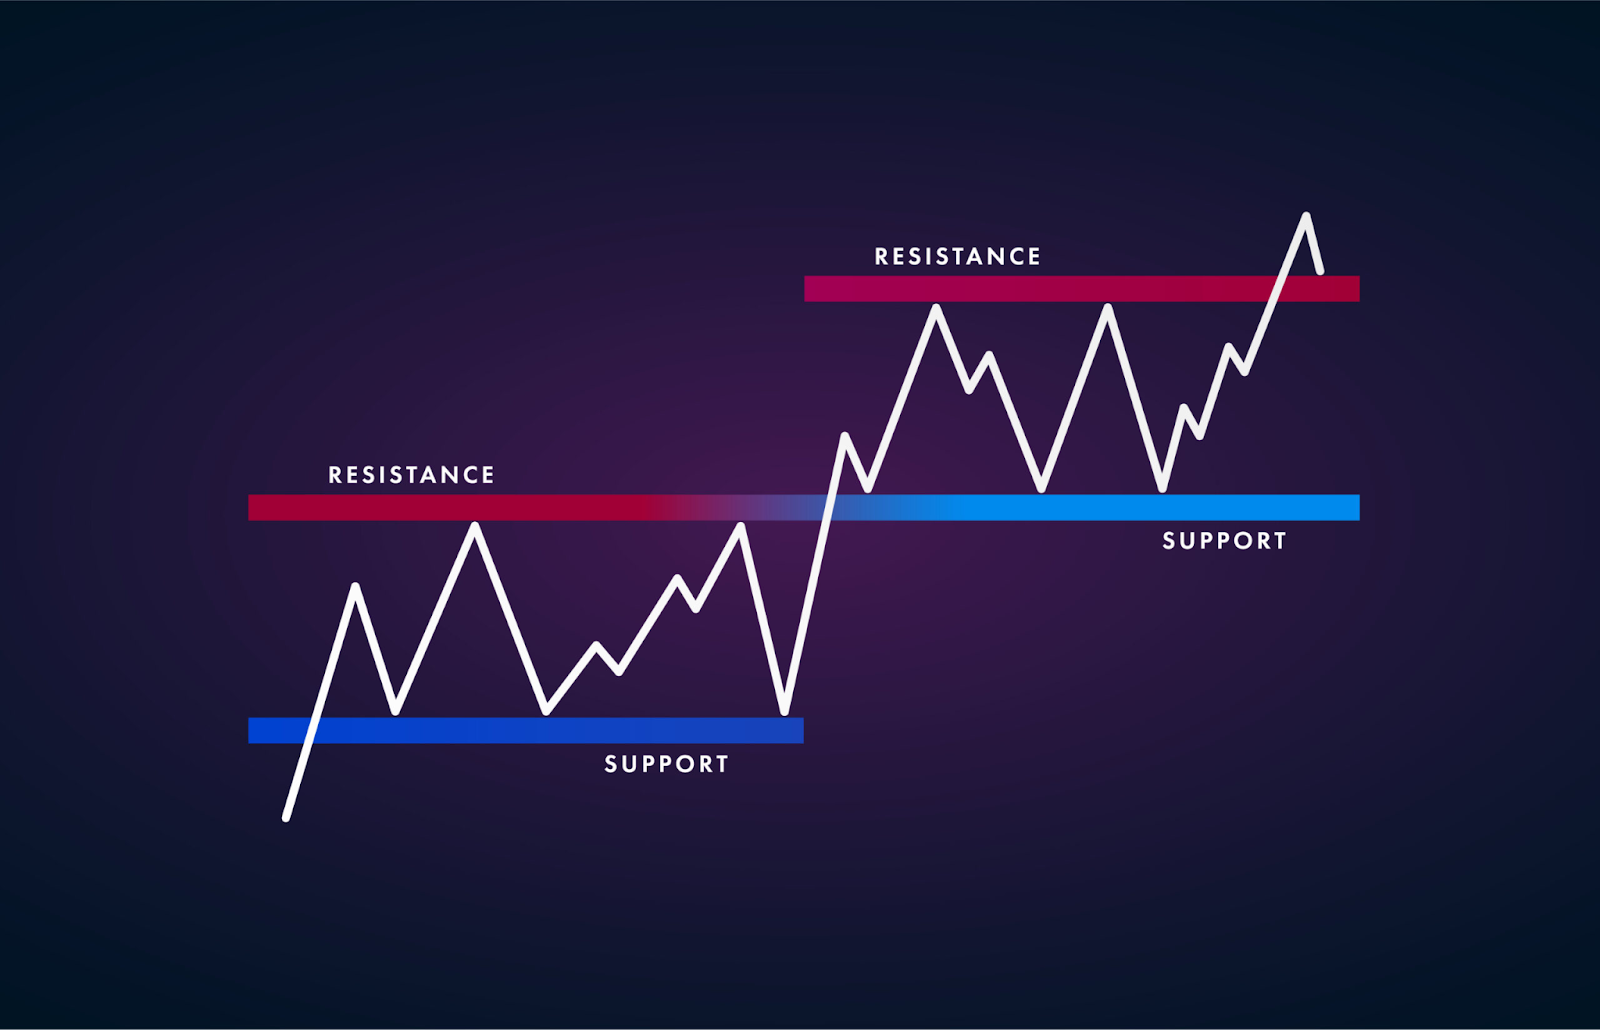
Understanding Support and Resistance
Support is the price level where a downward trend pauses due to buying interest. Resistance, on the other hand, is where an upward trend stalls as selling pressure increases. These support and resistance levels reflect market psychology and are frequently revisited on charts; if you’re new to plotting them, start by learning how to draw trend lines on a price chart.
Why Use Support and Resistance Indicators?
While manually identifying support and resistance can be effective, indicators provide a systematic approach to support and resistance trading, reducing errors and saving time. They allow traders to:
Quickly pinpoint key price zones.
Identify trends and reversals with precision.
Use historical data to forecast future price behavior.
Top 5 Support and Resistance Indicators
Pivot Points
Pivot points are widely used to identify potential market turning points. They are calculated based on the previous period's high, low, and close prices and generate multiple levels of support and resistance. They work best in range-bound markets. Add confirmation from reversal candlestick patterns for more reliable entries.
Pro Tip: Use pivot points with candlestick patterns for enhanced accuracy.
Micro example
Price closes at 1.2050 after a session with high 1.2100 and low 1.2000. Next session prints the daily pivot near 1.2050, with R1 at 1.2100 and S1 at 1.2000. Price dips to 1.2005 and forms a bullish rejection wick. Long at 1.2010 with stop below 1.1985 and first target 1.2050 then 1.2100.
Confluence callouts
Look for S1 or R1 aligning with a round number or yesterday high or low. Add a simple candle confirmation such as a pin bar or engulfing near the level. If the level aligns with a moving average or a prior range boundary, probability improves.
Timeframe guidance
Mark daily and weekly pivots for the main map. Execute on the one hour or fifteen minute chart for timing. Use the five minute only for entries after the one hour signal forms.
Fibonacci Retracement
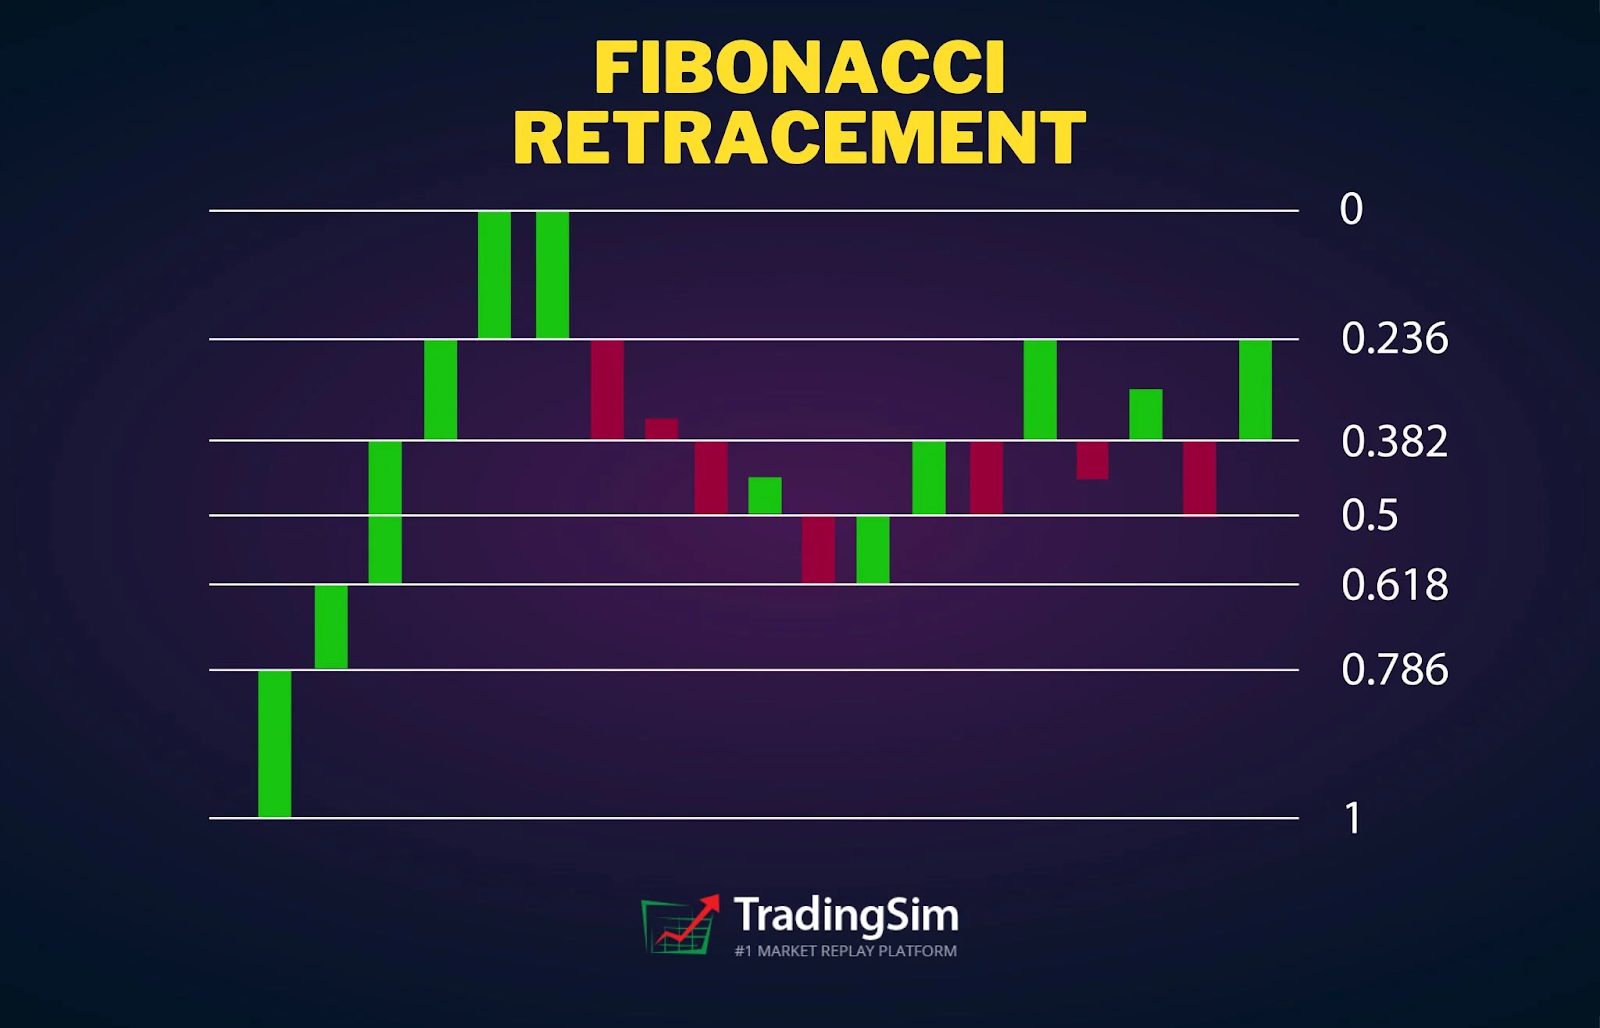
Fibonacci retracement levels are derived from the Fibonacci sequence and are used to predict potential retracement zones in a trending market. Common retracement levels include 38.2%, 50%, and 61.8%. Learn practical mapping in our guide to trading with Fibonacci.
Pro Tip: Combine Fibonacci levels with other indicators like RSI to confirm setups.
Micro example
An uptrend swings from 3.80 to 4.40. A pullback prints into the 38.2 percent area near 4.17 and leaves a higher low. Long at 4.18 with stop at 4.12 and targets at 4.32 and 4.40. If momentum fails at 4.32, trail the stop under the most recent higher low.
Confluence callouts
Best zones occur when 38.2 or 61.8 percent overlaps a prior top or a moving average or a volume node. A momentum indicator crossing from oversold into neutral adds confirmation. News quiet periods reduce noise around Fibonacci tests.
Timeframe guidance
Draw Fibonacci from swing high to swing low on the four hour or daily. Drop to the one hour for entries. Avoid redrawing the tool after every minor candle; update only after a clear swing completes.
Moving Averages
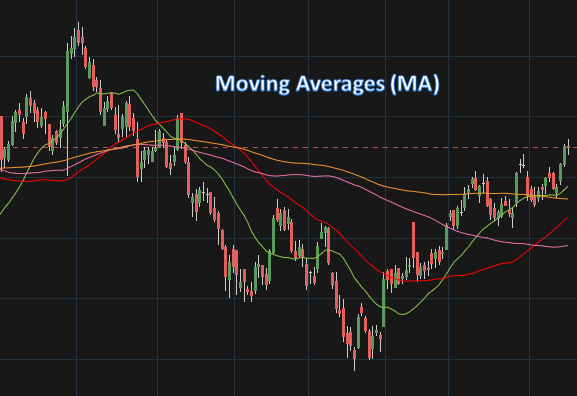
Moving averages smooth price data and can act as dynamic support and resistance. The 50-day and 200-day moving averages are particularly significant, often indicating long-term trend reversals.
Pro Tip: Use exponential moving averages (EMAs) to respond quicker to price changes.
Micro example
Price trades above the 200 day and pulls back to the 50 day near 128. The first test prints a strong bounce candle. Long at 128.20 with stop at 127.40 and target 129.80 then 131.00. If price closes below the 50 day and the 200 day is near, wait for a retest from underneath before considering shorts.
Confluence callouts
Dynamic support or resistance is stronger when the average aligns with a horizontal level. Add a higher high or higher low structure break for entry confirmation. Rising slope indicates trend health and improves the chance the level holds.
Timeframe guidance
Use the daily 50 and 200 for bias and main zones. Use the one hour 20 and 50 for timing pullbacks. In fast markets, an exponential average reacts faster than a simple average.
Volume Profile
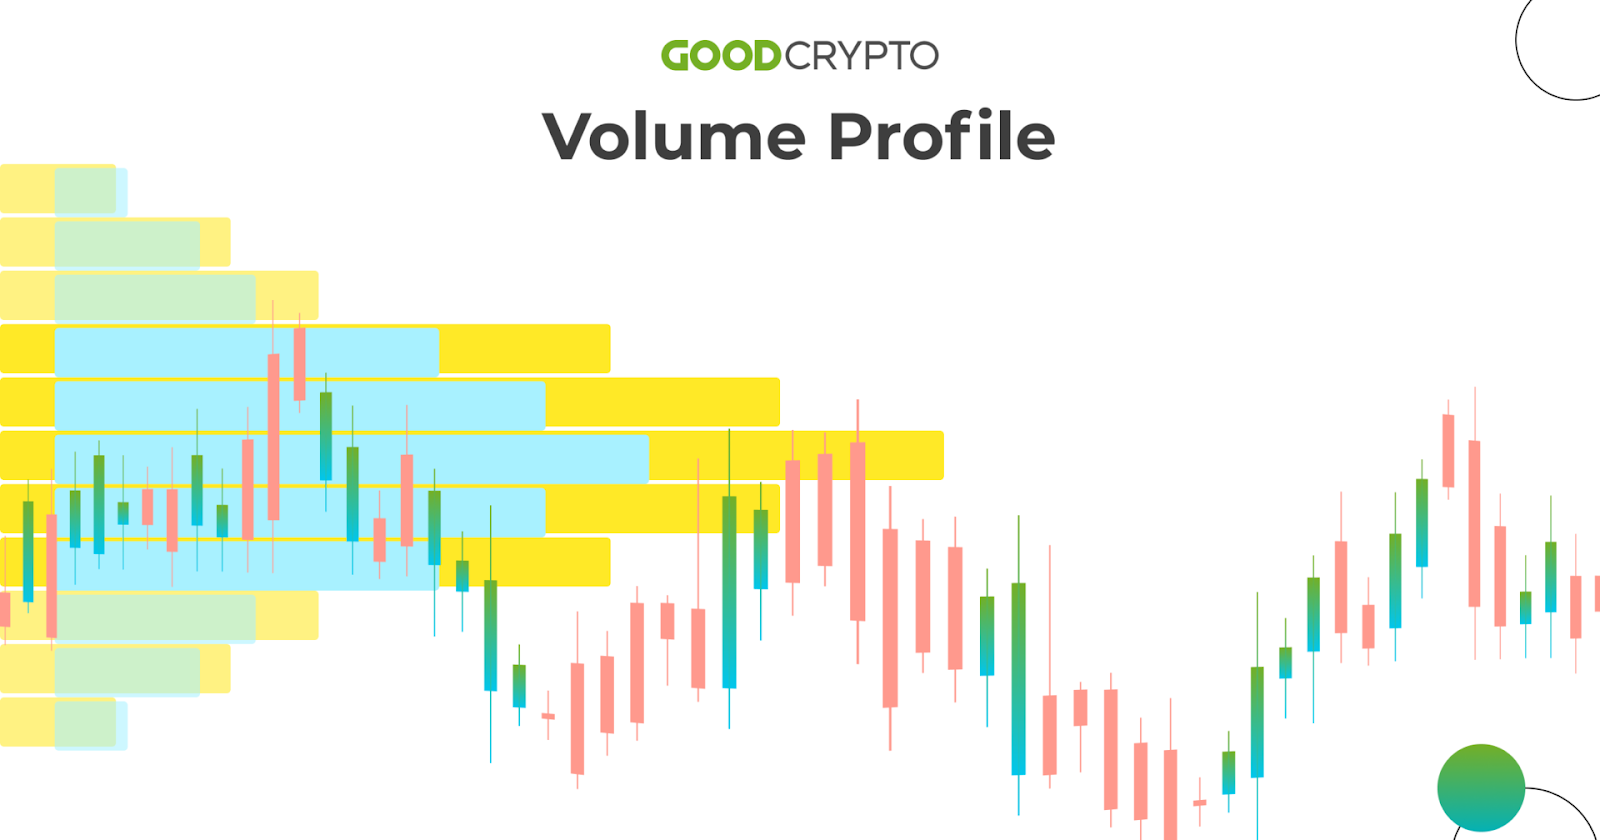
The volume profile displays trading activity over a specific price range. Areas with high trading volume often act as strong support or resistance zones, reflecting significant buyer and seller interest.
Pro Tip: Look for confluence between volume profile levels and traditional support/resistance zones.
Micro example
The profile shows a high volume node at 72.40 to 72.60 and a low volume pocket above 73.10. Price pulls back into 72.50 and pauses with tight candles. Long at 72.55 with stop at 72.30 and target 73.05 then a possible breakout into the low volume pocket toward 73.40.
Confluence callouts
Prefer trades where a high volume node aligns with a prior daily pivot or a moving average. For breakouts, look for price to leave a high volume node and enter a low volume pocket with increasing participation. Volume spikes at the level improve conviction.
Timeframe guidance
Build the profile from the visible range on the four hour or daily for structure. Time entries on the fifteen minute or one hour. Refresh the profile after major range expansions.
Trendlines
Trendlines are drawn by connecting consecutive highs or lows, indicating the overall trend direction. They act as psychological barriers that traders watch closely.
Pro Tip: Adjust trendlines regularly to account for changing market conditions.
Micro example
Connect two higher lows on a four hour chart to form an ascending trendline near 1.0930. Price returns to the line and prints a rejection wick and higher low. Long at 1.0940 with stop at 1.0915 and target 1.0990. If price breaks and retests from below, flip bias and look for a short on failure back under 1.0930.
Confluence callouts
A trendline touch is stronger when it aligns with a prior horizontal level or a Fibonacci retracement. Add a simple pattern trigger such as a break of the prior candle high for entries. Avoid forcing trendlines; three touches confirm validity better than two.
Timeframe guidance
Anchor trendlines on the four hour and daily for reliability. Drill down to the one hour for entries. Redraw after any strong swing that changes the line angle.
How to Use These Indicators Effectively
Confluence checklist
Combine a structural level such as a pivot or Fibonacci with a dynamic tool such as a moving average and a simple candle confirmation. Give extra weight to levels that align across multiple timeframes using top-down analysis. Avoid trading when a major economic release is due within the next hour.
Timeframe workflow
Map levels on the daily and four hour. Build a plan on the one hour. Trigger on the fifteen minute using a clear price action cue and a fixed risk plan—review risk-reward and use a trading calculator for position sizing. Review trades at the end of the session and update zones only after new swings form.
Common Mistakes to Avoid
Overreliance on Indicators: Use them as tools, not certainties.
Ignoring Timeframes: Support and resistance levels on higher timeframes carry more weight—apply a structured top-down analysis process.
Not Adjusting Levels: Markets evolve; update your levels periodically.
Conclusion: Maximizing Your Trades
Support and resistance indicators provide a structured approach to trading, helping you navigate the markets more confidently. Whether you're a beginner or an experienced trader, incorporating these tools into your support and resistance trading strategy can improve decision-making.
Leveraging these five best support and resistance indicators will equip you to handle market dynamics and pursue consistent results.
Start Trading Smarter with TMGM
TMGM provides a modern trading suite with advanced tools such as Trading Central, and industry-standard platforms MetaTrader 5 and MetaTrader 4. Take advantage of competitive spreads, fast execution, and multi-asset access.
Open your TMGM account today and start trading smarter—compare account types to find the right fit.


