


What is a Moving Average?
A Moving Average (MA) is a technical indicator that smooths price data by calculating an average of prices over a specific time period. It is one of the most widely used technical indicators in forex trading. It helps traders identify the market’s overall direction by smoothing out short-term price fluctuations. Instead of reacting to every price movement, the moving average creates a clearer visual trend by averaging past prices over a selected period. This helps traders understand whether the market is trending upward, downward, or moving sideways.
By reducing the noise caused by constant price changes, the moving average allows traders to focus on the bigger picture rather than reacting impulsively. The moving average does not predict future price movements. Instead, it confirms the direction of the current trend. Traders use it to identify trend continuation, potential reversals, and dynamic areas of support or resistance.
Types of Moving Average
There are several types of moving averages used in technical analysis for trading, but forex traders most commonly use the simple and exponential moving averages. Each type offers different insights into market conditions and can be used alone or in combination.
Simple Moving Average (SMA)
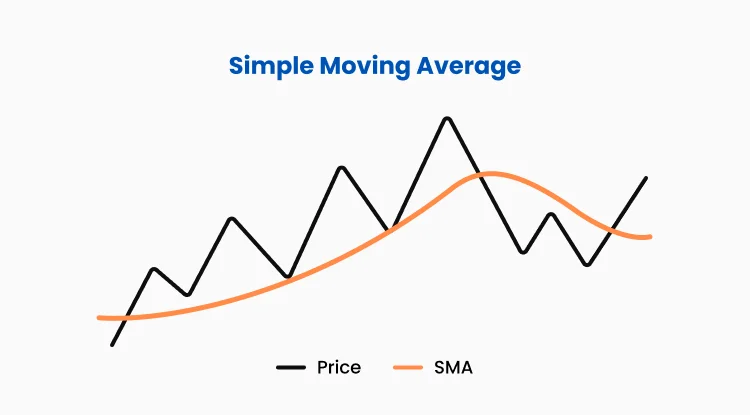
The simple moving average calculates the average closing price over a selected number of periods. It provides a smooth line on the chart that helps traders identify long-term trends. Because it treats each price point equally, the simple moving average responds more slowly to sudden market changes. This makes it useful in stable, trending markets where price movements are more gradual.
A trader may use the 50-period simple moving average to observe medium-term trends and the 200-period simple moving average to analyze long-term market direction. When the price stays consistently above the SMA, it often signals a bullish trend. When the price remains below, it usually indicates a bearish trend.
Exponential Moving Average (EMA)
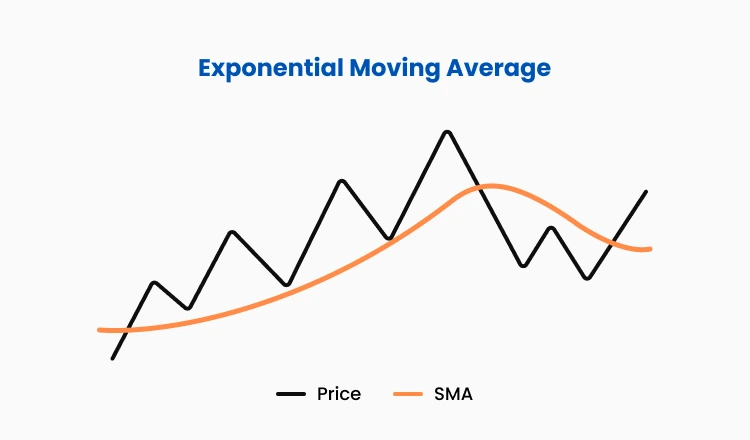 The exponential moving average (EMA) gives more weight to recent price activity, making it more sensitive to current market conditions. This responsiveness makes the exponential moving average suitable for traders who follow short-term strategies or who need faster signals to enter and exit trades.
Traders often use combinations such as the 9- and 20-period EMAs to spot trend reversals. When a short-term EMA crosses above a longer-term EMA, it can indicate that upward momentum is building. When it crosses below, it may signal a shift into a downward trend. Because the exponential moving average reacts quickly, it may produce more signals during market volatility, so traders often confirm them with additional tools such as the Relative Strength Index (RSI) or Moving Average Convergence Divergence (MACD).
How to Calculate Moving Average?
A trader who understands how the calculation works is better equipped to choose the appropriate moving average settings for different market conditions. Fast-moving averages work best in short-term trading strategies, while slower-moving averages are more suitable for long-term trend analysis.
Moving Average Formula
The moving average formula depends on the type of moving average used.
Simple Moving Average (SMA) Formula
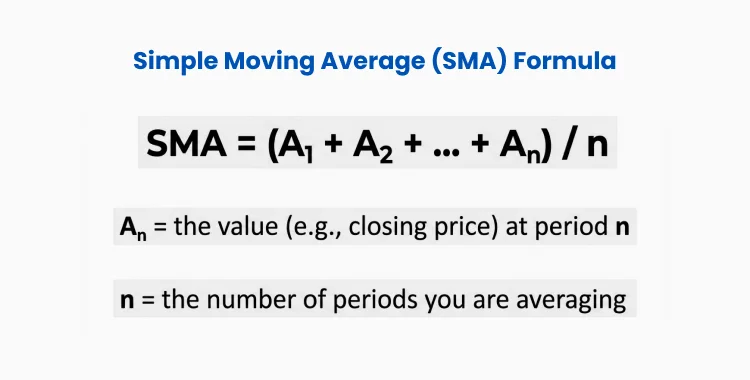 Simple Moving Average (SMA) = (A1 + A2 + … + An) ÷ n
An = the value (e.g., closing price) at period n
n = the number of periods you are averaging
For example, if a trader wants to calculate a 10-period simple moving average, they add the closing prices of the last ten candlesticks and divide the sum by ten. The result is a single plotted point on the chart. As each new candlestick forms, the calculation updates by removing the oldest price and adding the newest one.
Exponential Moving Average (EMA) Formula
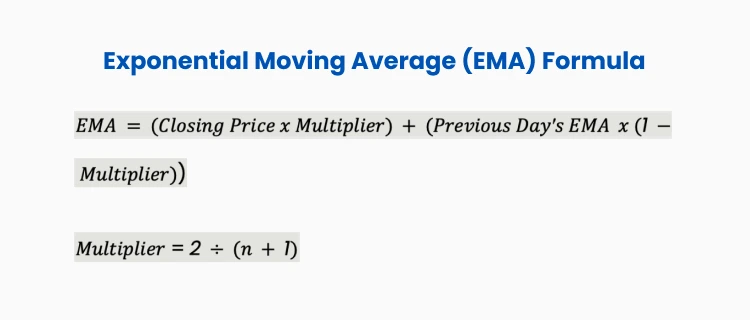 The EMA formula gives more weight to recent prices.
EMA = (Closing Price × Multiplier) + (Previous Day’s EMA × (1 − Multiplier))
Multiplier = 2 ÷ (n + 1)
Ten-day EMA as an example:
Step 1: Calculate the Multiplier
Multiplier = 2 ÷ (10 + 1) = 0.1818
Step 2: Get yesterday’s EMA and today’s closing price
Assume that:
Yesterday’s EMA = 1.2500
Today’s closing price = 1.2550
EMA Today = (1.2550 × 0.1818) + (1.2500 × (1 − 0.1818))
EMA Today = 0.2289 + 1.0228 = 1.2517
Moving Average Strategy: Using Moving Average in Forex Trading Strategies
The moving average in forex can be used directly for identifying trends or as part of more advanced forex trading strategies.
Here are two effective strategies:
Moving Average Crossover Strategy
This strategy uses two moving averages of different time periods:
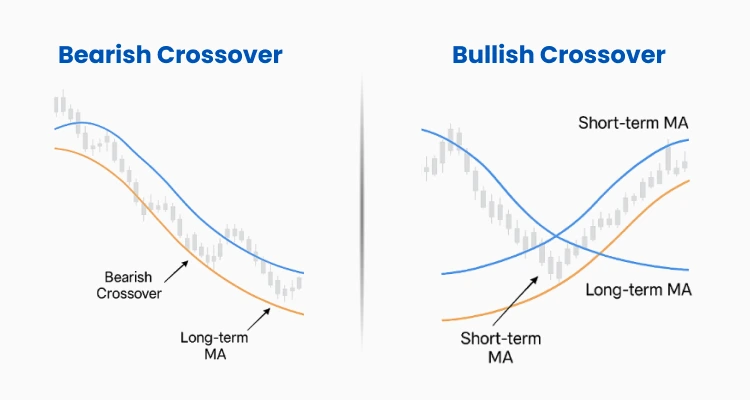
Bullish Crossover: When a short-term moving average (e.g., 50-day) crosses above a long-term moving average (e.g., 200-day), it signals an uptrend.
Bearish Crossover: When a short-term MA crosses below a long-term MA, it indicates a downtrend.
Example: In EUR/USD, a 50-day MA crossing above the 200-day MA (Golden Cross) signals a strong upward move and can offer a potential entry point.
Dynamic Support and Resistance Strategy
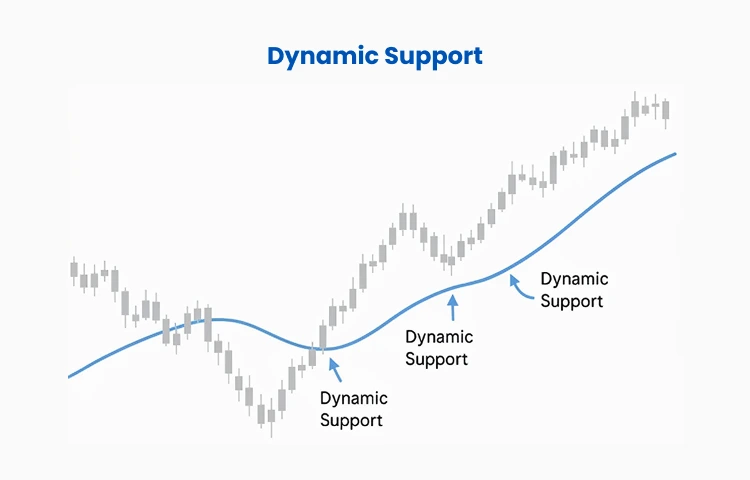
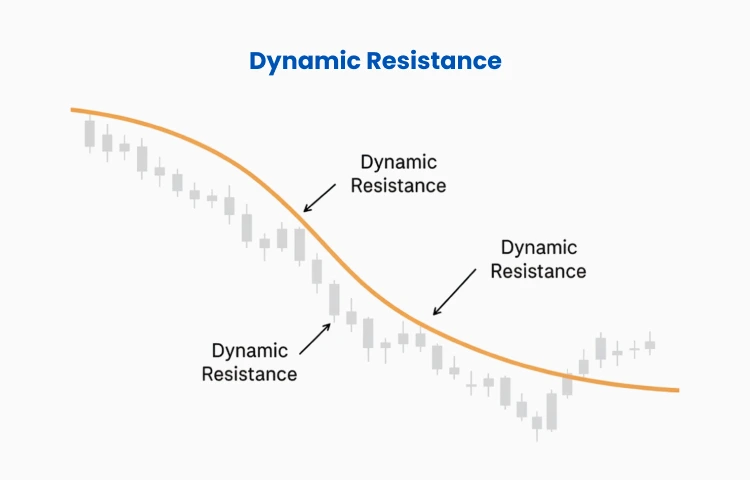
Moving averages can act as dynamic support and resistance levels:
Support: In an uptrend, prices often bounce off the moving average (e.g., 50-day MA).
Resistance: In a downtrend, prices frequently struggle to break above the moving average.
Example: In GBP/USD, if prices repeatedly bounce off the 50-day moving average, it confirms the MA as a support level, presenting buy opportunities on pullbacks.
Combining Moving Averages with Other Indicators
When the market is trending strongly, moving averages help traders join the trend at suitable entry points without chasing price movements. However, moving averages are less effective in ranging markets, where prices fluctuate within a narrower channel. For this reason, many traders combine the moving average with other indicators to filter out weak signals and confirm trend direction.
Below are other indicators that traders use to combine with moving average:
Relative Strength Index (RSI): Use the RSI to confirm overbought or oversold conditions. For example, if prices trade below the MA and the RSI shows oversold, it could signal a buy opportunity.
MACD (Moving Average Convergence/Divergence): Combines momentum and trend analysis to validate moving-average signals.
Bollinger Bands: Use Bollinger Bands to identify volatility and confirm breakout signals near moving averages.
By combining tools, traders can reduce false signals and improve trade accuracy.
Avoiding Common Mistakes with Moving Averages
Some beginners rely solely on the moving average without considering market conditions. This can result in late or misleading entry points, especially in sideways markets. It is crucial to assess market trends before applying moving-average strategies. Another common mistake is using too many moving averages on the same chart. This can create confusion and make signals difficult to interpret. A focused and consistent approach, combined with disciplined position sizing, makes the moving average more effective as a trading tool.
Trade Smarter with TMGM
Ready to take your trading to the next level? TMGM provides cutting-edge tools, real-time charting capabilities, and access to advanced indicators, including moving averages, to help you execute your strategies with confidence.
Why trade with TMGM?
Advanced Platforms: Access MetaTrader 4 (MT4) and MetaTrader 5 (MT5) with customizable charts and real-time market data.
24/5 Customer Support: Expert support to help you trade seamlessly.
Competitive Spreads: Maximize your returns with low trading costs.
Educational Resources: Improve your skills with webinars, tutorials, and insights from trading experts.
You can also use TMGM’s online trading calculator to plan margin and position size before entering a trade.
Start your journey today with TMGM and master moving averages in the forex market. Open your account now and trade smarter!


