


Shooting Star Candlestick Pattern at a Glance
1 A shooting star candlestick is a one candle bearish reversal pattern.
2 The pattern matters most after an uptrend and near resistance.
3 Most traders confirm the setup with the next candle, RSI, MACD, stochastic, or volume before entering.
4 The shooting star and inverted hammer look the same, but the interpretation is different.
What Is the Shooting Star Candlestick Pattern?
A shooting star is a bearish reversal candlestick pattern that appears at the top of an uptrend. It forms when buyers drive prices higher during the session, but sellers absorb the move and force price back down before the close.
How to Interpret Shooting Star Candlestick Pattern?
The pattern reflects a failed uptrend. Buyers were testing higher prices, but sellers took control before the candle closed.
That shift does not confirm a downtrend by itself. It tells traders that the prior upside momentum may be losing strength and that the next candle now matters more.
How to Identify a Shooting Star Pattern?
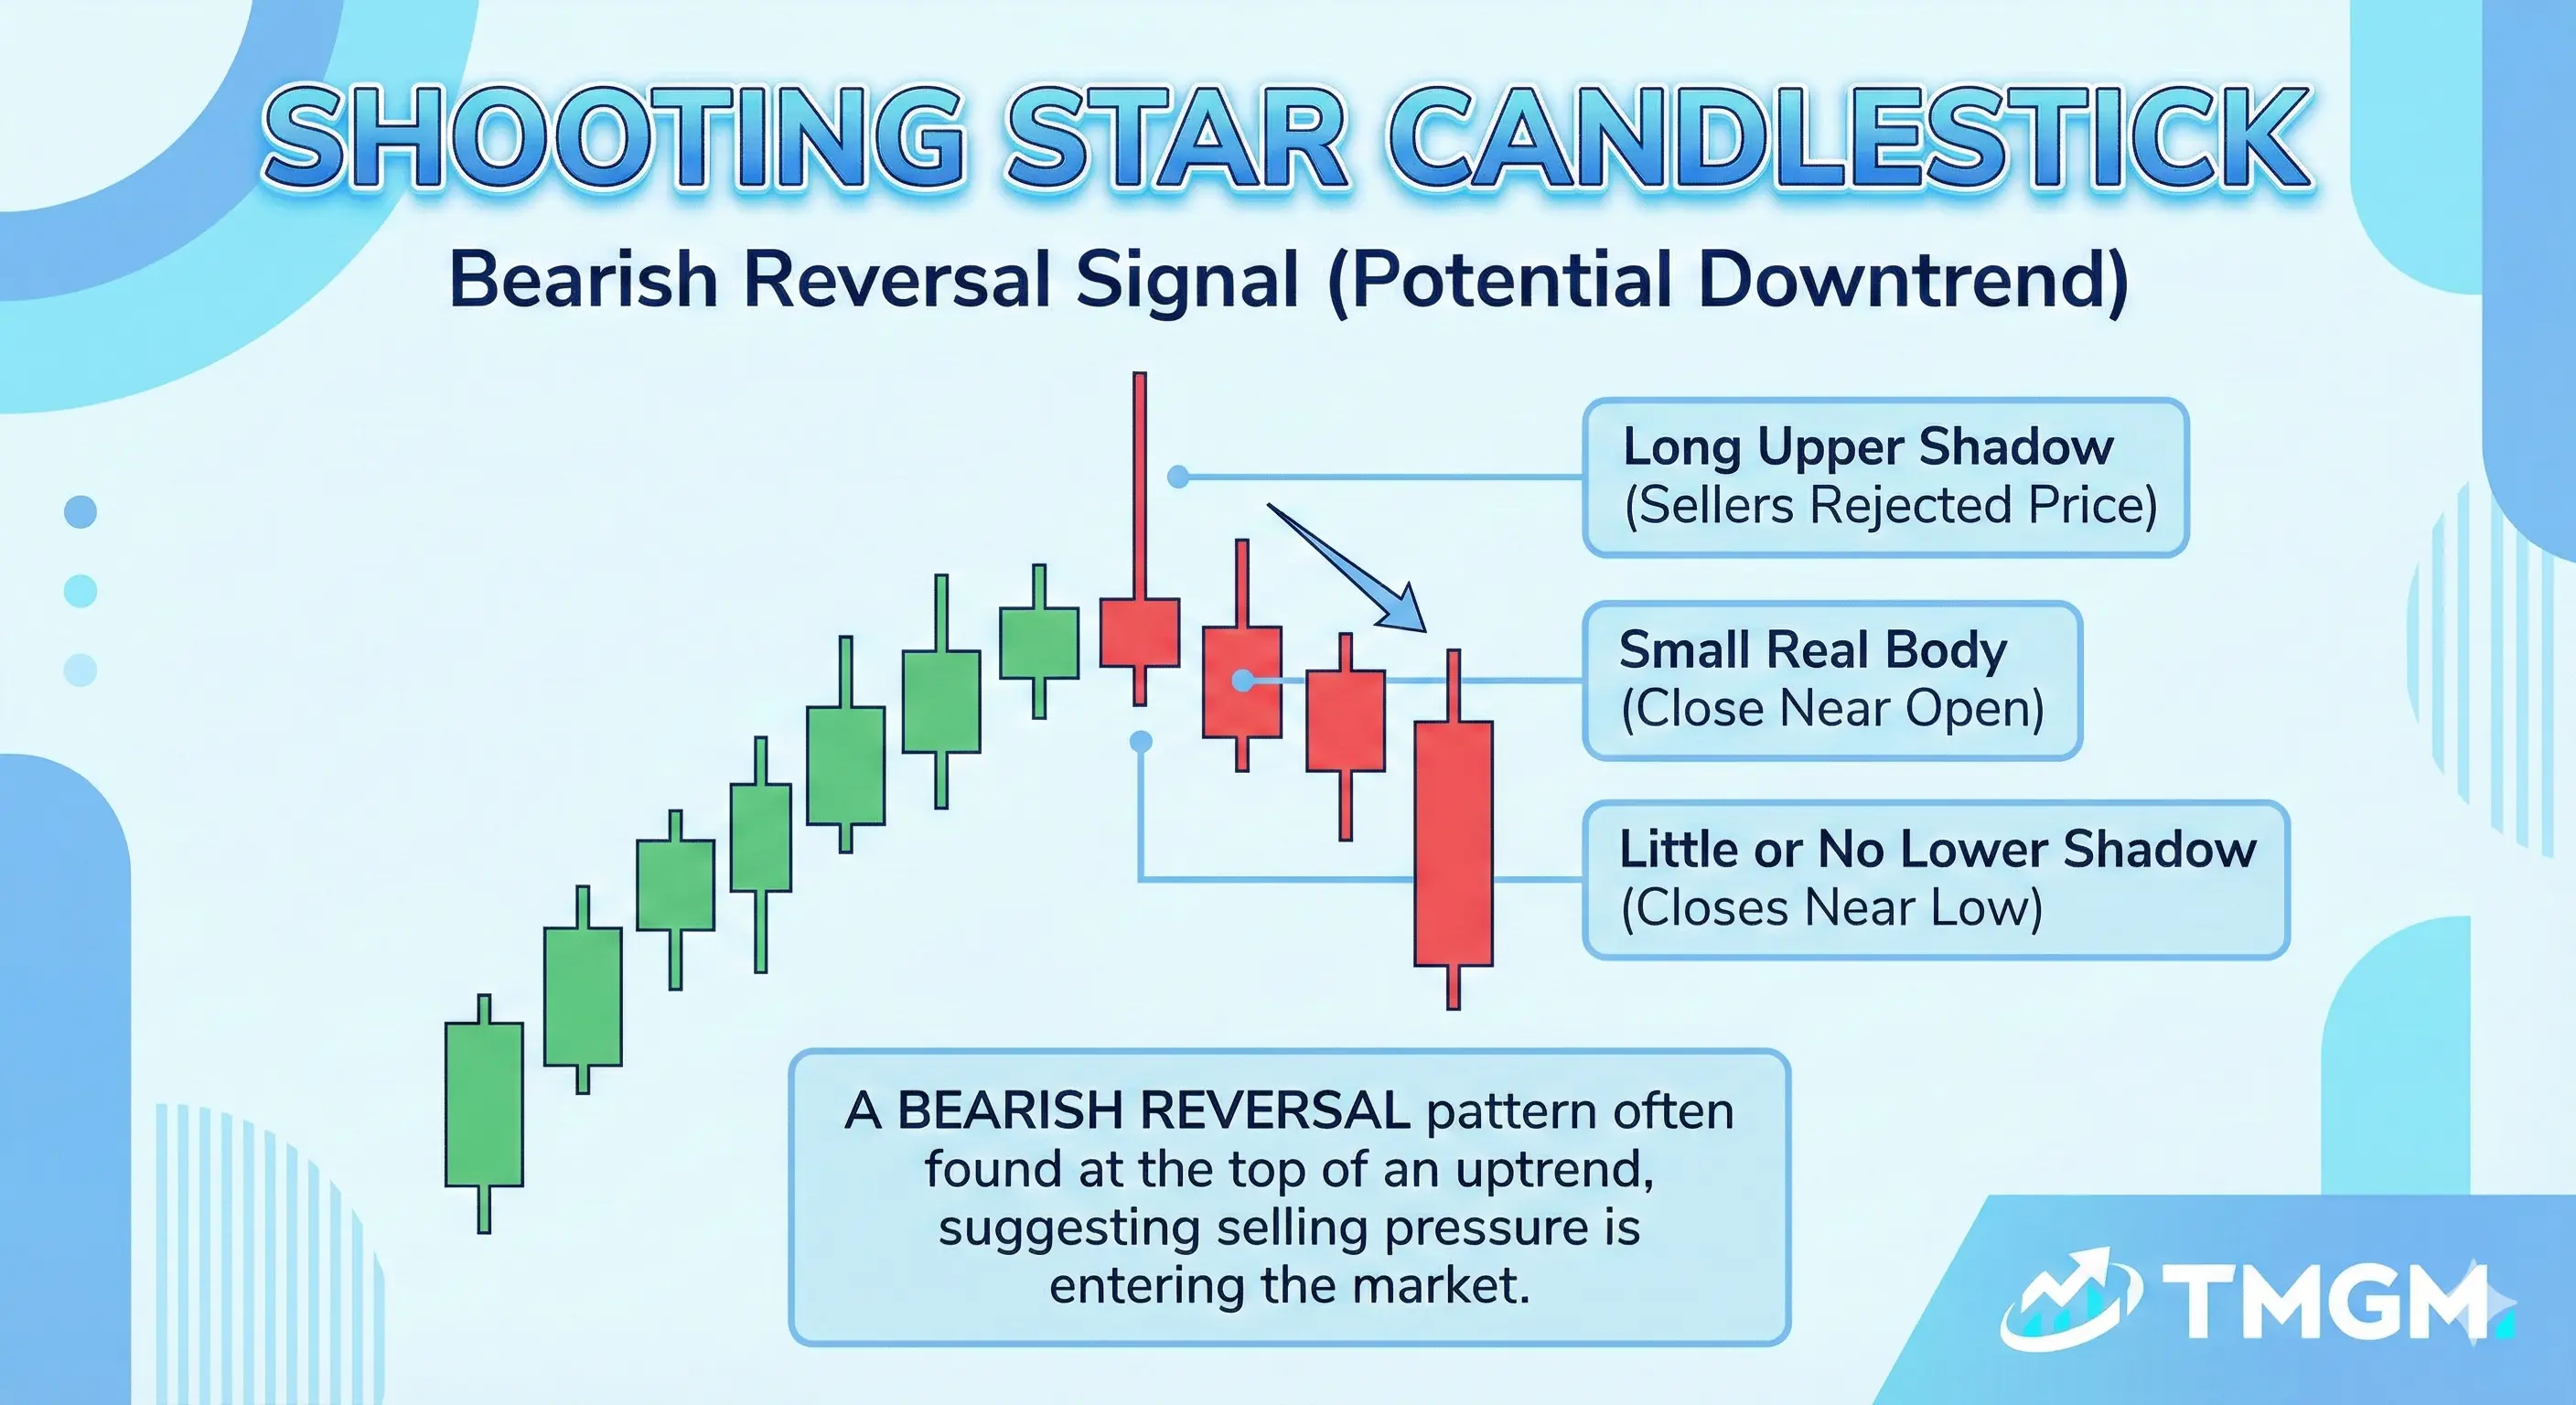
A clean shooting star setup usually has three parts: trend context, candle shape, and confirmation.
• Trend context: The candle appears after a visible bullish run or extended upward leg.
• Real body: The body is small and sits near the low of the range.
• Upper wick: The upper shadow is long and clearly shows rejection of higher prices.
• Lower wick: The lower shadow is minimal or absent.
Confirmation becomes stronger when the next candle closes bearish, the pattern forms at a prior resistance zone or major Fibonacci retracement, and momentum technical indicators such as RSI, MACD, or the stochastic oscillator begin to turn lower. Volume context can also help confirm that buyers failed to maintain control.
Important
A shooting star that forms inside sideways price action is often just noise, not a real reversal signal.
What Is a Shooting Star Pattern Trading Strategy?
The standard use case is a trend reversal trade after an extended rally. Traders wait for the candle to print near resistance, then use confirmation to decide whether sellers are actually taking over.
A practical way to trade it is to treat the candle low as the trigger level. If the next candle breaks below that low and holds below it, the bearish case becomes stronger.
Pro Tip
The more stretched the prior uptrend is, the more meaningful the rejection can become.
Shooting Star Candlestick Pattern Real Life Example Using XAUUSD
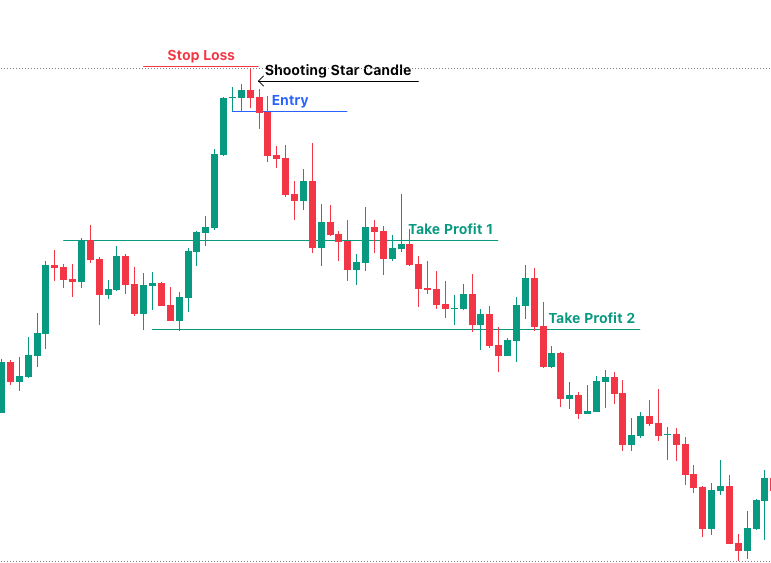
In this EURUSD Daily Chart example, gold rallies into resistance and prints a shooting star candlestick (July 18th, 2023) at the top of the move, showing that buyers pushed price higher but failed to
The reversal setup is confirmed when price breaks below the shooting star low, with the stop loss placed above the wick high because a move back above that level would invalidate the bearish reversal.
Take Profit 1 is set at the previous swing high, which can act as new support after the earlier breakout, while Take Profit 2 is placed at the previous swing low, which marks the next lower support area if bearish momentum continues.
Shooting Star vs Inverted Hammer
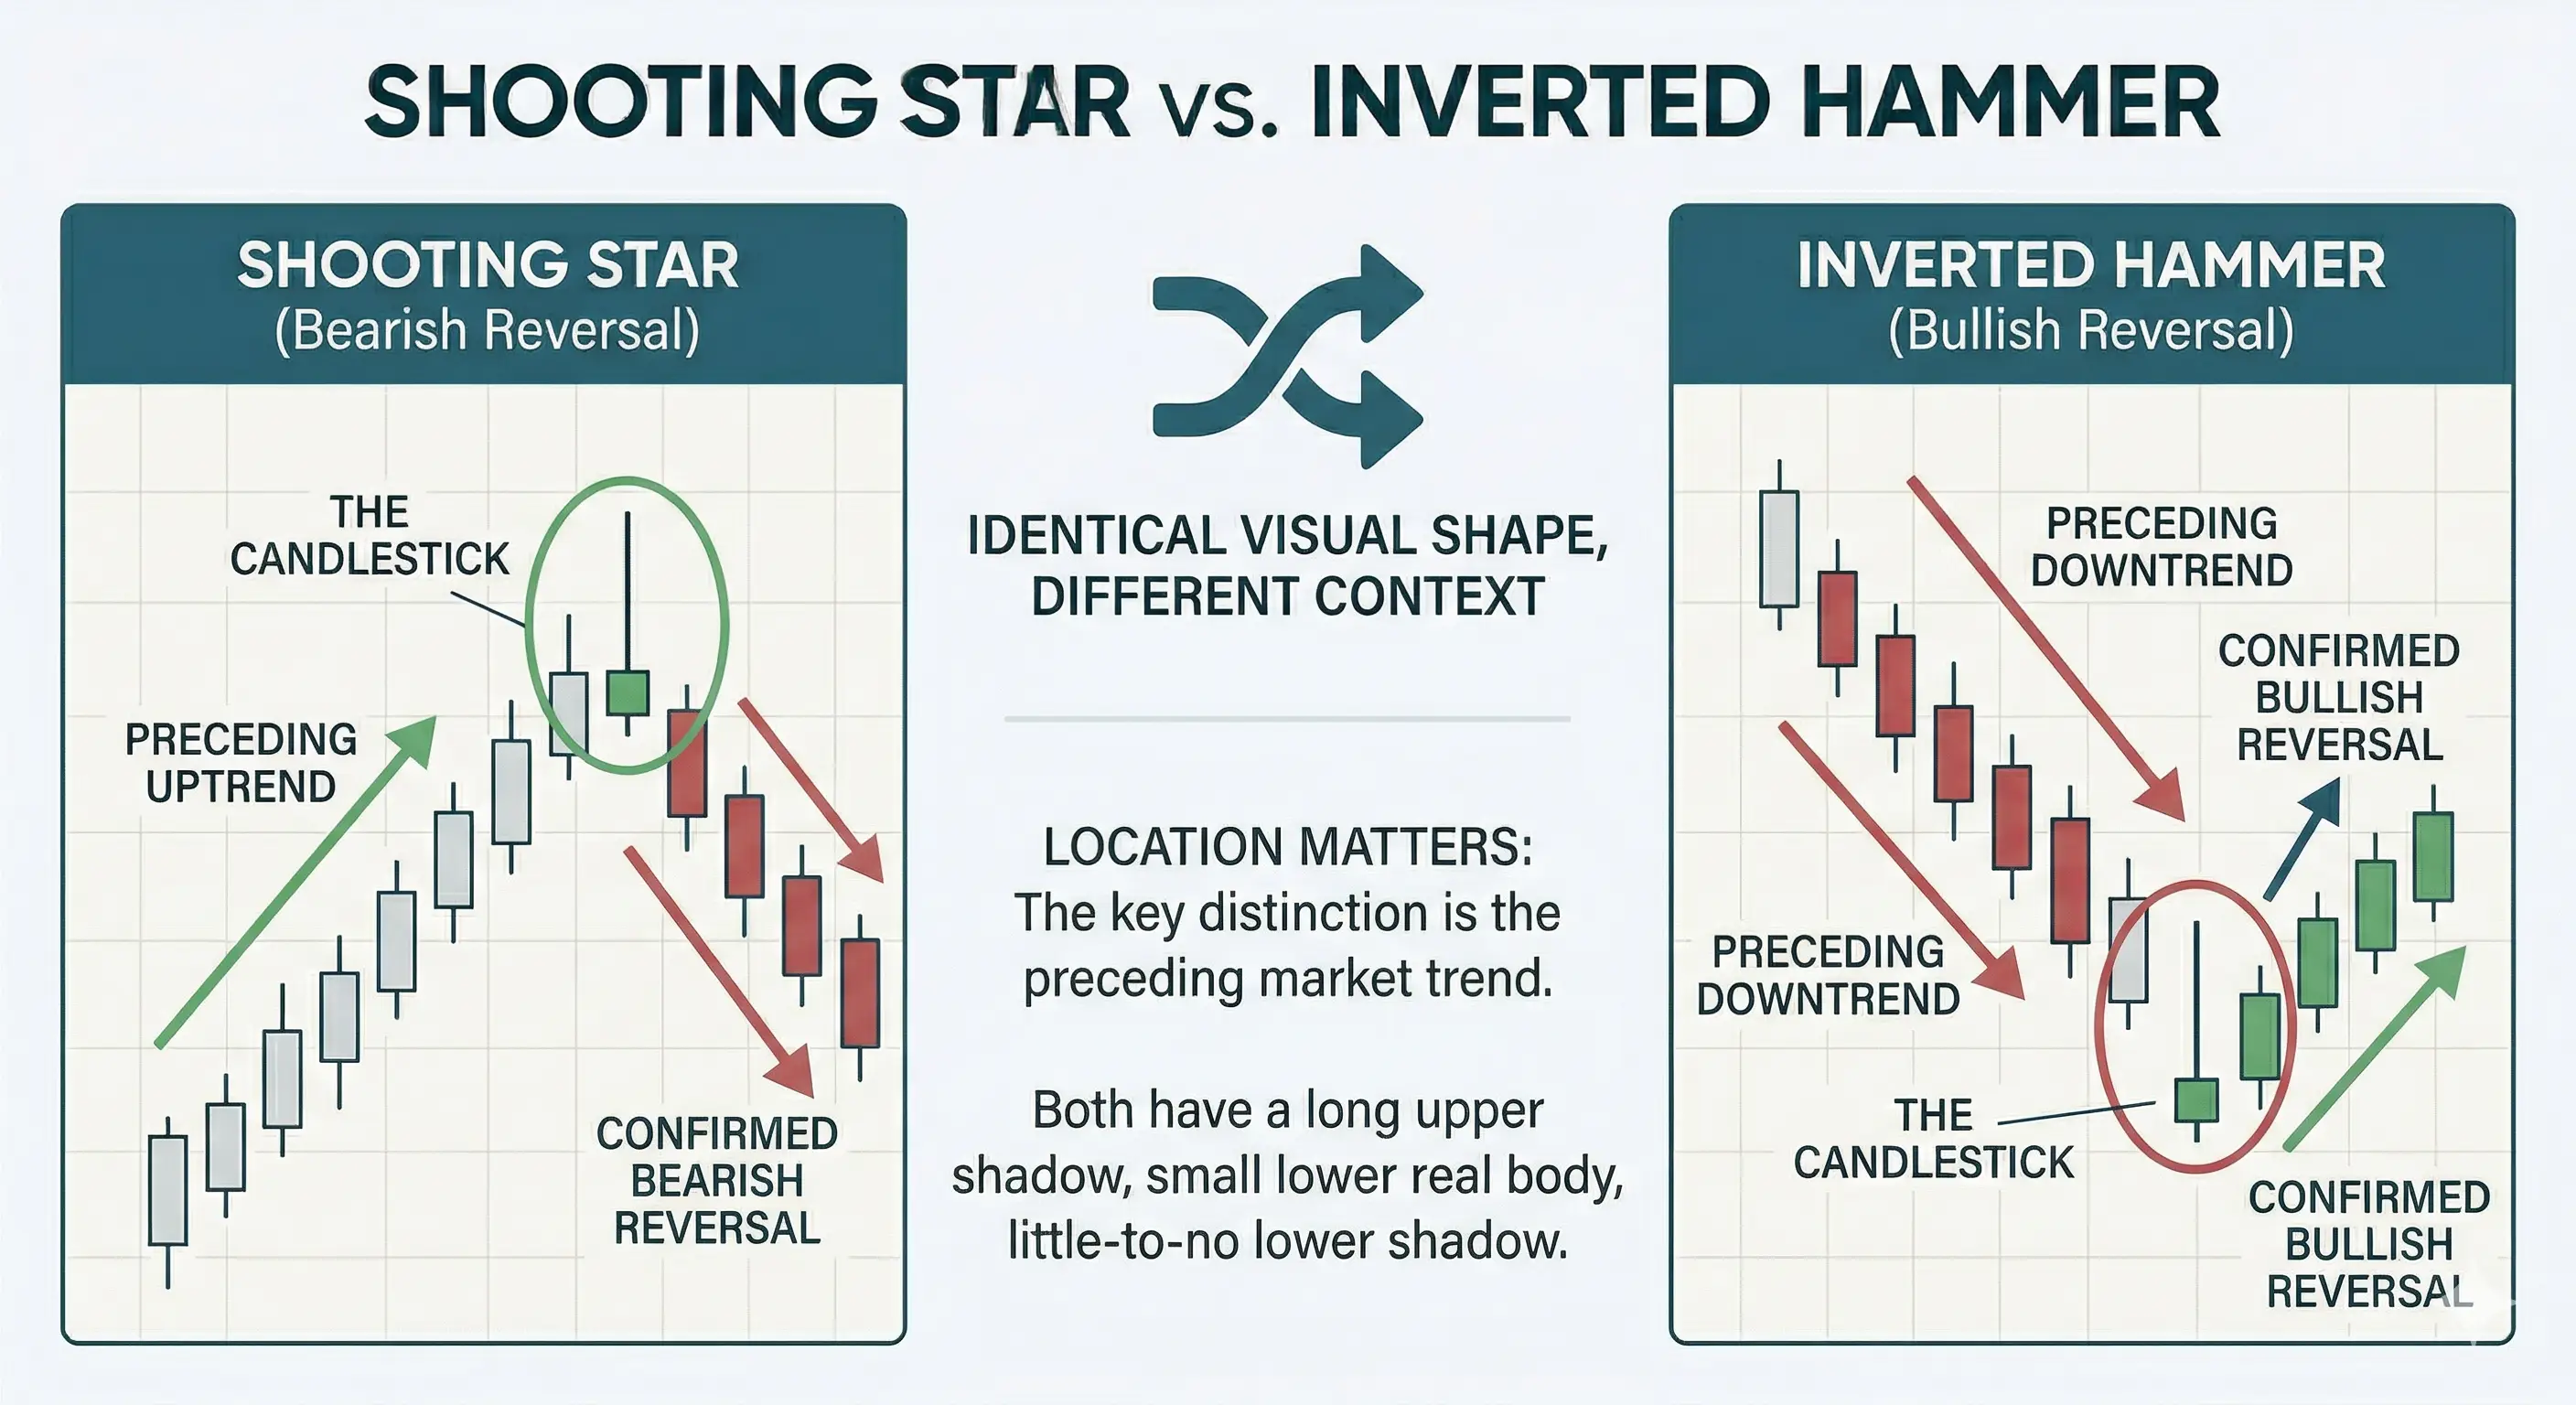
The shooting star and inverted hammer can look almost identical, but they mean different things because they form in different locations. A shooting star appears after an uptrend and warns of a possible bearish reversal, while an inverted hammer appears after a downtrend and warns of a possible bullish reversal.
The shape alone is not enough. Traders must always read the candle in the context of the trend that came before it.
How to Start Trading Shooting Star Candlestick Patterns with a Broker?
Start with education before execution. TMGM Academy already covers candlestick patterns and beginner technical analysis, so you can begin with our Candlestick Patterns Guide and Technical Analysis Guide before testing the setup in a demo workflow.
After that, open a demo account, focus on one market such as Gold or Forex, and test a fixed checklist for entry, stop loss, exit, and invalidation. Move to a live account only when the process is repeatable and the risk per trade is controlled. TMGM’s public platform and account pages also outline demo and live account access for traders using MT5.


