

Dogecoin Price Forecast: DOGE extends losses despite steady institutional support
- Dogecoin edges lower on Tuesday, extending its third consecutive week of losses.
- Institutional demand for DOGE holds steady, with four consecutive weeks of inflows.
- The technical outlook is cautiously bearish, as DOGE risks slipping below the $0.1000 psychological support level.
Dogecoin (DOGE) is facing intense selling pressure, dragging toward its $0.1000 psychological support on Tuesday. DOGE leads the underperforming meme coin sector despite growing institutional inflows over the last four weeks. Dogecoin should remain buoyant above $0.1000 to avoid deeper corrections.

Growing ETF inflows capture the Dogecoin dip
Dogecoin is attracting institutional inflows, while Bitcoin (BTC) and Ethereum (ETH) Exchange-Traded Funds (ETFs) recorded roughly $1.26 billion and $216 million in outflows last week. Typically, an increase in institutional activity drives up investors' confidence and demand.
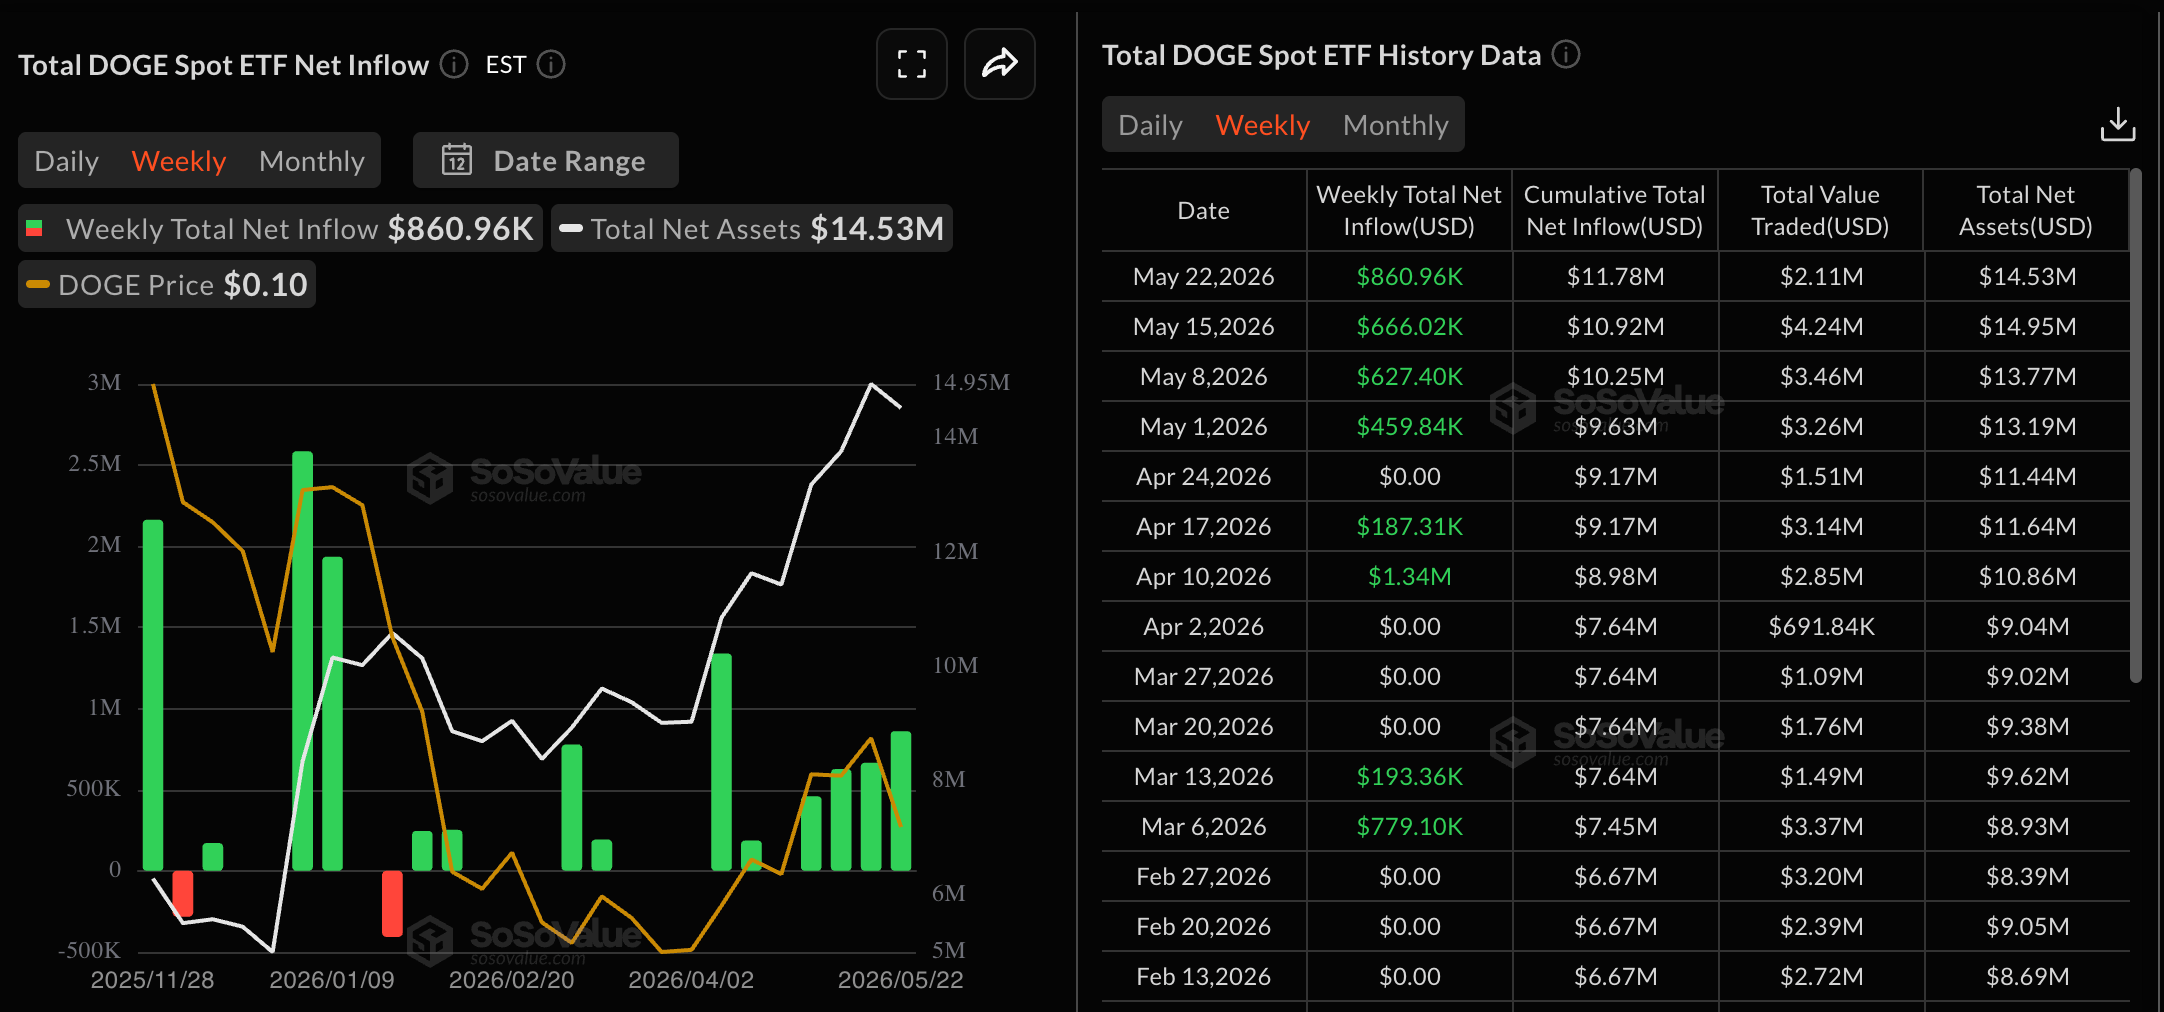
Sosovalue data show DOGE spot ETFs have recorded four straight weeks of positive flows, with $860,960 in inflows last week. The previous weekly inflows reflected a steady rise, reaffirming the institutional support. In the case of Dogecoin, a highly speculative cryptocurrency, such institutional backing implies its growth as a meme coin.
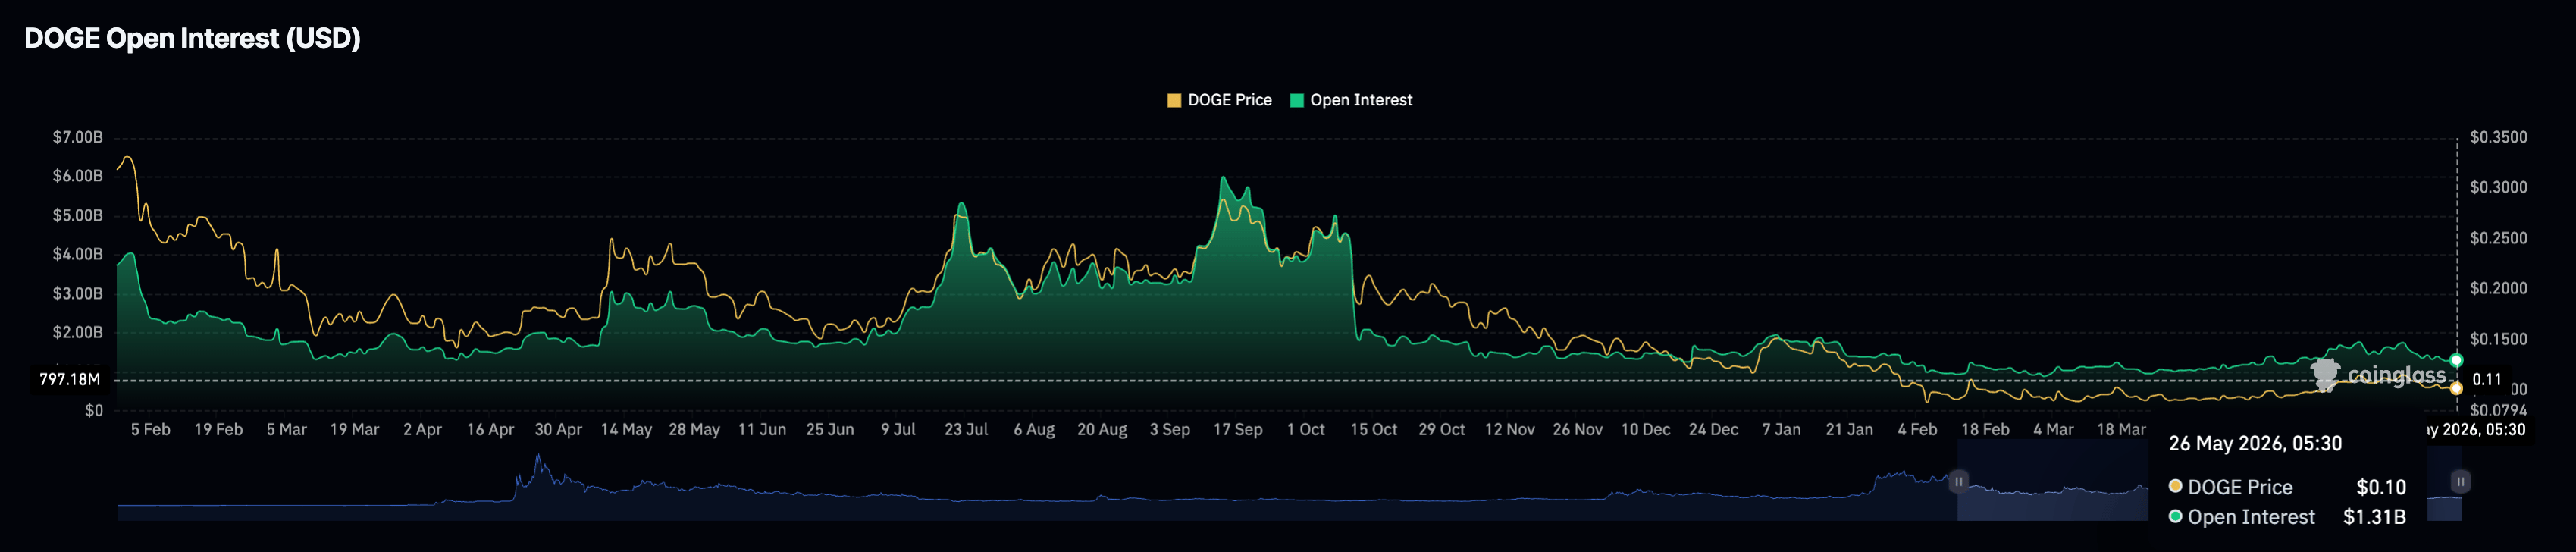
On the derivatives side, the retail activity remains muted. CoinGlass data shows DOGE futures Open Interest (OI) is down to $1.31 billion on Tuesday, from its $1.77 billion peak on May 6, reaffirming a declining trend in leverage-driven activity amid cooling speculation.
Dogecoin threatens a drop below $0.1000
Dogecoin hovers above $0.1000 at press time on Tuesday, keeping a bearish near-term bias. DOGE remains below the 50-, 100-, and 200-day Exponential Moving Average (EMA) at $0.1036, $0.1059, and $0.1205, respectively, reaffirming the bearish bias.
Momentum indicators support the soft tone in Dogecoin, with the Relative Strength Index (RSI) at 41 on the daily chart, declining below the midline and indicating further downside potential before reaching the oversold zone. Meanwhile, the Moving Average Convergence Divergence (MACD) and signal line slip into the negative territory, suggesting lingering downside pressure.
Looking down, the initial support sits at the psychological level of $0.1000. A sustained break beneath this floor would expose the pair to deeper losses, potentially targeting the February 11 low at $0.0879.
On the topside, immediate resistance is seen at the 50-day EMA around $0.1036, followed by the 100-day EMA at $0.1059.
(The technical analysis of this story was written with the help of an AI tool.)














