
Gold Price Forecast: XAU/USD struggles around $4,000, near YTD lows
By Guillermo Alcala
Updated: 30 Jun 2026


POPULAR ARTICLES

Gold (XAU/USD) trades right above the $4,000 psychology¡gicval level at the time of writing, after hitting fresh year-to-date (YTD) lows at $3,941 earlier on the day.
- Gold remains depressed after hitting levels below $ 4,000 for the first time in the last seven months.
- Fed hiking expectations are supporting the US Dollar ahead of US employment data.
- Technical indicators show a bullish divergence with no other sign of a trend shift in sight.
Gold (XAU/USD) trades right above the $4,000 psychology¡gicval level at the time of writing, after hitting fresh year-to-date (YTD) lows at $3,941 earlier on the day. The precious metal has turned positive on the daily chart, but rallies remain subdued as rising hopes of Federal Reserve (Fed) tightening keep buoying the USD ahead of a string of US employment indicators.
Later on Tuesday, the US JOLTS Job Openings report is expected to show solid job creation in May. The highlight of the week, however, is Thursday’s Nonfarm Payrolls report. which is forecast to show a 110K increase in net employment, after 172K in May, confirming that the US economy keeps creating jobs at a healthy pace.
These figures are likely to strengthen the case of a Federal Reserve (Fed) rate hike in the coming months. The CME FedWatch Tool shows a 31% chance of a quarter-point hike in September and more than 60% in October, up from 6% and 20%, respectively, one month ago. The risk is skewed to the downside for precious metals.
Technical Analysis: Momentum Indicators show bullish divergence
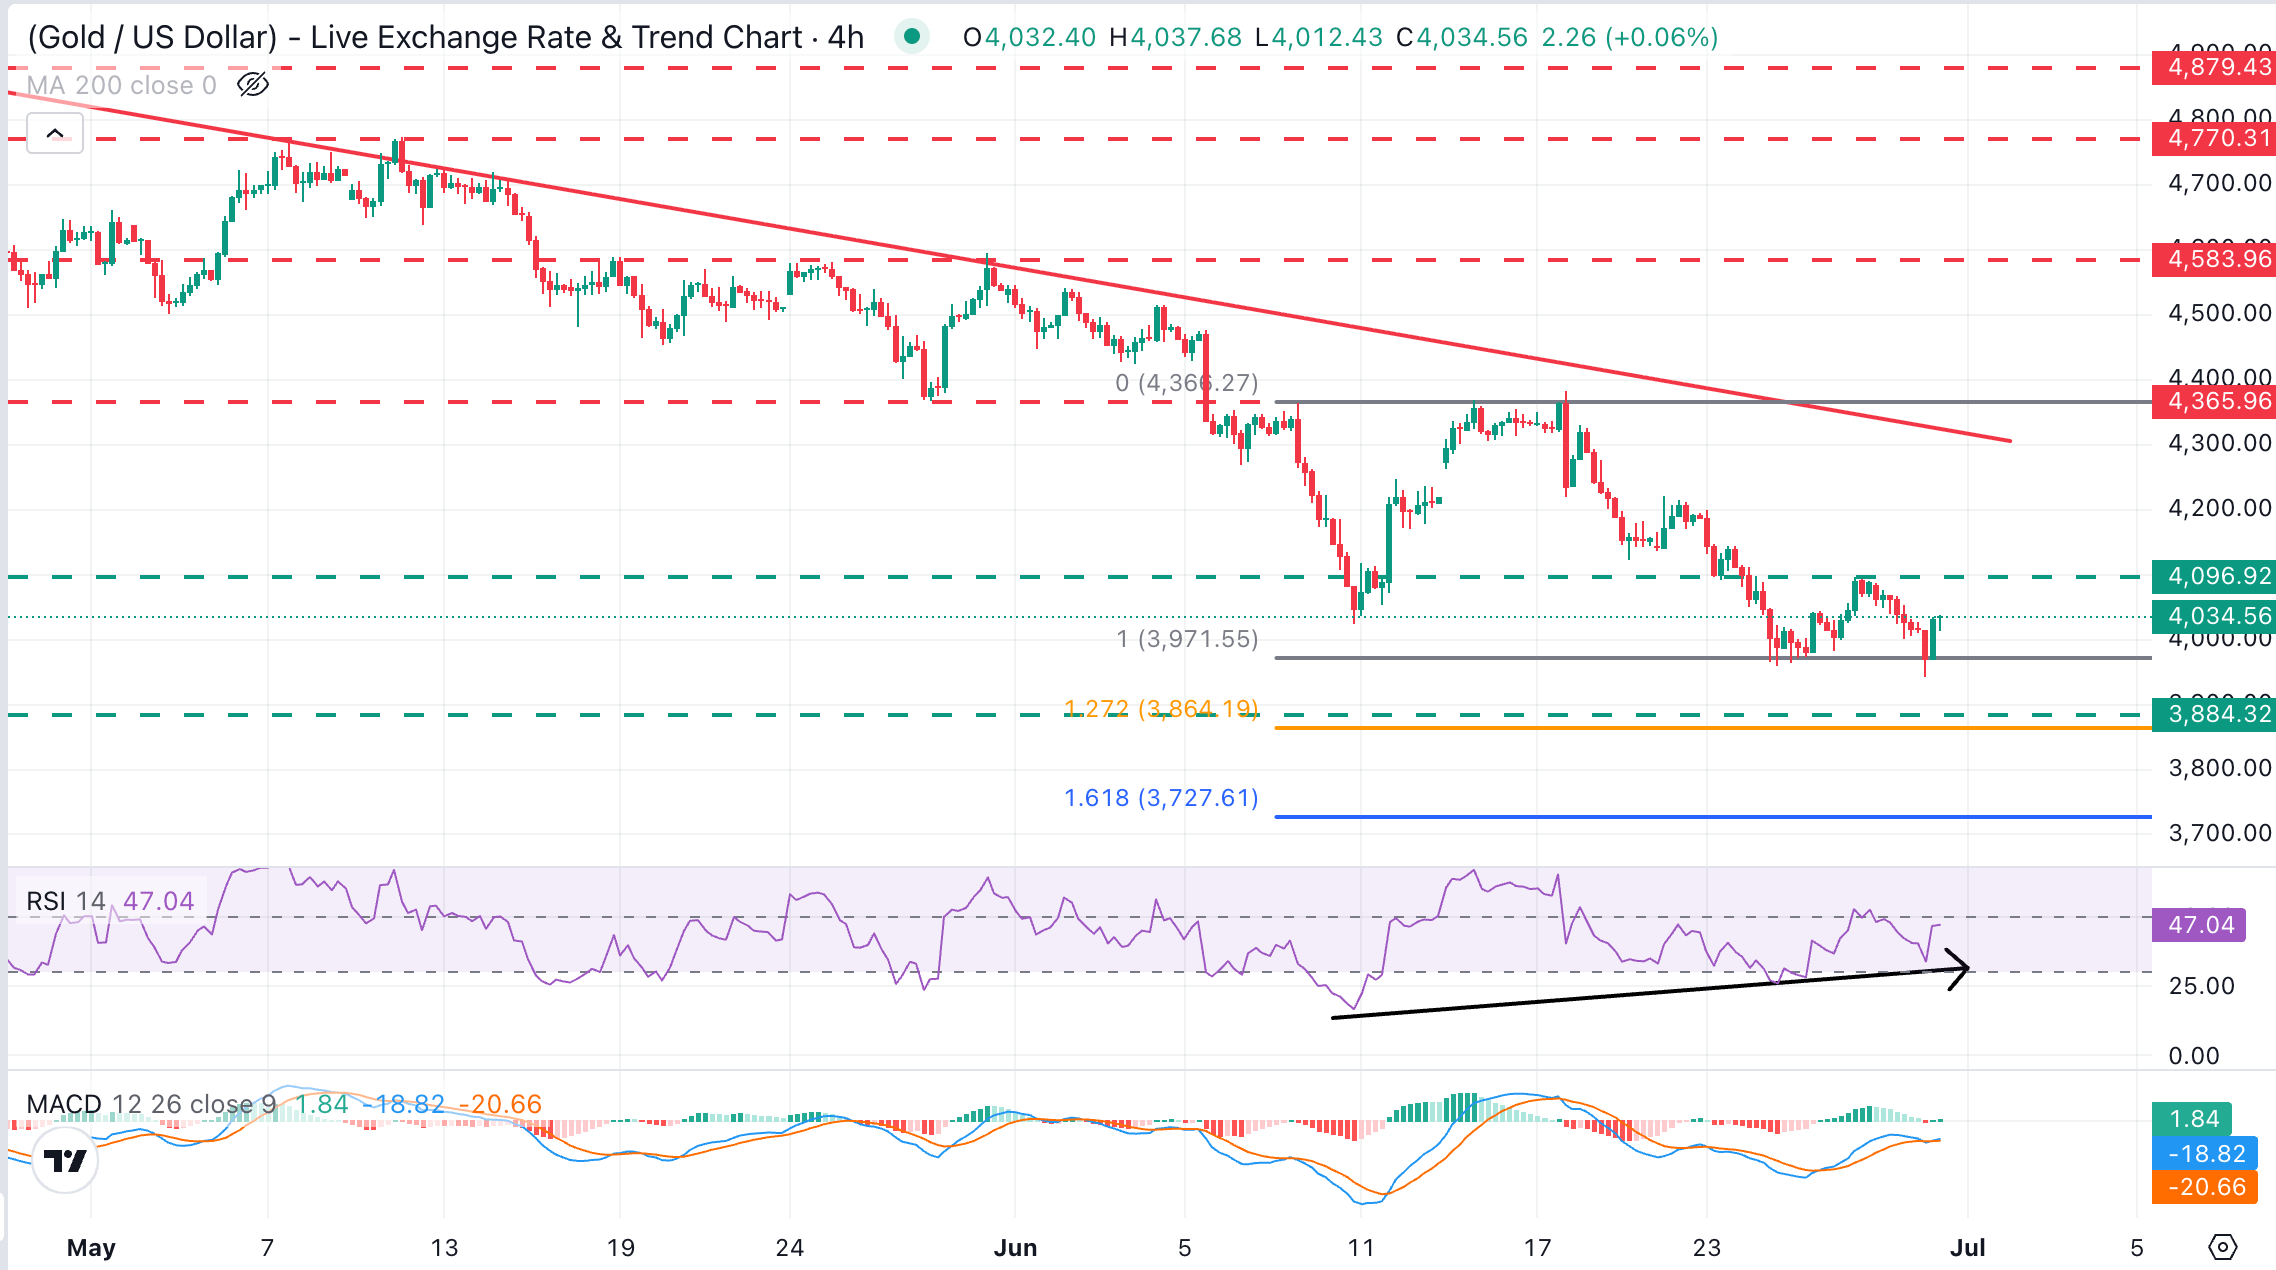
XAU/USD trades at $4,032, keeping a bearish near-term bias and on track to a more than 11% decline in June, with no sign of a bullish reversal except for the bullish divergence in the Relative Strength Index (14). The Moving Average Convergence Divergence (MACD) has turned mildly positive, hinting at fading downside momentum, rather than a trend reversal.
Bulls would need to break Friday's high of $4,096, and the area between the downward resistance trend-line now around $4,315 and the June 15 and 17 highs, at the $4,360-$4,380 area, to confirm a trend shift.
On the downside, immediate support is at the mentioned YTD low at $3,941, and the late October 2025 lows in the $3,900 area. Further down, the next target is the 161.8% Fibonacci extension of the June 18-23 downleg, at $3,727.
(The technical analysis of this story was written with the help of an AI tool.)
Gold FAQs
Gold has played a key role in human’s history as it has been widely used as a store of value and medium of exchange. Currently, apart from its shine and usage for jewelry, the precious metal is widely seen as a safe-haven asset, meaning that it is considered a good investment during turbulent times. Gold is also widely seen as a hedge against inflation and against depreciating currencies as it doesn’t rely on any specific issuer or government.
Central banks are the biggest Gold holders. In their aim to support their currencies in turbulent times, central banks tend to diversify their reserves and buy Gold to improve the perceived strength of the economy and the currency. High Gold reserves can be a source of trust for a country’s solvency. Central banks added 1,136 tonnes of Gold worth around $70 billion to their reserves in 2022, according to data from the World Gold Council. This is the highest yearly purchase since records began. Central banks from emerging economies such as China, India and Turkey are quickly increasing their Gold reserves.
Gold has an inverse correlation with the US Dollar and US Treasuries, which are both major reserve and safe-haven assets. When the Dollar depreciates, Gold tends to rise, enabling investors and central banks to diversify their assets in turbulent times. Gold is also inversely correlated with risk assets. A rally in the stock market tends to weaken Gold price, while sell-offs in riskier markets tend to favor the precious metal.
The price can move due to a wide range of factors. Geopolitical instability or fears of a deep recession can quickly make Gold price escalate due to its safe-haven status. As a yield-less asset, Gold tends to rise with lower interest rates, while higher cost of money usually weighs down on the yellow metal. Still, most moves depend on how the US Dollar (USD) behaves as the asset is priced in dollars (XAU/USD). A strong Dollar tends to keep the price of Gold controlled, whereas a weaker Dollar is likely to push Gold prices up.

More than a million users rely on FXStreet for real-time market data, charting tools, expert insights, and forex news. Its comprehensive economic calendar and educational webinars help traders stay informed and make calculated decisions. FXStreet is supported by a team of about 60 professionals, split between the Barcelona headquarters and various global regions.
Read More


