

Stellar Price Forecast: XLM relief bounce fades as bearish undertone persists
- Stellar price steadies at $0.16 on Thursday after recovering over 8% in the previous day.
- Derivatives data supports a bearish sentiment, with short bets rising to the highest level over a month alongside falling open interest.
- Despite the recent bounce, the broader technical structure remains under pressure, keeping the overall outlook tilted to the downside.
Stellar (XLM) is trading around $0.16 at the time of writing on Thursday after rebounding more than 8% in the previous day. Derivatives data paints a negative picture as XLM’s short bets hit a monthly high while Open Interest (OI) continues to decline. On the technical side, the primary trend remains bearish, capping the upside move.

XLM’s derivatives data shows bearish bias
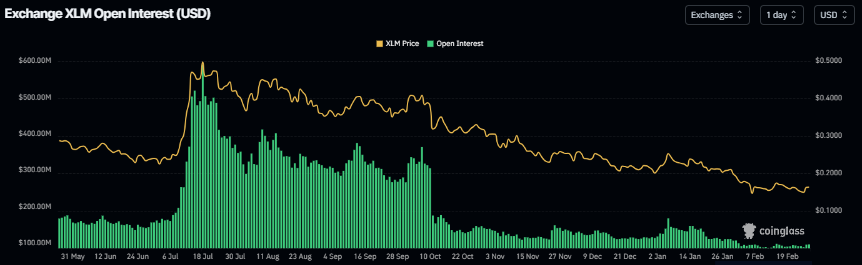
Stellar’s futures OI falls to $96.76 million on Thursday, having been steadily declining since early January. This drop in OI reflects waning investor participation and projects a bearish outlook.
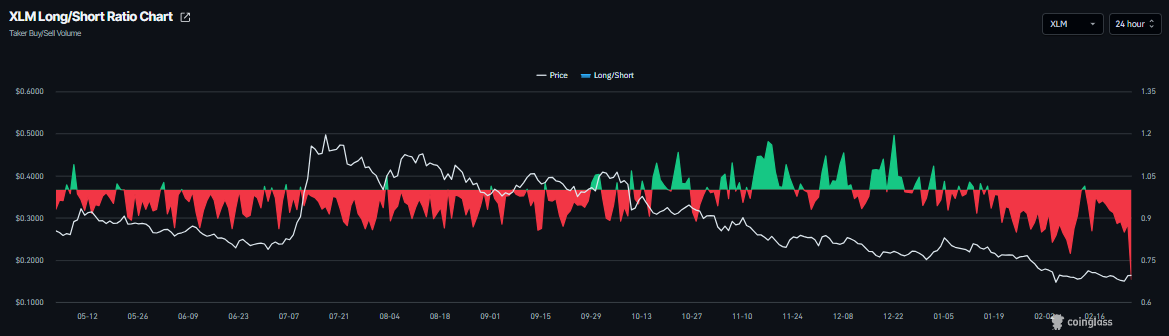
In addition, XLM's long-to-short ratio reads 0.68 on Thursday, the lowest level over a month. This ratio below 1 indicates bearish sentiment as traders are betting on the Stellar price to fall.
Stellar Price Forecast: XLM's broader structure remains bearish
Stellar price is trading at $0.16 as of writing on Thursday. XLM continues to move below the declining 50-day and 100-day Exponential Moving Averages (EMAs) clustered around $0.18–$0.21, keeping the broader structure under a bearish shadow despite the recent bounce from the $0.15 region.
A long-standing descending resistance trend line, broken lower near $0.18, still caps the upside bias while price holds beneath that area.
Momentum on the daily chart shows tentative improvement, with the Relative Strength Index (RSI) recovering toward the mid-40s from oversold territory and the Moving Average Convergence Divergence (MACD) line holding marginally above its signal line and near the zero line, suggesting fading downside pressure but not yet a decisive bullish shift.
Overall, the near-term tone remains cautiously neutral with a recovery bias as long as the $0.15 floor holds. Initial resistance emerges at $0.17, where recent intraday highs congregate, with a stronger barrier at $0.18 near the prior trendline break and just under the 50-day EMA.
A daily close above $0.18 would open the way toward $0.19, where the 100-day EMA begins to weigh in, and then toward $0.21 as a more distant cap within the broader downtrend.
On the downside, immediate support stands at $0.16, followed by $0.15 as a key level that underpins the emerging base. A break below $0.15 would negate the nascent recovery stance and expose the next bearish leg lower toward the $0.14 area.
(The technical analysis of this story was written with the help of an AI tool.)














