

Crypto Market Overview: Bitcoin slips below $63,000 – Zcash and Polygon extend gains
- Bitcoin extends losses below $63,000 on Wednesday, risking a bearish reversal.
- Renewed US-Iran tensions weigh down on broader crypto market sentiment.
- Zcash and Polygon extend gains, emerging as top performers over the last 24 hours.
Bitcoin (BTC) trades below $63,000 at press time on Wednesday, risking a steeper correction amid resurfacing tensions between the US and Iran. Zcash (ZEC) and Polygon (POL) have maintained a steady recovery over the last 24 hours, hinting at an extended breakout rally.
Bitcoin under pressure with US retaliatory strikes against Iran

US military executed strikes against Iran on Wednesday in retaliation for three ships shot down by Tehran in the Strait of Hormuz. This renewed tension threatens to violate the Islamabad Accord and weighs on global markets. Brent crude oil price reached $75 on Wednesday, following a 5% jump the previous day, while Bitcoin was losing ground.
Bitcoin trades below $63,000 at press time on Wednesday, reflecting capped recovery below its 50-day Exponential Moving Average (EMA) at $65,581. The 200-day EMA at $75,459 sits well above the 50-day EMA, retaining a broader bearish bias.
From a technical perspective, a reversal in BTC threatens to retest the $60,000 psychological threshold, which could nullify the previous double-bottom reversal thesis.
That said, the momentum signals remain mixed on the daily chart, with the Relative Strength Index (RSI) at 48 moves flat near the midline while the Moving Average Convergence Divergence (MACD) holds above the signal line as the histograms contract, hinting at only residual buying interest.
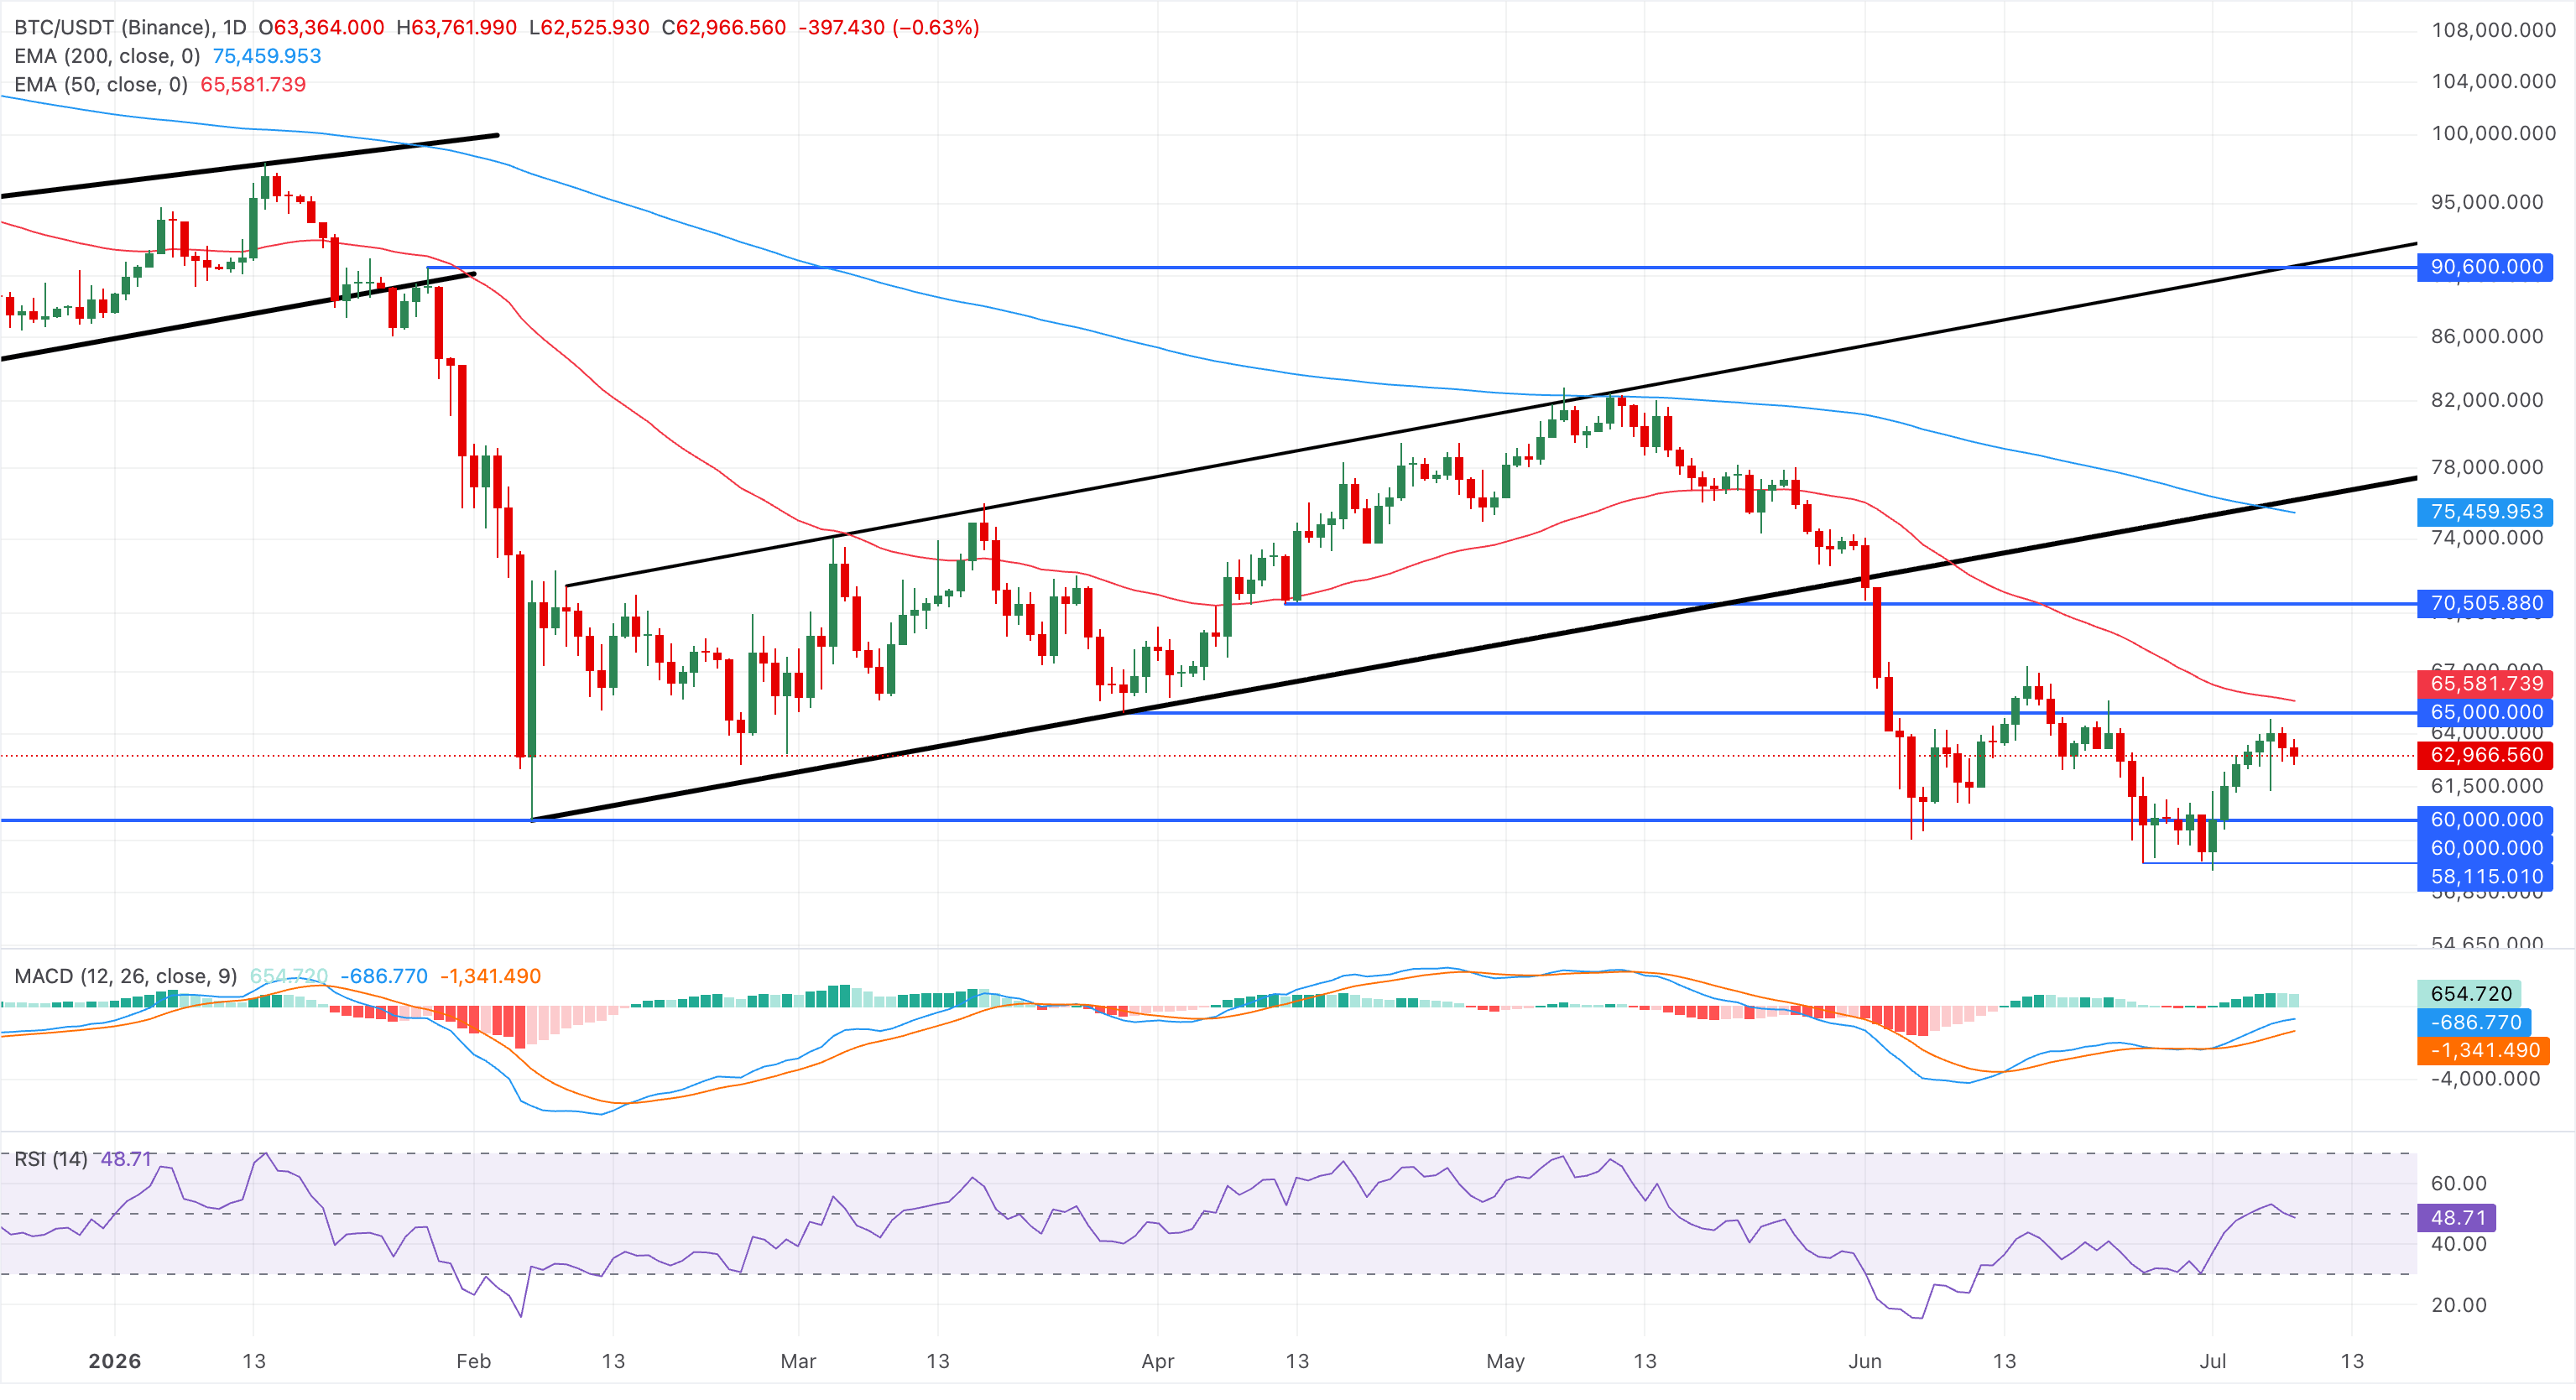
Bitcoin should clear the 50-day EMA at $65,581 to reinstate a steady bullish recovery that could target the $70,000 threshold, followed by the 200-day EMA at $75,459, which reinforces a broader cap on recovery attempts.
Zcash and Polygon flash early signs of recovery
Zcash holds above its 50-day EMA at $455 after gaining roughly 7% the previous day. The privacy coin shows a constructive bullish bias in the near term as Tuesday's rebound marks the breakout of a local resistance trendline.
From a technical perspective, the 78.6% Fibonacci retracement, measured over the upswing from $184 to $690, at $520 serves as immediate resistance, capping the upside to the Fibonacci anchor at $690.
Momentum on the daily chart suggests the medium-term uptrend remains supported, with the MACD rising above the zero line and the RSI at 55 showing a steady recovery above the midline, indicating bullish-but-not-overbought momentum.
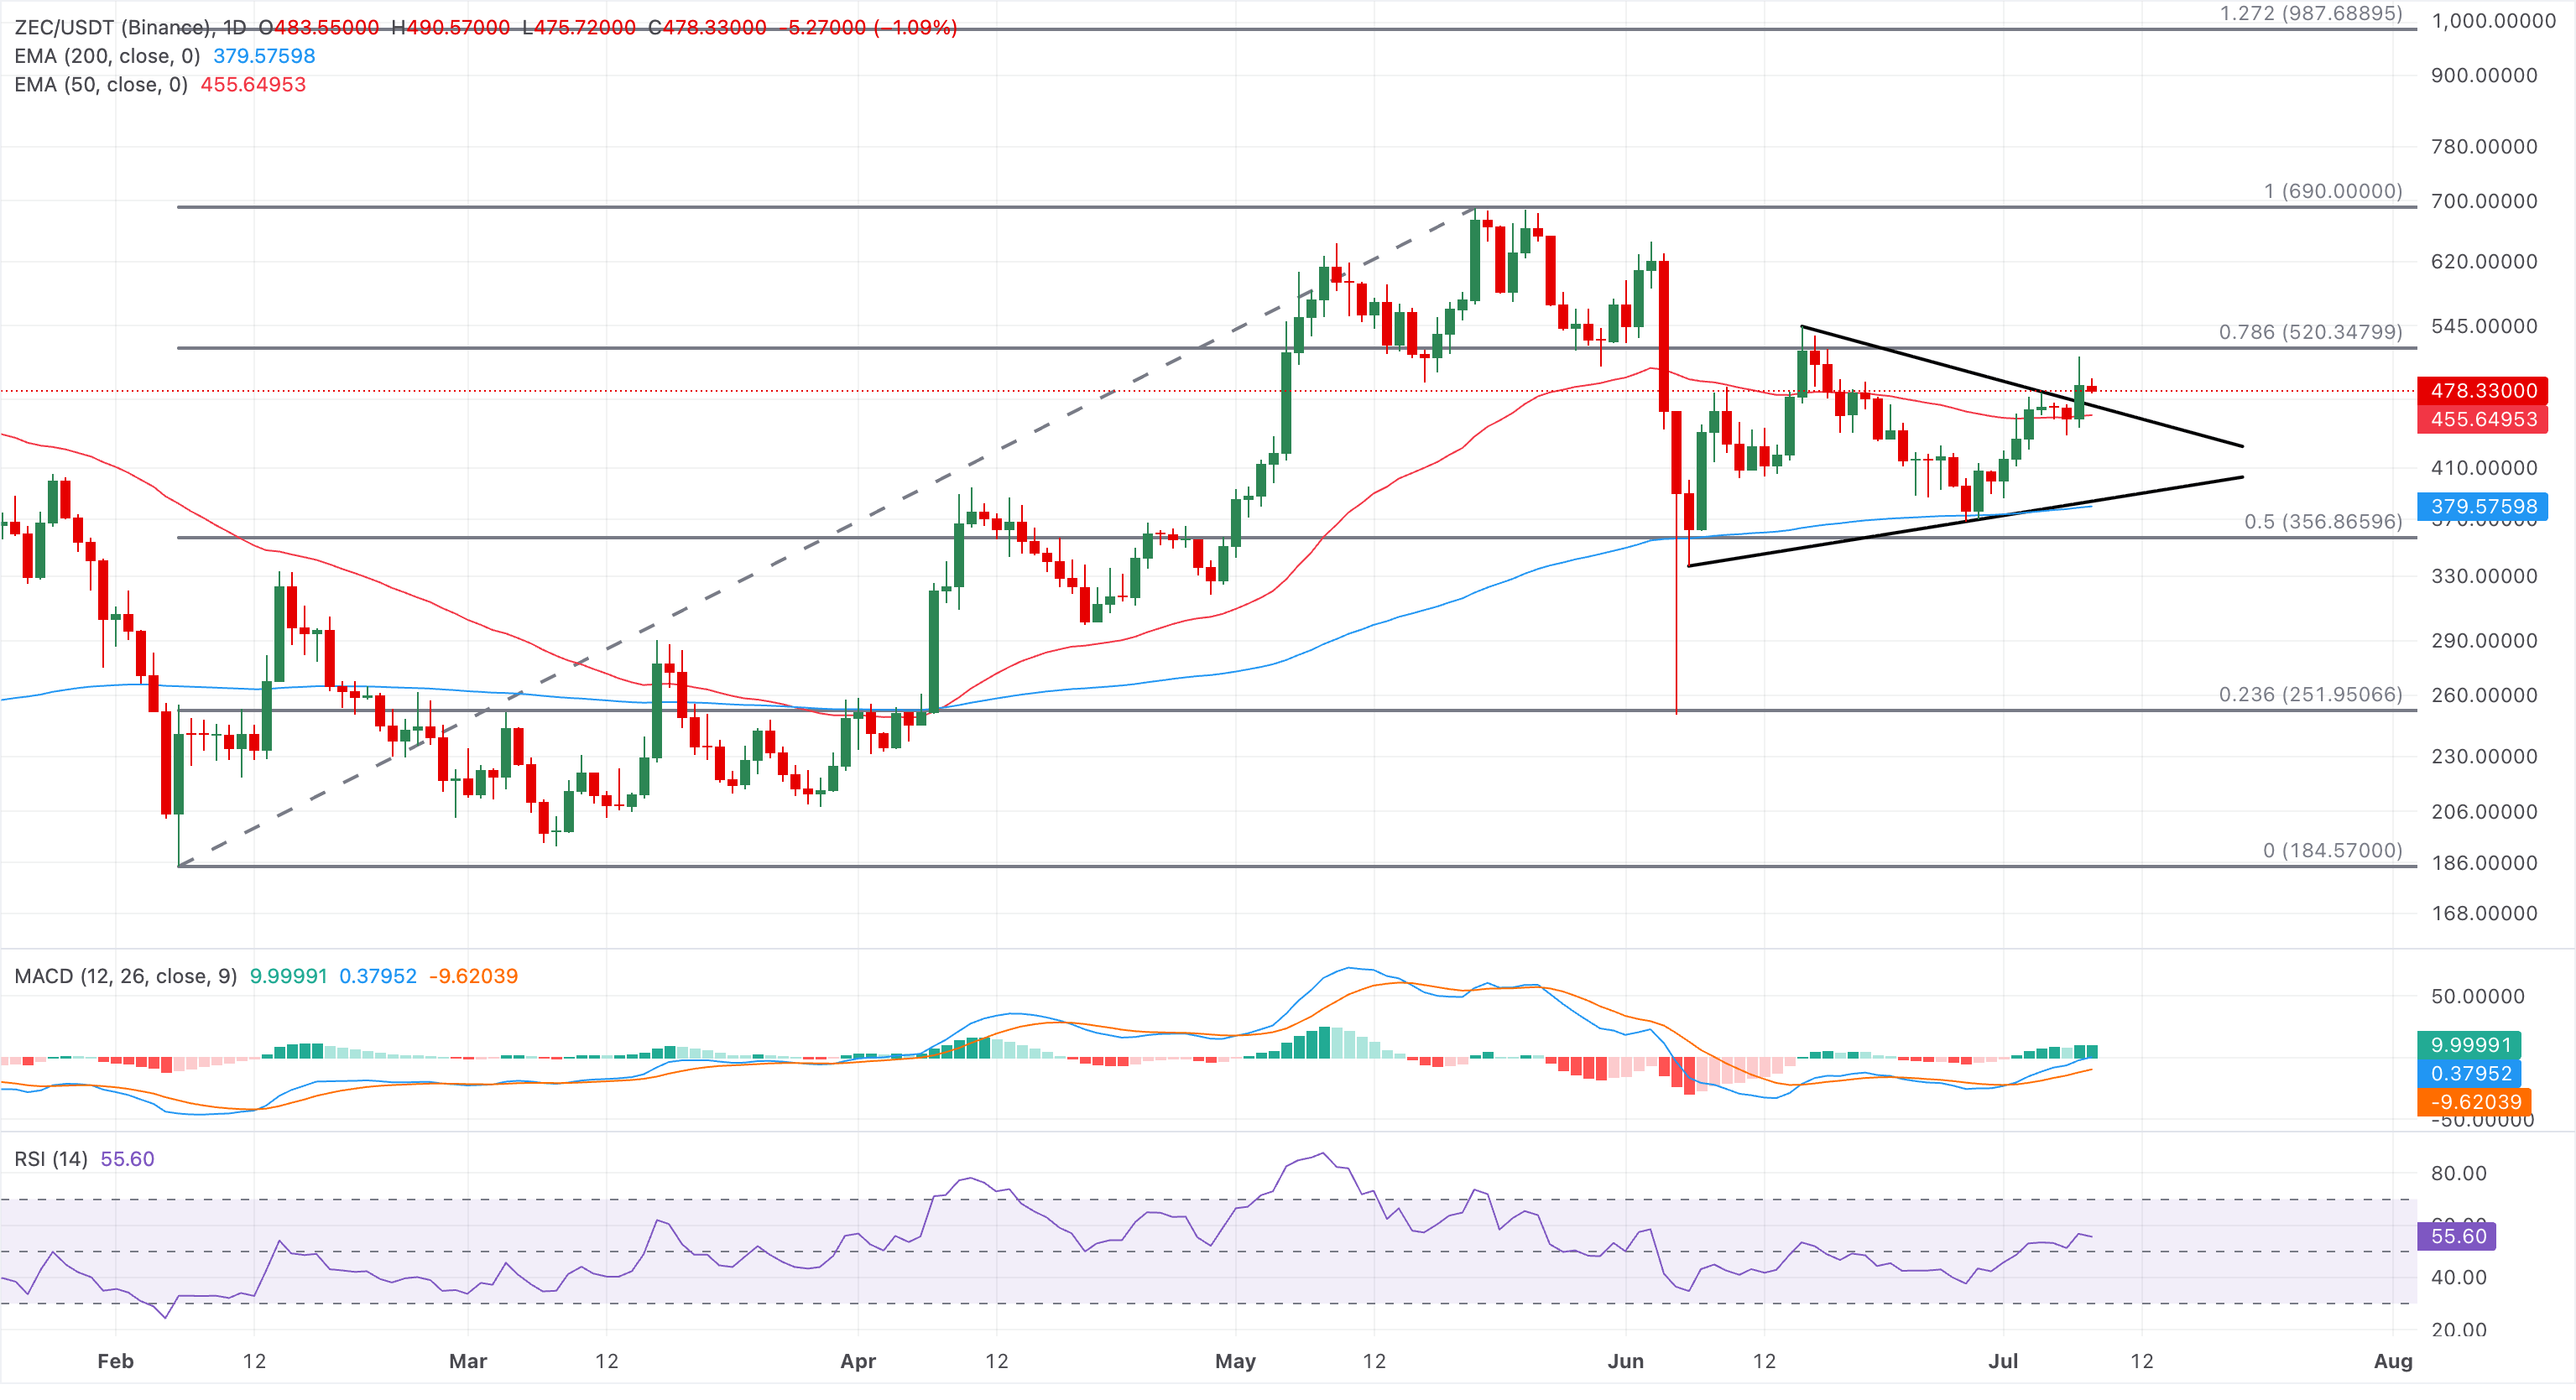
On the flip side, the 200-day EMA at $379, near a local support trendline, guards the downside toward the 50% retracement at $356.
POL edges lower on Wednesday after a steady recovery trend over the last week as it approaches a key resistance zone. The overhead barriers include the 50-day EMA at $0.07949, close to a descending trendline, maintaining a capped near-term tone. A decisive close above the moving average could confirm a bullish trend reversal in POL, with potential targets including the June 3 high at $0.09587.
The RSI near 52 shows a significant ease in selling pressure, while the MACD and signal line rise toward zero, hinting at improving but still-constrained upside momentum beneath these overhead levels.
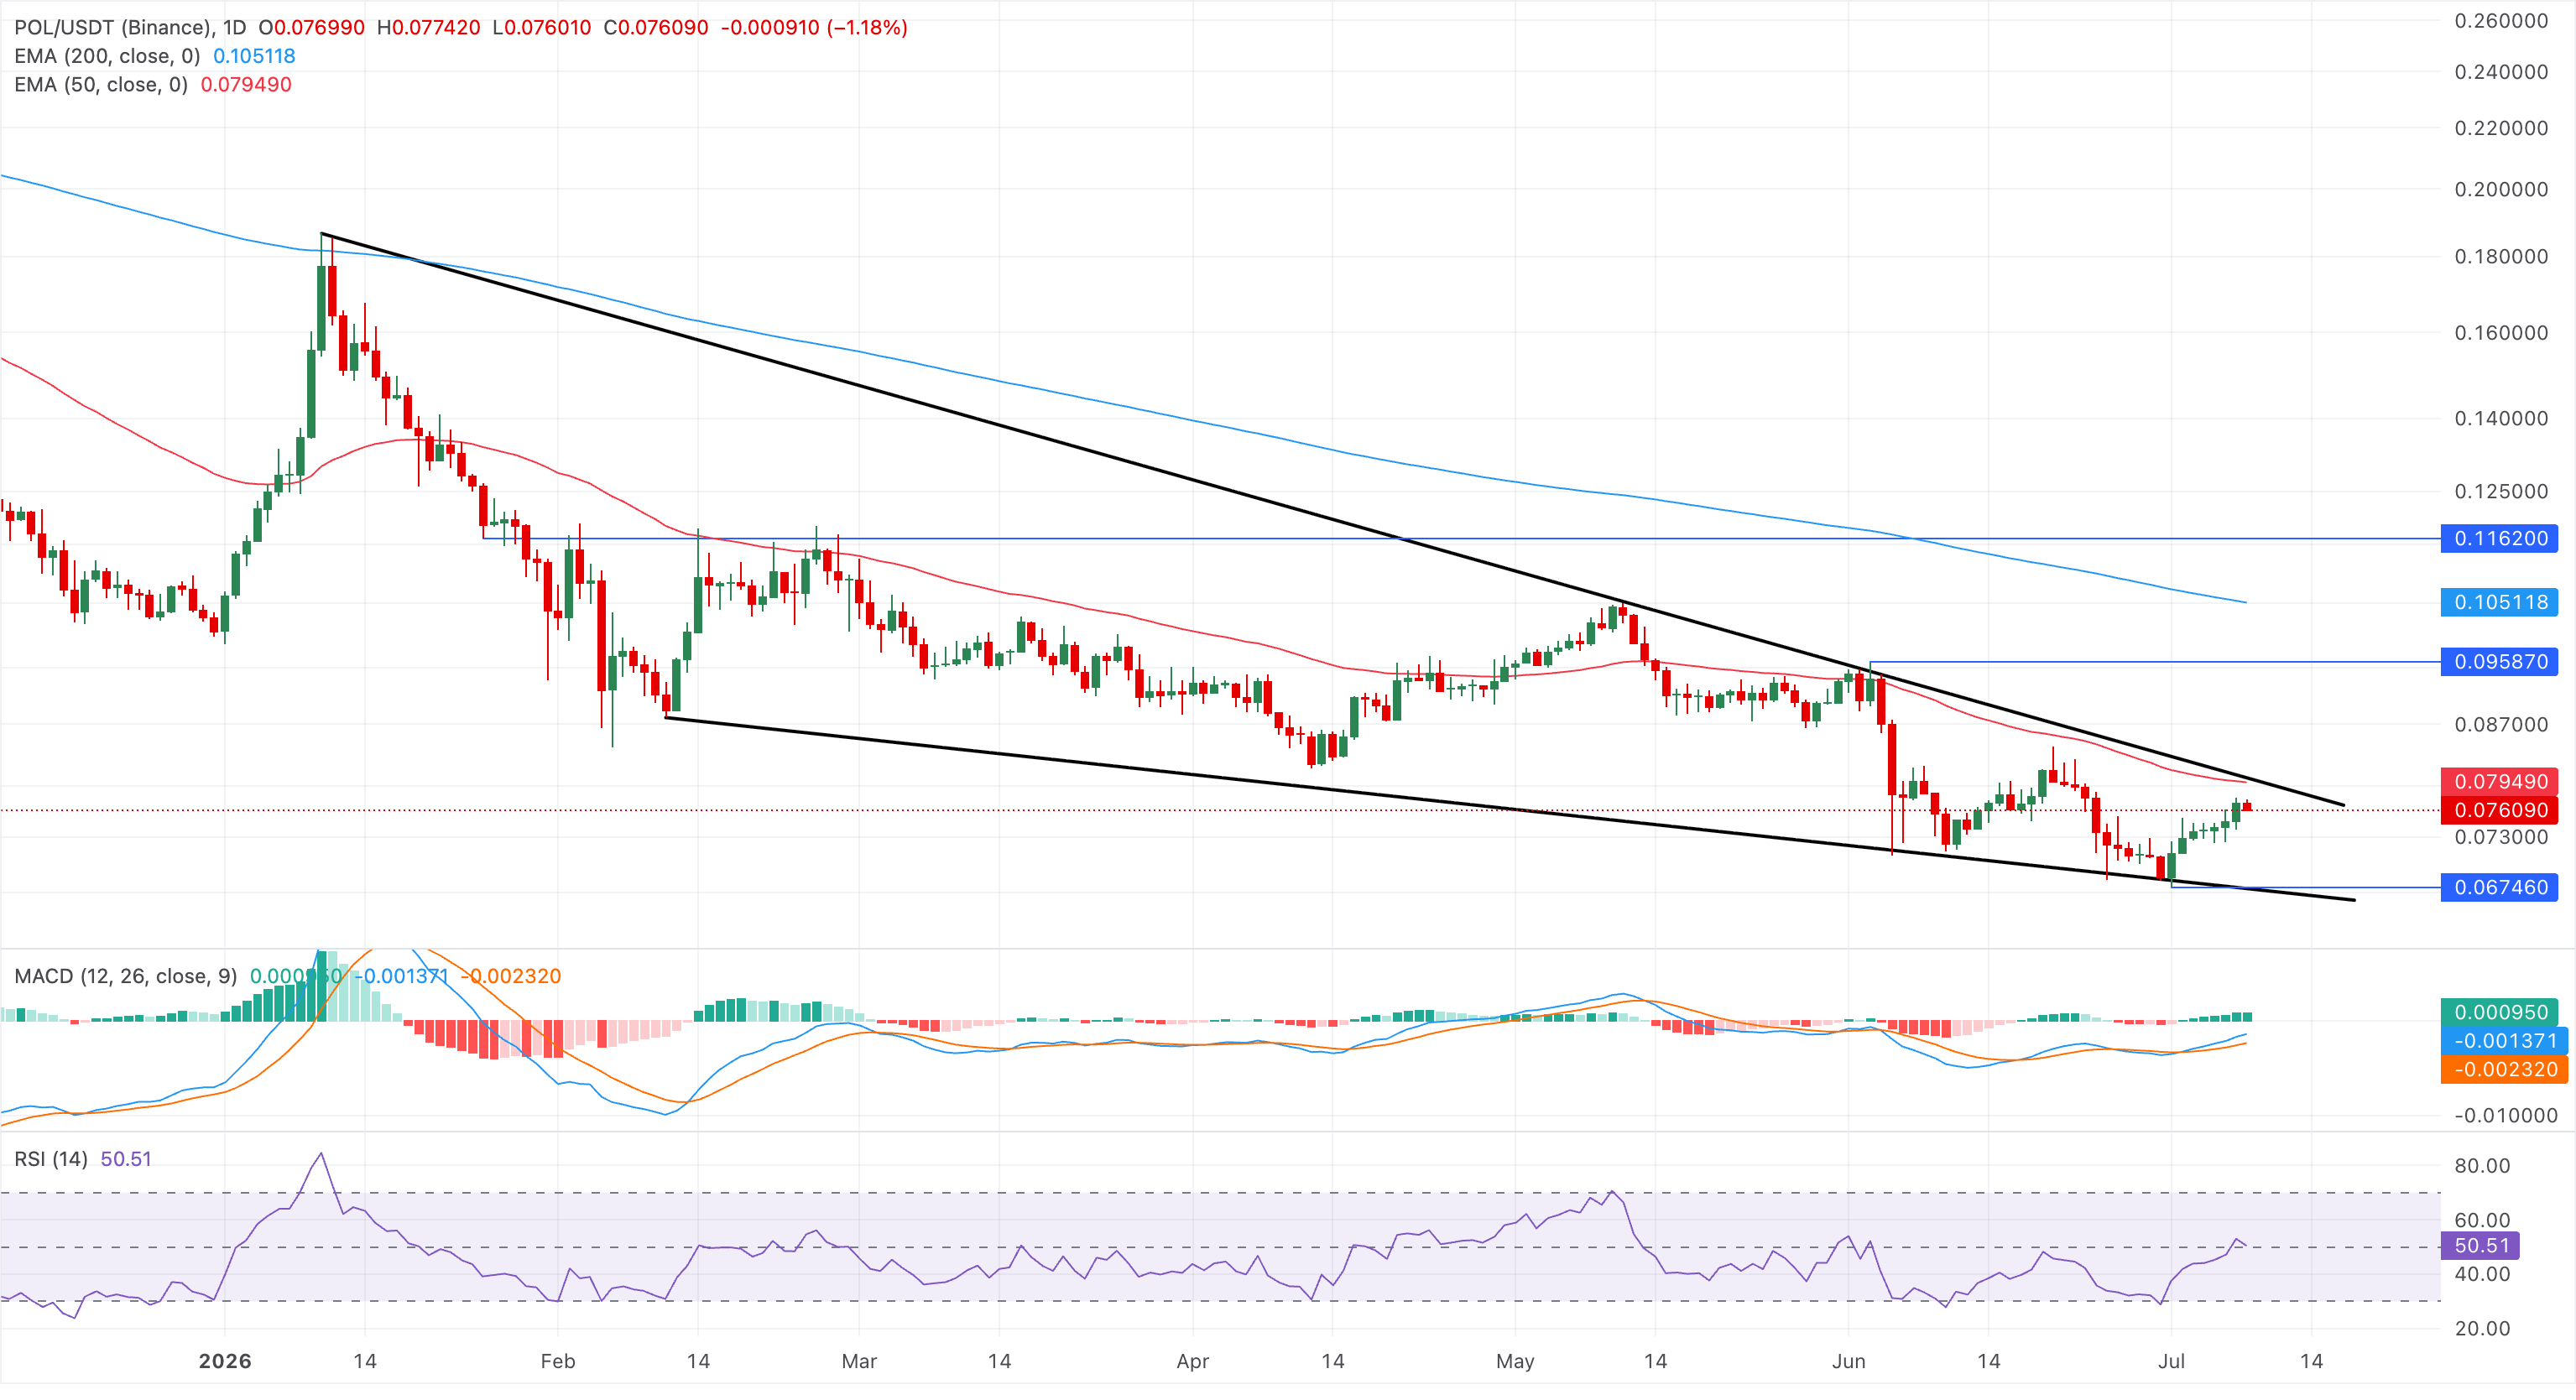
On the downside, the previous swing low from July 1 at $0.06746 serves as the last line of defense.
(The technical analysis of this story was written with the help of an AI tool. Know more.)














