

Crypto Overview: AI tokens rally outpaces the broader crypto market
- Bitcoin, Ethereum, XRP, and other major altcoins extend consolidation on Tuesday.
- WTI drops to $90 on Tuesday while the US-Iran peace deal hangs in balance over enriched uranium handover.
- NEAR Protocol and Injective drive the AI crypto tokens rally, emerging as top performers over the last 24 hours.
Bitcoin (BTC) trades above $76,000 at press time on Tuesday as Ethereum (ETH), Ripple (XRP), and Solana (SOL) consolidate above $2,000, $1.30, and $80, respectively. The US oil prices slip to $90 amid growing hopes of a peace deal with Iran, which depends on the handover of enriched uranium. Meanwhile, the AI token, NEAR Protocol (NEAR), and Injective (INJ) have posted double-digit gains over the last 24 hours.

Crypto market holds as Middle East pressure wanes
Major altcoins mirror Bitcoin’s consolidation above $76,000, with muted price action so far this week amid cooling US-Iran tensions. US President Donald Trump remains focused on including Iran’s enriched uranium in the peace deal and said the talks are ‘proceeding nicely.’
The drop in West Texas Intermediate (WTI) – which tracks the US oil prices – dropped to $90 for the first time since May 7 on the hopes of a peace deal. Typically, a drop in oil prices correlates with a reduction in inflation risk, which could boost risk appetite for cryptocurrency.
AI tokens rally outpaces the broader market
NEAR Protocol edges lower at press time on Tuesday, after a 15% jump the previous day. Still, NEAR maintains a strong bullish phase, surpassing the 50-, 100-, and 200-day Exponential Moving Averages (EMAs).
The Relative Strength Index (RSI) at 82 flags overbought conditions, but the Moving Average Convergence Divergence (MACD) remains firmly positive, suggesting that upside momentum is strong but increasingly stretched.
The path of least resistance targets the November 18 peak at $3.1850 as the next key level of resistance.
Looking down, the immediate support is seen at the 78.6% Fibonacci retracement at $2.6834, measured from the $3.1850 to $0.8410 downswing. Deeper pullbacks in NEAR could potentially target the 61.8% level at $2.2896 and the 50% retracement near $2.0130.
Injective hovers above $5.50 at the time of writing on Tuesday, after gaining 10% the previous day. The AI token maintains a bullish near-term bias as price holds above the major EMAs, with the 200-day EMA at $5.08 now acting as the primary dynamic floor, while the 50-day and 100-day EMAs perform a bullish crossover.
Momentum conditions are constructive, with the MACD indicator remaining in positive territory, above its signal line, while the RSI at 66 hovers just below overbought territory, hinting at firm but stretched buying pressure.
Looking up, the $6.02 level, marked by the November 4 low, serves as immediate resistance, followed by the $8.21 level, which capped an early November recovery.
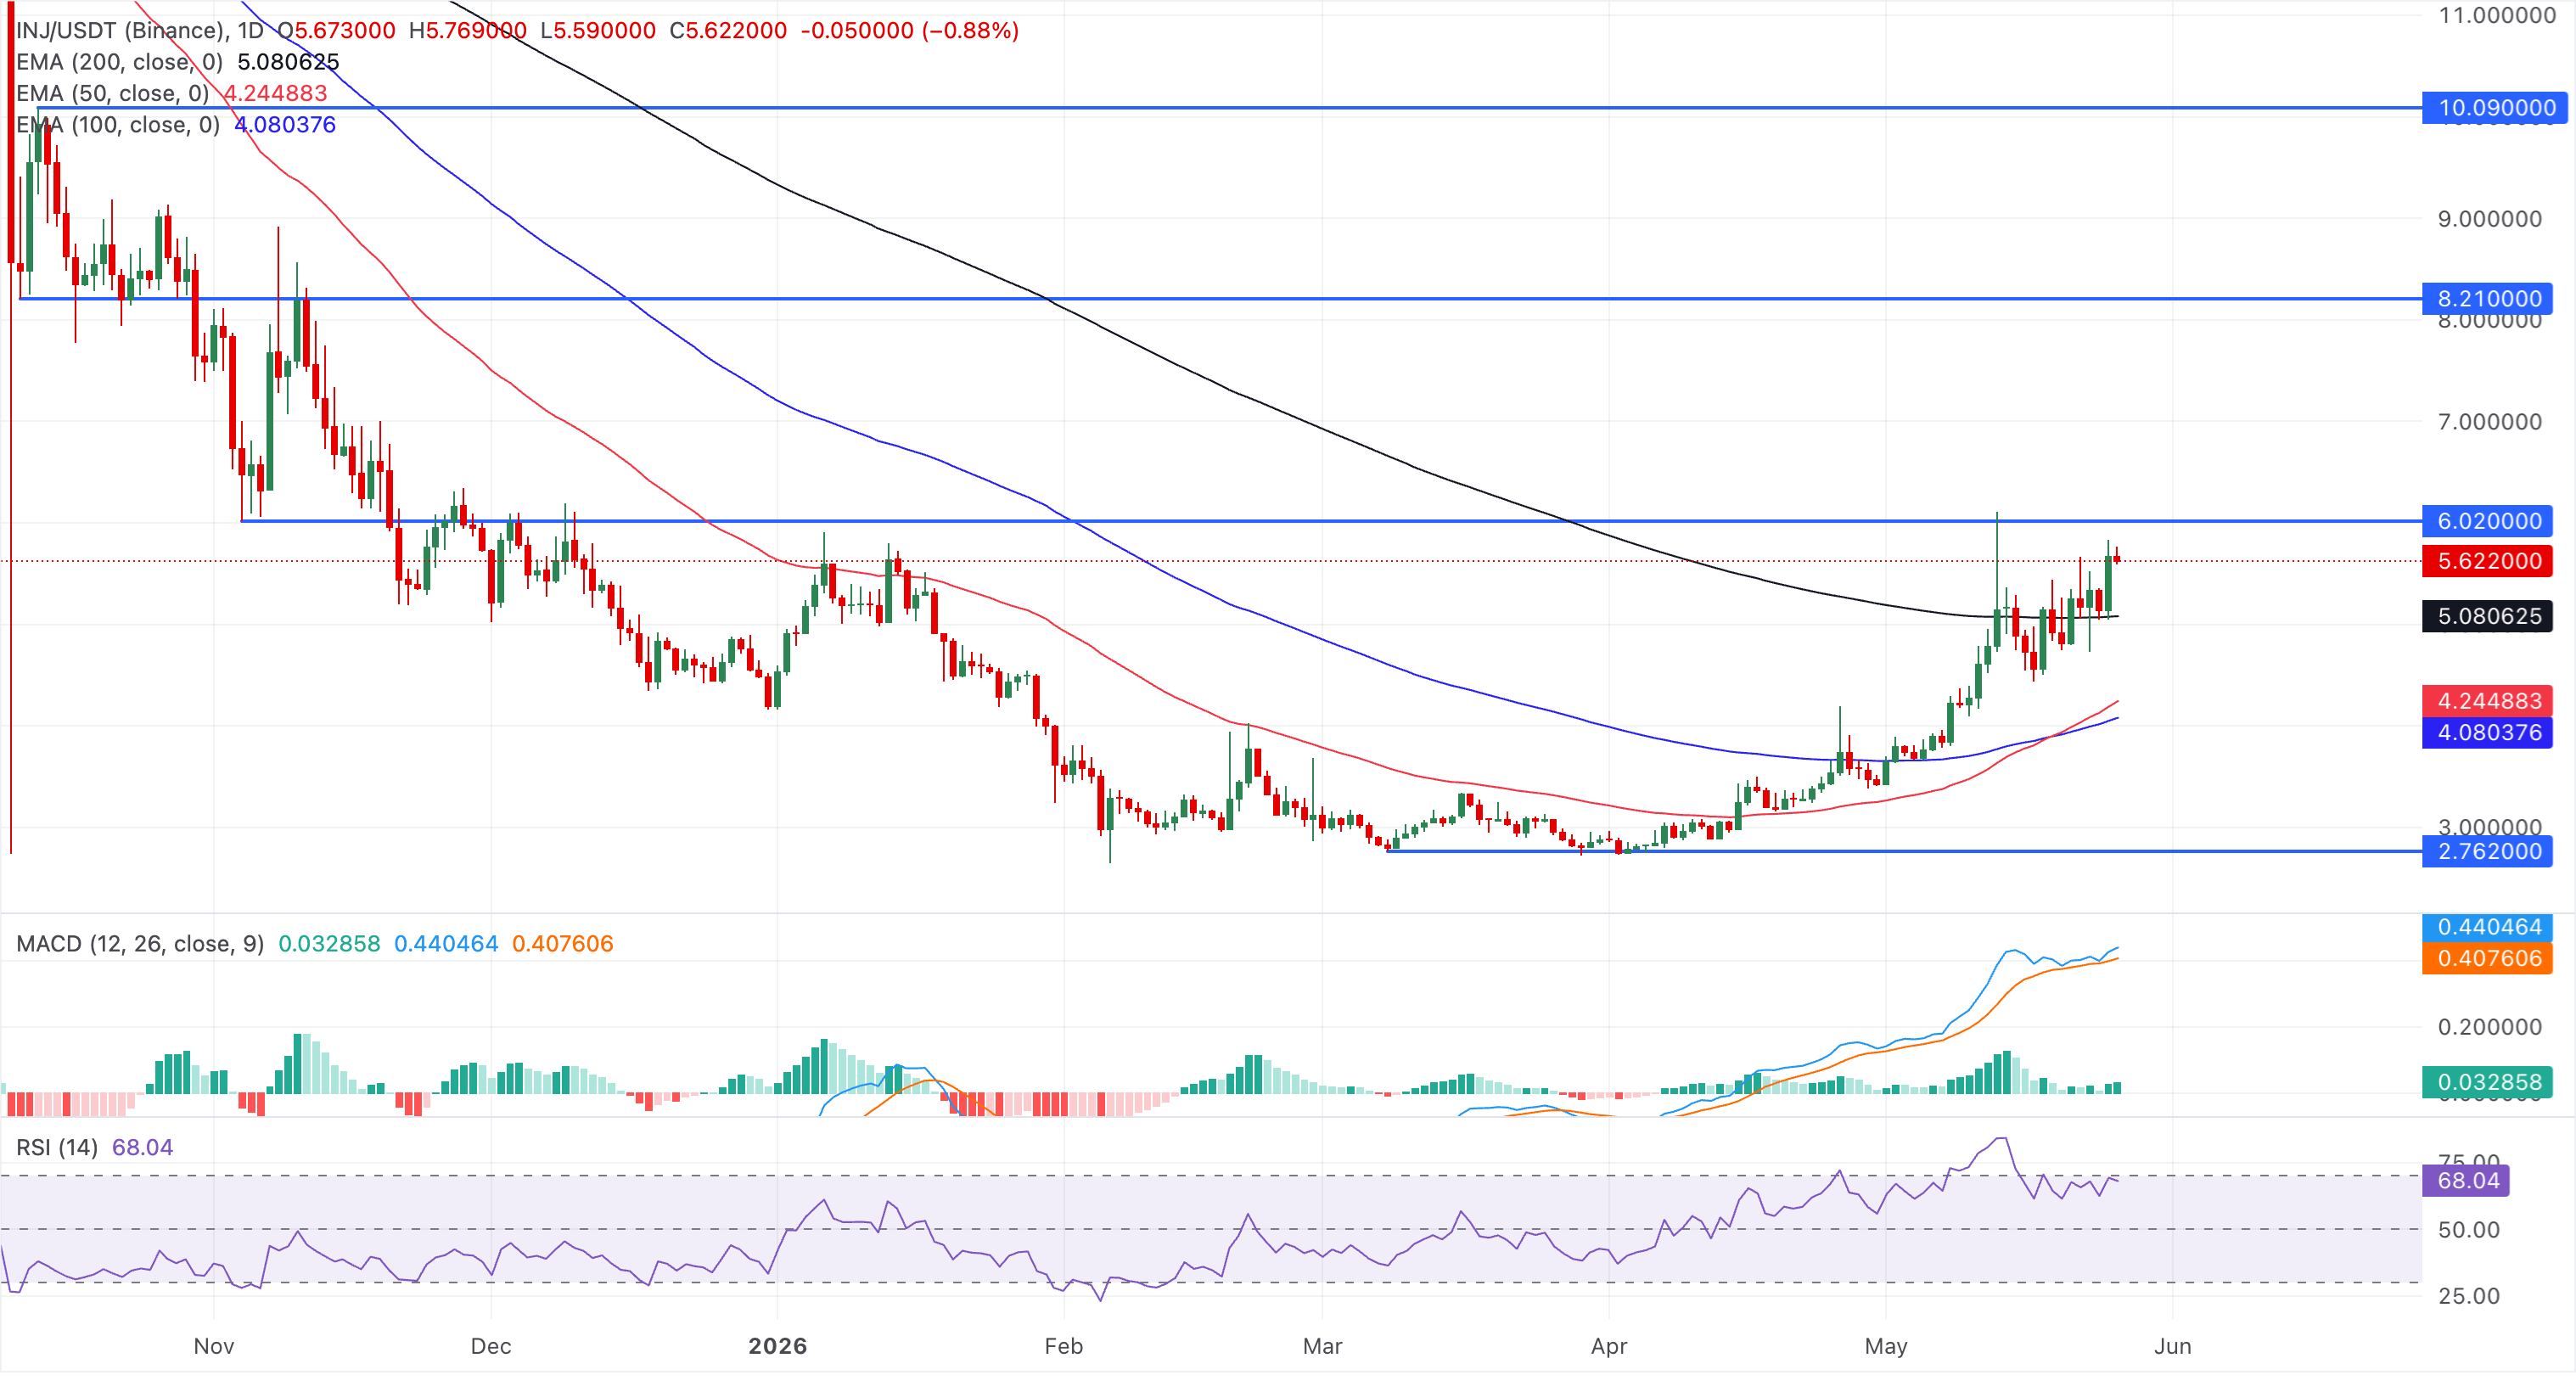
On the downside, initial support is seen at the 200-day EMA around $5.08, where a pullback could attract dip-buying interest. A deeper correction would expose the 50-day EMA near $4.24, followed by the 100-day EMA around $4.08 as a broader bullish accumulation zone.
(The technical analysis of this story was written with the help of an AI tool.)














