




Crypto Overview: Bitcoin weakens amid Coldcard hack – ALGO, ENA sustain gains
- Bitcoin edges lower on Monday, risking a steeper decline ahead.
- Market sentiment remains mixed amid the Coldcard wallet hack and Trump's cancellation of US strikes on Iran.
- Algorand and Ethena sustain gains over the last 24 hours, emerging as the top-performing altcoins.
Bitcoin (BTC) price edges lower on Monday, sliding toward $63,000 as bearish momentum resurfaces. The broader crypto market sentiment is mixed, with around 1,300 BTC stolen in the Coldcard wallet hack and the US President Donald Trump canceling strikes on Iran. Top-performing altcoins, Algorand (ALGO) and Ethena (ENA), sustain gains over the last 24 hours but remain capped below key resistance levels, risking further decline.

Market sentiment warms up amid new hacks, suspended US-Iran strikes
Coldcard, a Bitcoin-only hardware wallet by Coinkite, lost about 1,367.05 BTC, worth about $88.6 million, in the recent hack, affecting around 4,585 addresses. Multiple waves of attacks targeting firmware vulnerabilities have raised concerns over the cold-storage model in the industry.

On the geopolitics side, US President Donald Trump has canceled strikes on Iran upon reaching a deal on Iran’s nuclear program and the full reopening of the Strait of Hormuz, as previously reported by FXStreet.
Technical outlook: Will Bitcoin revisit $60,000?
Bitcoin maintains a bearish near-term bias below its 50-day Exponential Moving Average (EMA) at roughly $64,660 and well under the 200-day EMA near $74,291. The loss of these key averages as overhead barriers suggests rallies remain corrective for now.
The Relative Strength Index (RSI) around 45 maintains a declining slope, while the Moving Average Convergence Divergence (MACD) enters negative territory after crossing below its signal line. Taken together, the indicators reinforce a lack of strong bullish momentum.
The path of least resistance for BTC targets the $60,000 round figure, close to the previous swing low of $58,115.
On the topside, initial resistance is located at the 50-day EMA around $64,660, where a daily close above this level would be needed to ease immediate downside pressure and open the door toward the more distant 200-day EMA near $74,291.
Technical outlook: Algorand and Ethena stay vulnerable to deeper losses
Algorand edges lower on Monday, following an 8% rise the previous day. Still, ALGO remains capped below its 50-day EMA at $0.0871, reinforced by the 78.6% Fibonacci retracement level at $0.0862, measured from the $0.1396 high to the $0.0757 low.
A decisive close above this cluster of resistance would reduce the downside pressure, potentially extending the recovery toward the 50% retracement at $0.1027.
Despite this capped structure, momentum has improved, with the RSI at 53 hovering just above the midline and the MACD crossing above its signal line, suggesting a corrective rebound rather than a confirmed trend reversal.
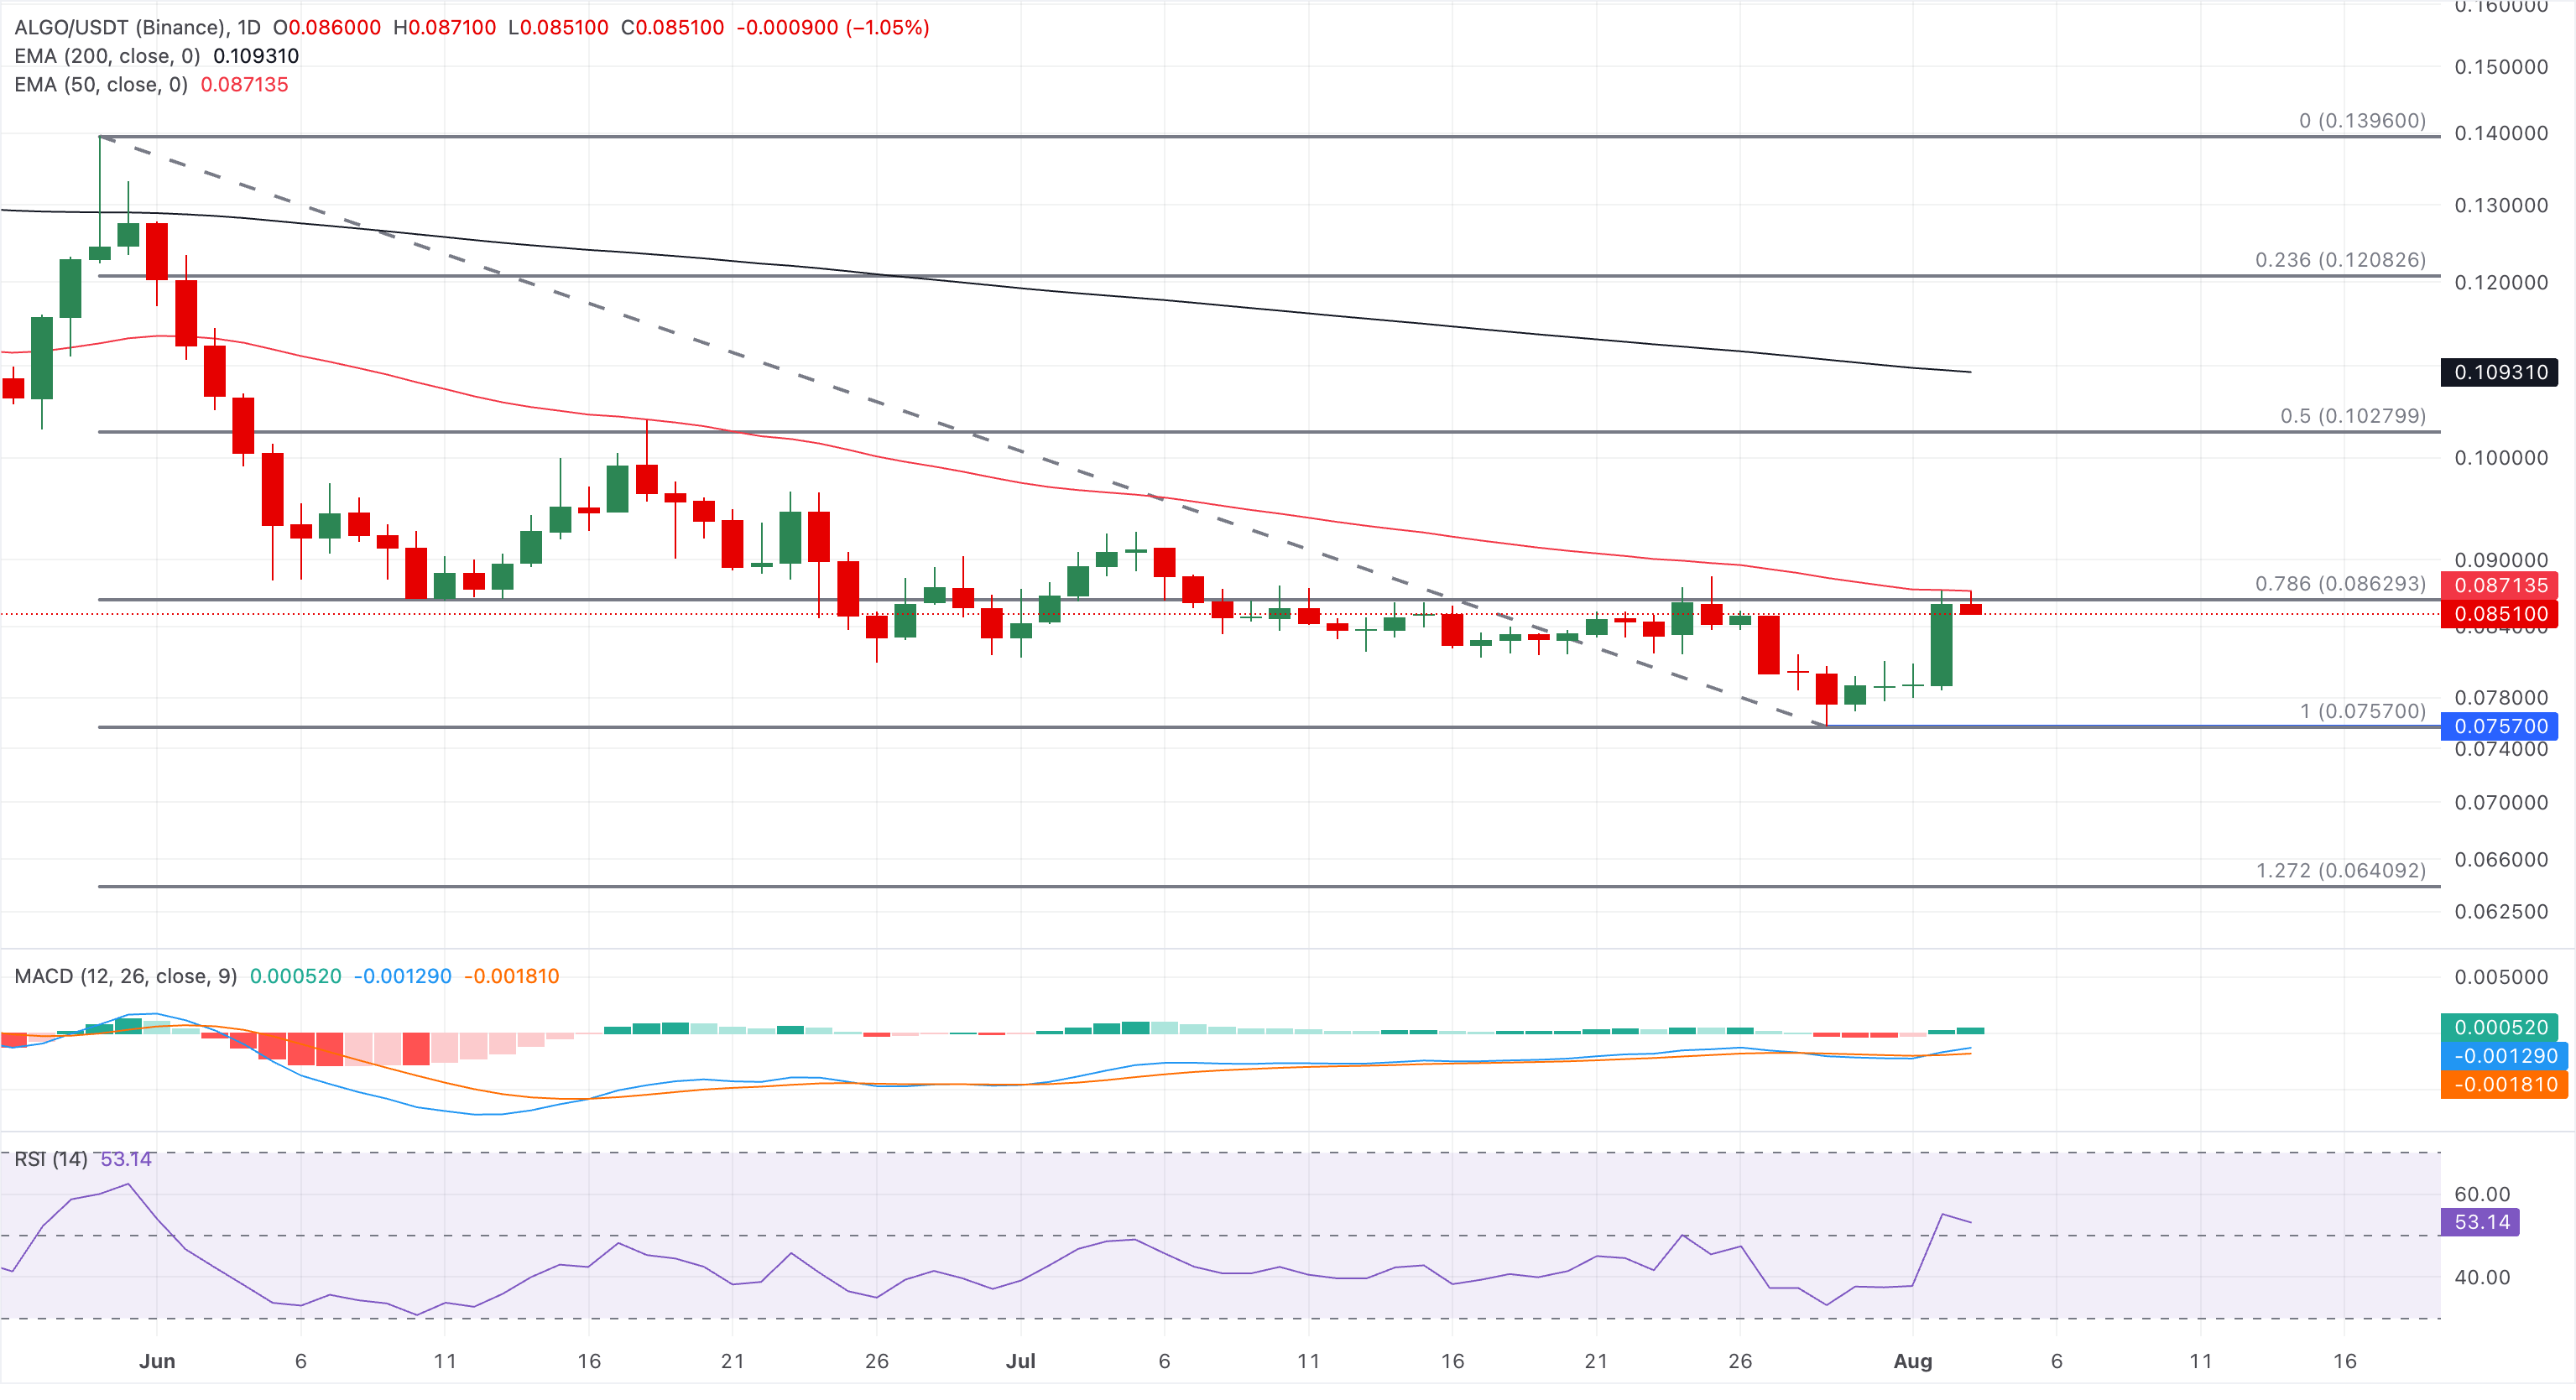
On the downside, the main structural support sits at the Fibonacci anchor near $0.0757, where buyers would be expected to defend the record low if the current pullback resumes.
Ethena trades above its 50-day EMA at $0.0847 but remains well capped by the longer-term declining trendline near $0.0905, which sits well below the 200-day EMA at $0.1409. This configuration suggests a broader bearish bias, with price attempting to stabilize in the lower end of its recent decline. A sustained move above $0.1000 would open the way toward the more significant barrier at the 200-day EMA around $0.1409, where the broader bearish structure is reinforced.
Momentum is mildly constructive, as the RSI around 55 holds above the midline, while the MACD and signal line flash a bullish crossover, hinting that sellers are losing some control rather than signaling a clear bullish reversal.
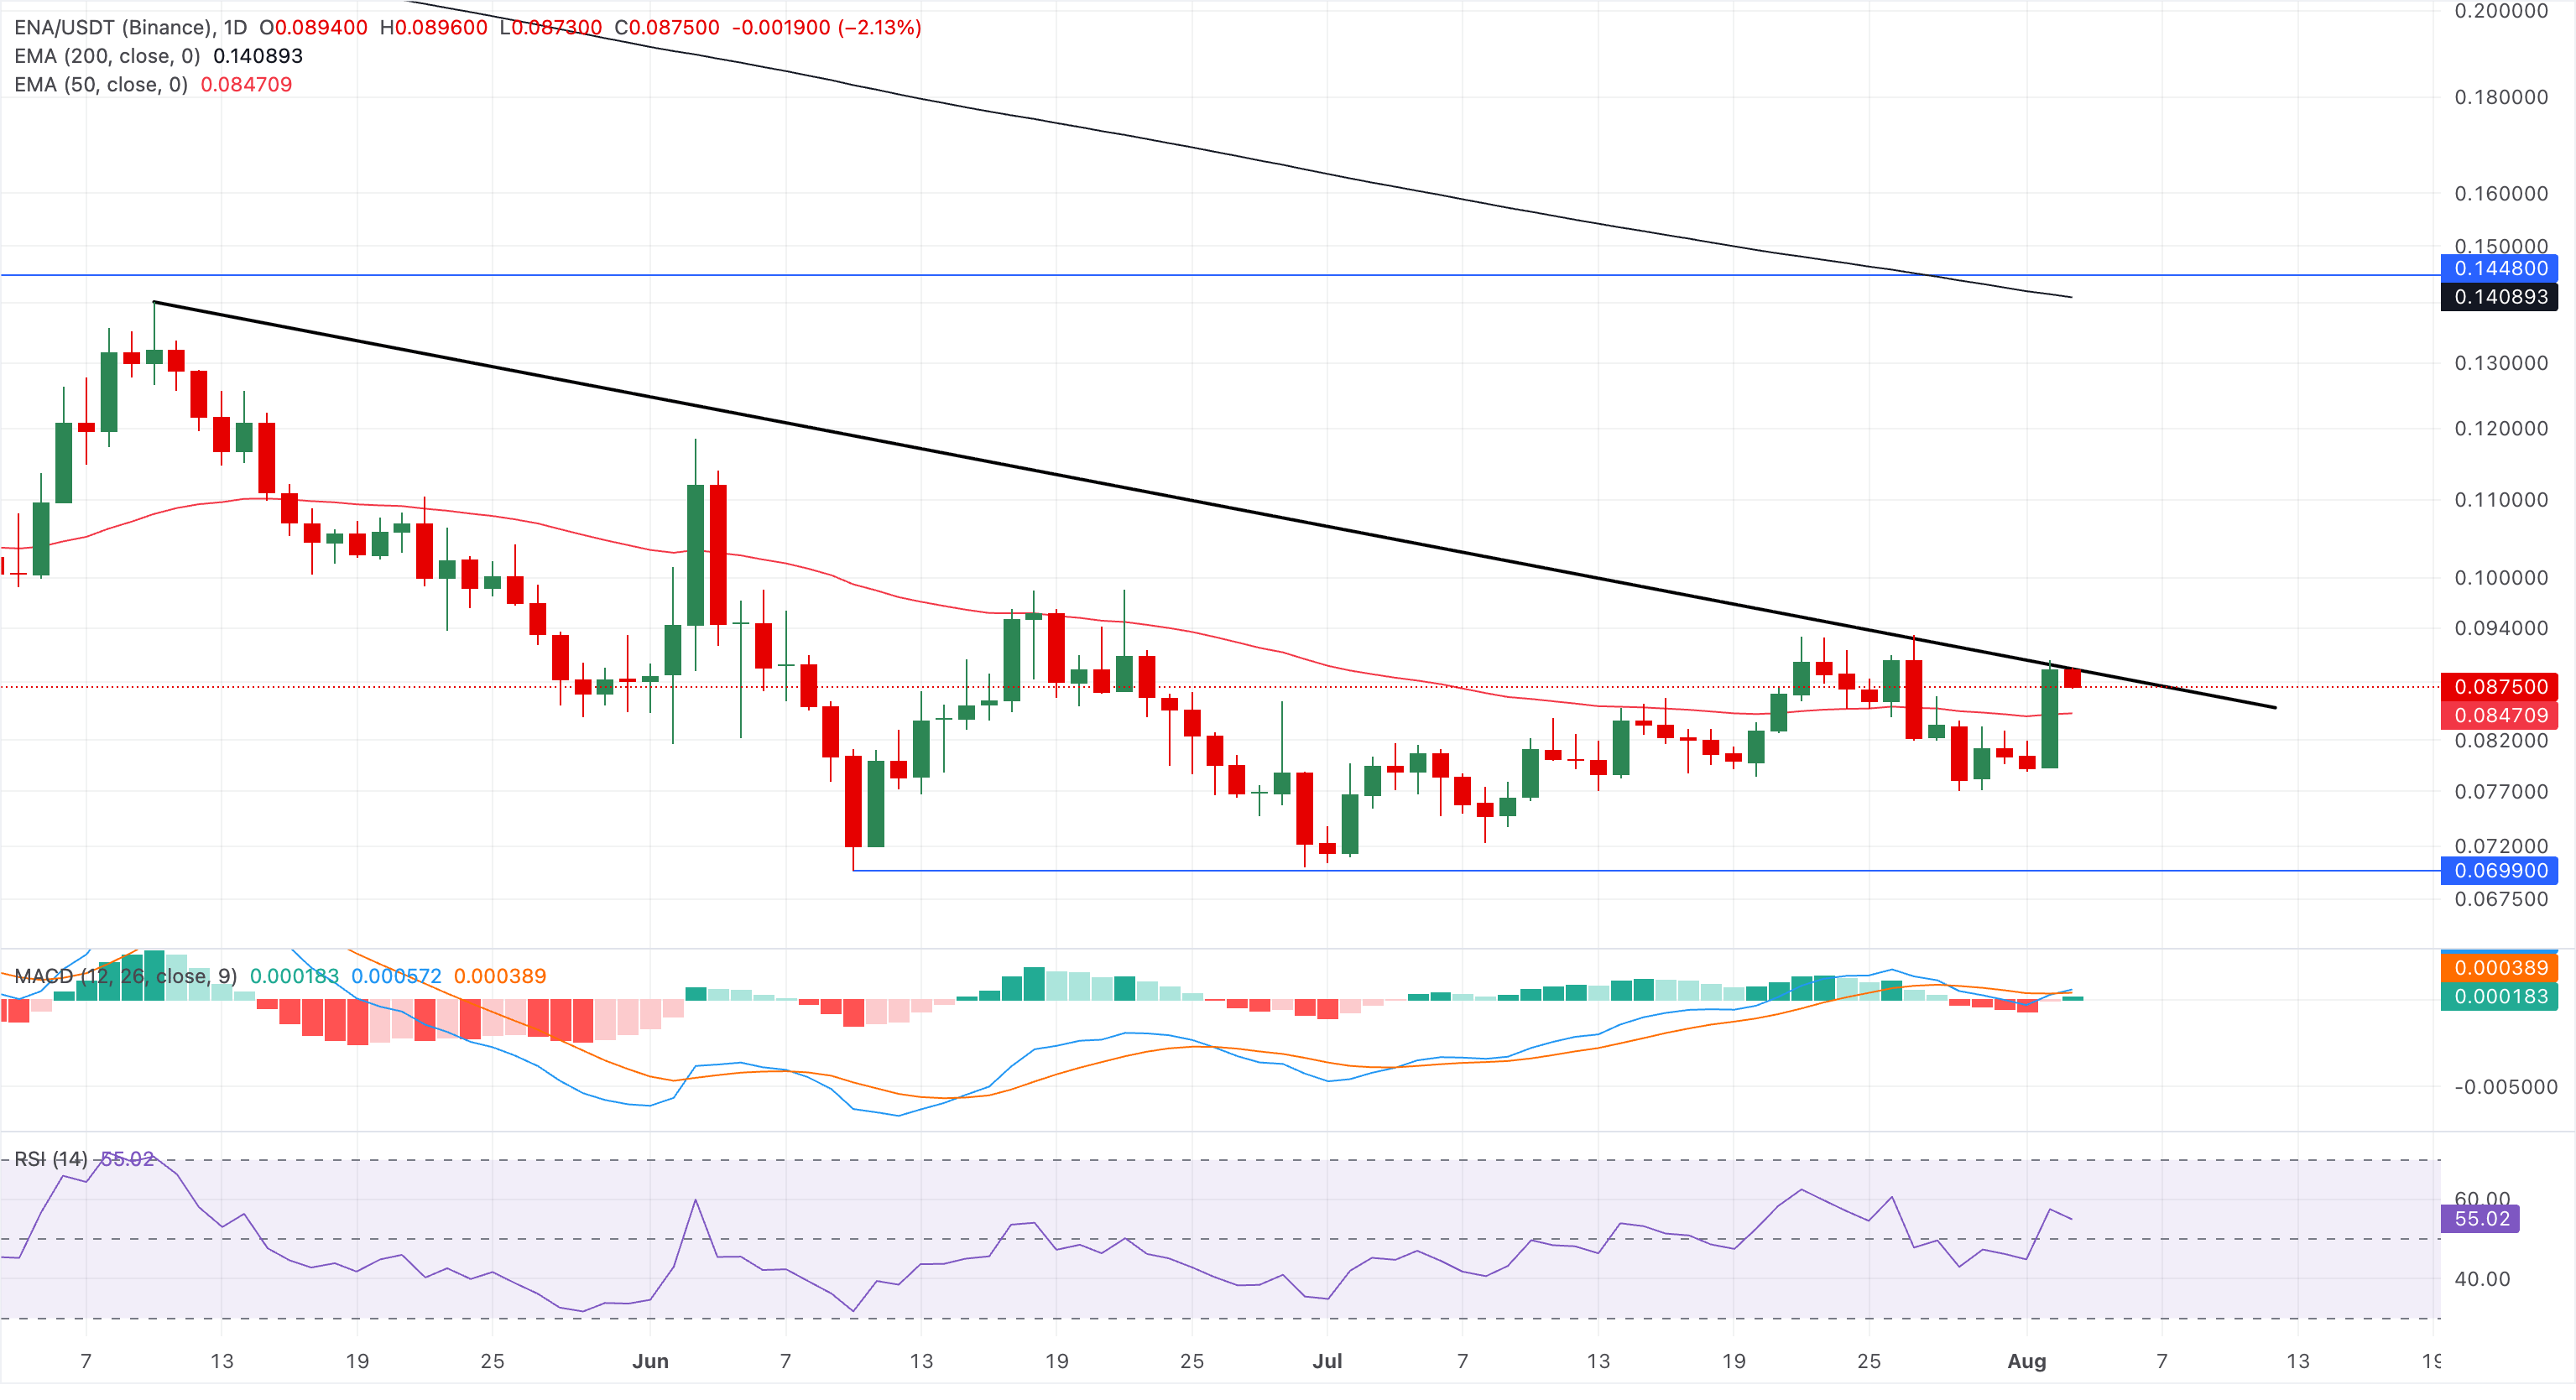
On the downside, nearby support is defined by the 50-day EMA at $0.0847, where a daily close below this floor would expose ENA to renewed selling pressure and a potential retest of the recent lows.
(The technical analysis of this story was written with the help of an AI tool. Know more.)













