

GBP/JPY Price Forecast: Short-term trend turns negative below 210.00 handle
- GBP/JPY trades on the defensive after disappointing UK jobs data reinforced bets on BoE interest rate cuts this year.
- On a 4-hour chart, technical indicators align with the bearish bias, as moving averages slope lower and momentum oscillators remain in negative territory.
- Immediate resistance stands at 208.50-209.00, while a break below 207.00 could open the door toward the 205.00 support zone.
GBP/JPY snaps a two-day winning streak on Tuesday as weak UK labour market data fuels expectations of Bank of England (BoE) interest rate cuts, weighing on the British Pound (GBP). At the time of writing, GBP/JPY is trading around 207.28, down nearly 0.93% on the day and hovering near a two-month low.

Following the UK labour market data, markets are now fully pricing in two rate cuts by the BoE this year, with expectations building for the first reduction as early as March.
Meanwhile, the Japanese Yen (JPY) holds firm across the board, underpinned by growing optimism around Prime Minister Sanae Takaichi’s pro-stimulus policy agenda and firming expectations that the Bank of Japan (BoJ) could raise interest rates in the coming months.
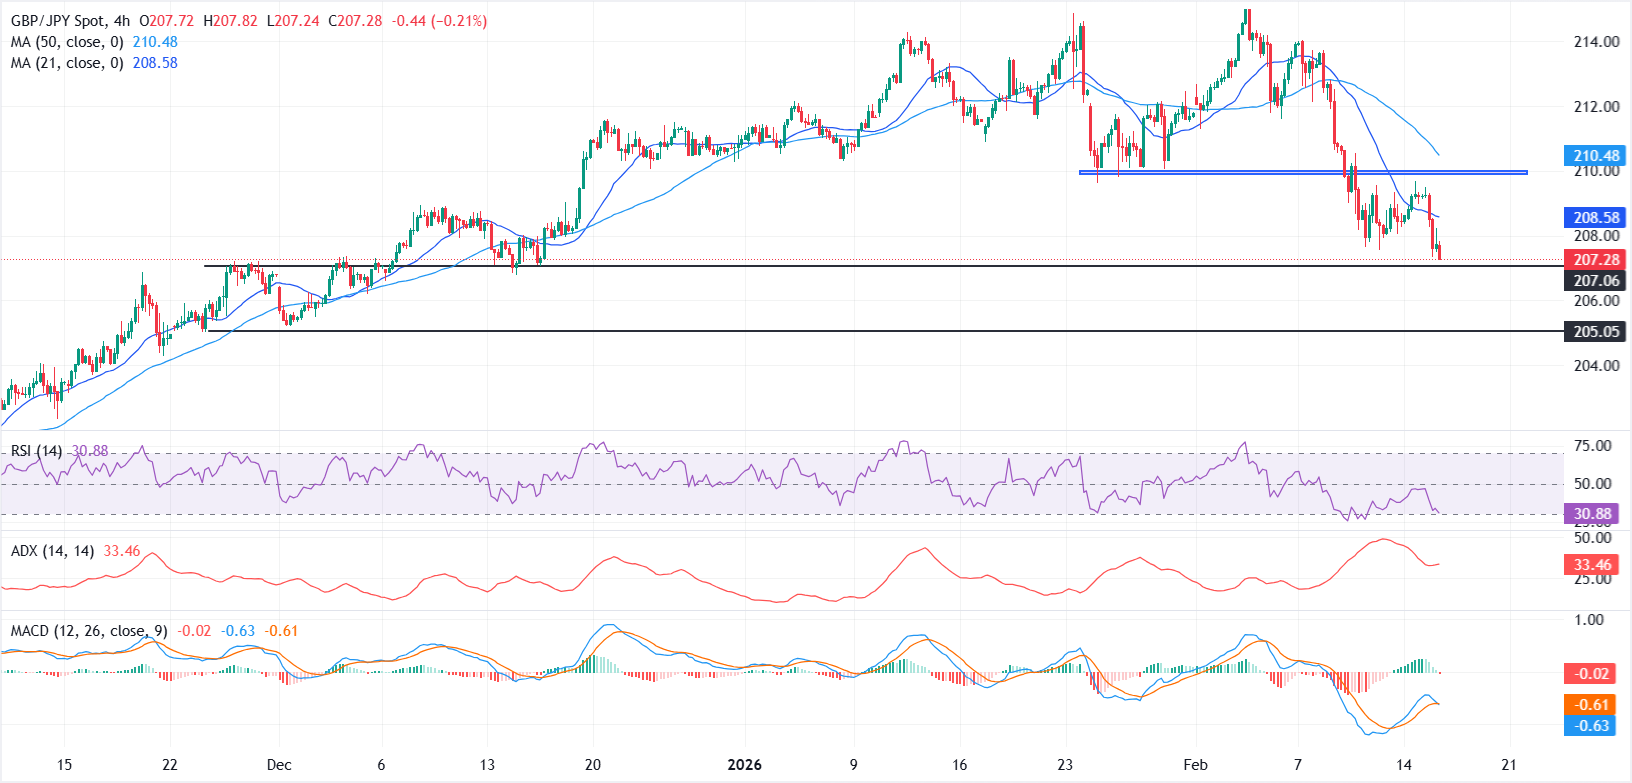
From a technical perspective, the four-hour chart suggests the short-term structure has turned decisively bearish, with price action slipping below key moving averages.
GBP/JPY reversed sharply from multi-year highs after failing to sustain gains above the 214.00 mark earlier this month. Bearish momentum accelerated once the pair broke and retested the 210.00 psychological level, paving the way for fresh lower lows.
The 21-period Simple Moving Average (SMA) has crossed below the 50-period SMA and is now acting as immediate resistance near 208.58, reinforcing the negative bias. Both moving averages continue to slope lower, while prices remain capped beneath them.
On the downside, the 207.00 level may offer near-term support. A sustained break below this zone would likely intensify selling pressure and expose the next support around 205.00. Conversely, a decisive move back above 210.00 would be required to ease the downside bias, with 212.00 emerging as the next resistance zone.
Momentum indicators align with the bearish outlook. The Moving Average Convergence Divergence (MACD) histogram has slipped slightly below the zero line, signaling a bearish crossover and fading upside momentum.
Meanwhile, the Relative Strength Index (RSI) hovers near 31, approaching oversold territory, reflecting persistent selling pressure.
Japanese Yen Price Today
The table below shows the percentage change of Japanese Yen (JPY) against listed major currencies today. Japanese Yen was the strongest against the British Pound.
| USD | EUR | GBP | JPY | CAD | AUD | NZD | CHF | |
|---|---|---|---|---|---|---|---|---|
| USD | 0.27% | 0.72% | -0.23% | 0.17% | 0.45% | 0.23% | 0.23% | |
| EUR | -0.27% | 0.45% | -0.49% | -0.09% | 0.18% | -0.05% | -0.04% | |
| GBP | -0.72% | -0.45% | -0.91% | -0.54% | -0.27% | -0.49% | -0.49% | |
| JPY | 0.23% | 0.49% | 0.91% | 0.42% | 0.69% | 0.45% | 0.46% | |
| CAD | -0.17% | 0.09% | 0.54% | -0.42% | 0.27% | 0.04% | 0.05% | |
| AUD | -0.45% | -0.18% | 0.27% | -0.69% | -0.27% | -0.22% | -0.23% | |
| NZD | -0.23% | 0.05% | 0.49% | -0.45% | -0.04% | 0.22% | -0.00% | |
| CHF | -0.23% | 0.04% | 0.49% | -0.46% | -0.05% | 0.23% | 0.00% |
The heat map shows percentage changes of major currencies against each other. The base currency is picked from the left column, while the quote currency is picked from the top row. For example, if you pick the Japanese Yen from the left column and move along the horizontal line to the US Dollar, the percentage change displayed in the box will represent JPY (base)/USD (quote).














