

GBP/JPY Price Forecast: Trapped between key SMAs, bulls eye 214.00
- GBP/JPY consolidates between 100-day and 50-day SMA boundaries.
- RSI shows sellers in control despite broader bullish structure.
- Break above 214.00 exposes 215.62 and YTD high.
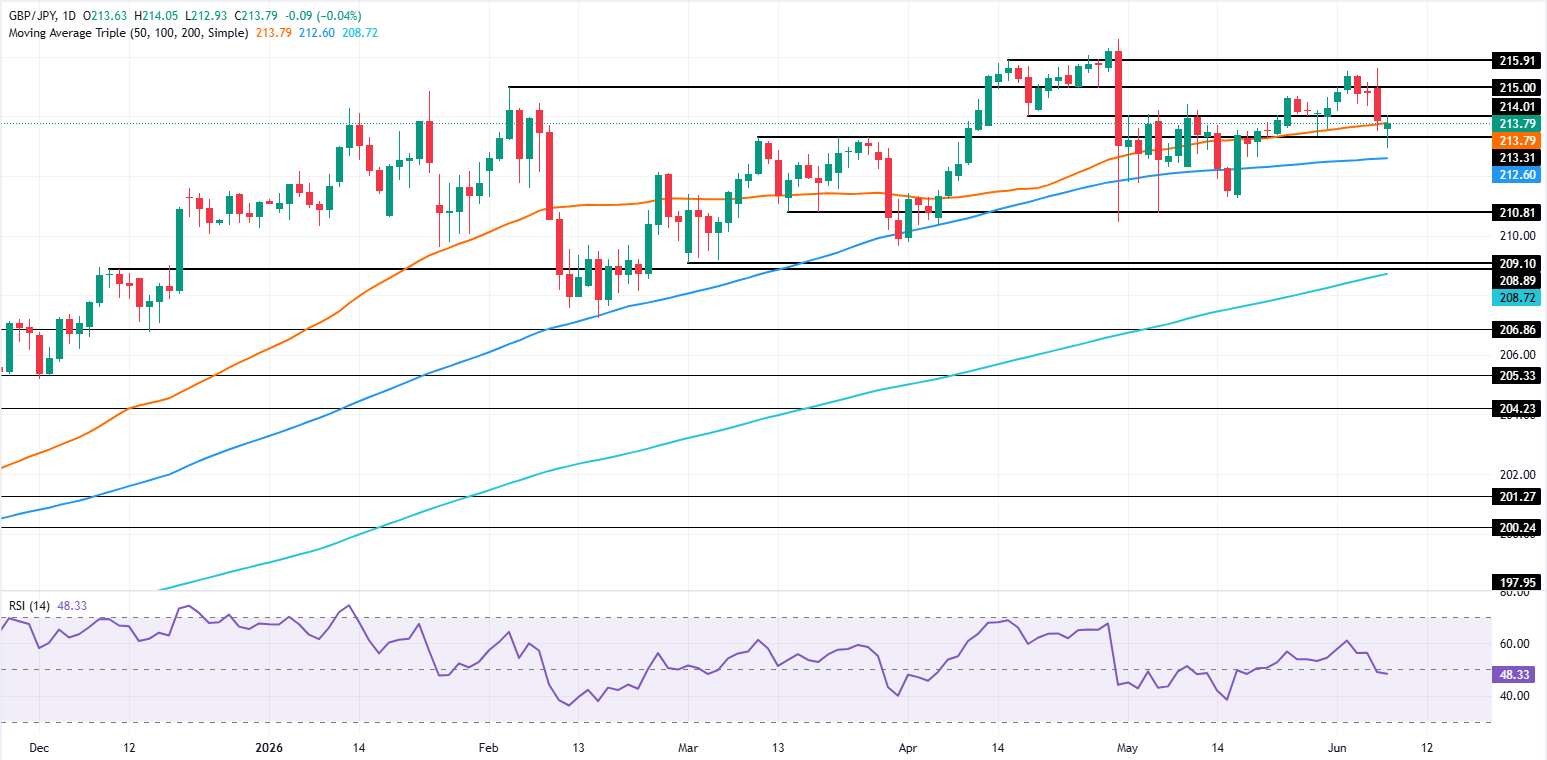
The GBP/JPY trims some of its earlier losses, turns nearly flat during the day at around 213.60, and is modestly down 0.09% amid a mixed market mood, an indication of cautious trading amid the ongoing environment.
GBP/JPY Price Forecast: Technical Outlook
Price action shows the GBP/JPY is consolidating following last week’s losses of over 0.21%, capped on the downside by the 100-day Simple Moving Average (SMA) at 212.62, and on the top by the 50-day SMA at 213.87.

The Relative Strength Index (RSI) indicates that, in the near term, sellers are in charge. But the market structure of successive higher highs and higher lows suggests further upside for GBP/JPY.
If GBP/JPY reclaims 214.00, the next resistance would be the June 15 high at 215.62. Above this area, the next stop would be the year-to-date (YTD) high of 216.61.
Downwards, the first support for GBP/JPY would be 213.00. Below the figure, the next stop would be the 100-day SMA at 212.62, followed by the 212.00 mark.
GBP/JPY Price Chart – Daily
Japanese Yen Price Today
The table below shows the percentage change of Japanese Yen (JPY) against listed major currencies today. Japanese Yen was the strongest against the Swiss Franc.
| USD | EUR | GBP | JPY | CAD | AUD | NZD | CHF | |
|---|---|---|---|---|---|---|---|---|
| USD | -0.11% | -0.04% | -0.10% | 0.06% | 0.05% | -0.30% | 0.22% | |
| EUR | 0.11% | 0.06% | -0.02% | 0.15% | 0.14% | -0.18% | 0.31% | |
| GBP | 0.04% | -0.06% | -0.06% | 0.09% | 0.02% | -0.23% | 0.23% | |
| JPY | 0.10% | 0.02% | 0.06% | 0.14% | 0.12% | -0.16% | 0.28% | |
| CAD | -0.06% | -0.15% | -0.09% | -0.14% | -0.00% | -0.32% | 0.15% | |
| AUD | -0.05% | -0.14% | -0.02% | -0.12% | 0.00% | -0.28% | 0.18% | |
| NZD | 0.30% | 0.18% | 0.23% | 0.16% | 0.32% | 0.28% | 0.44% | |
| CHF | -0.22% | -0.31% | -0.23% | -0.28% | -0.15% | -0.18% | -0.44% |
The heat map shows percentage changes of major currencies against each other. The base currency is picked from the left column, while the quote currency is picked from the top row. For example, if you pick the Japanese Yen from the left column and move along the horizontal line to the US Dollar, the percentage change displayed in the box will represent JPY (base)/USD (quote).














