

Hyperliquid Price Forecast: HYPE extends losses as retail demand fades
- Hyperliquid edges below $70 on Wednesday, extending losses so far this week.
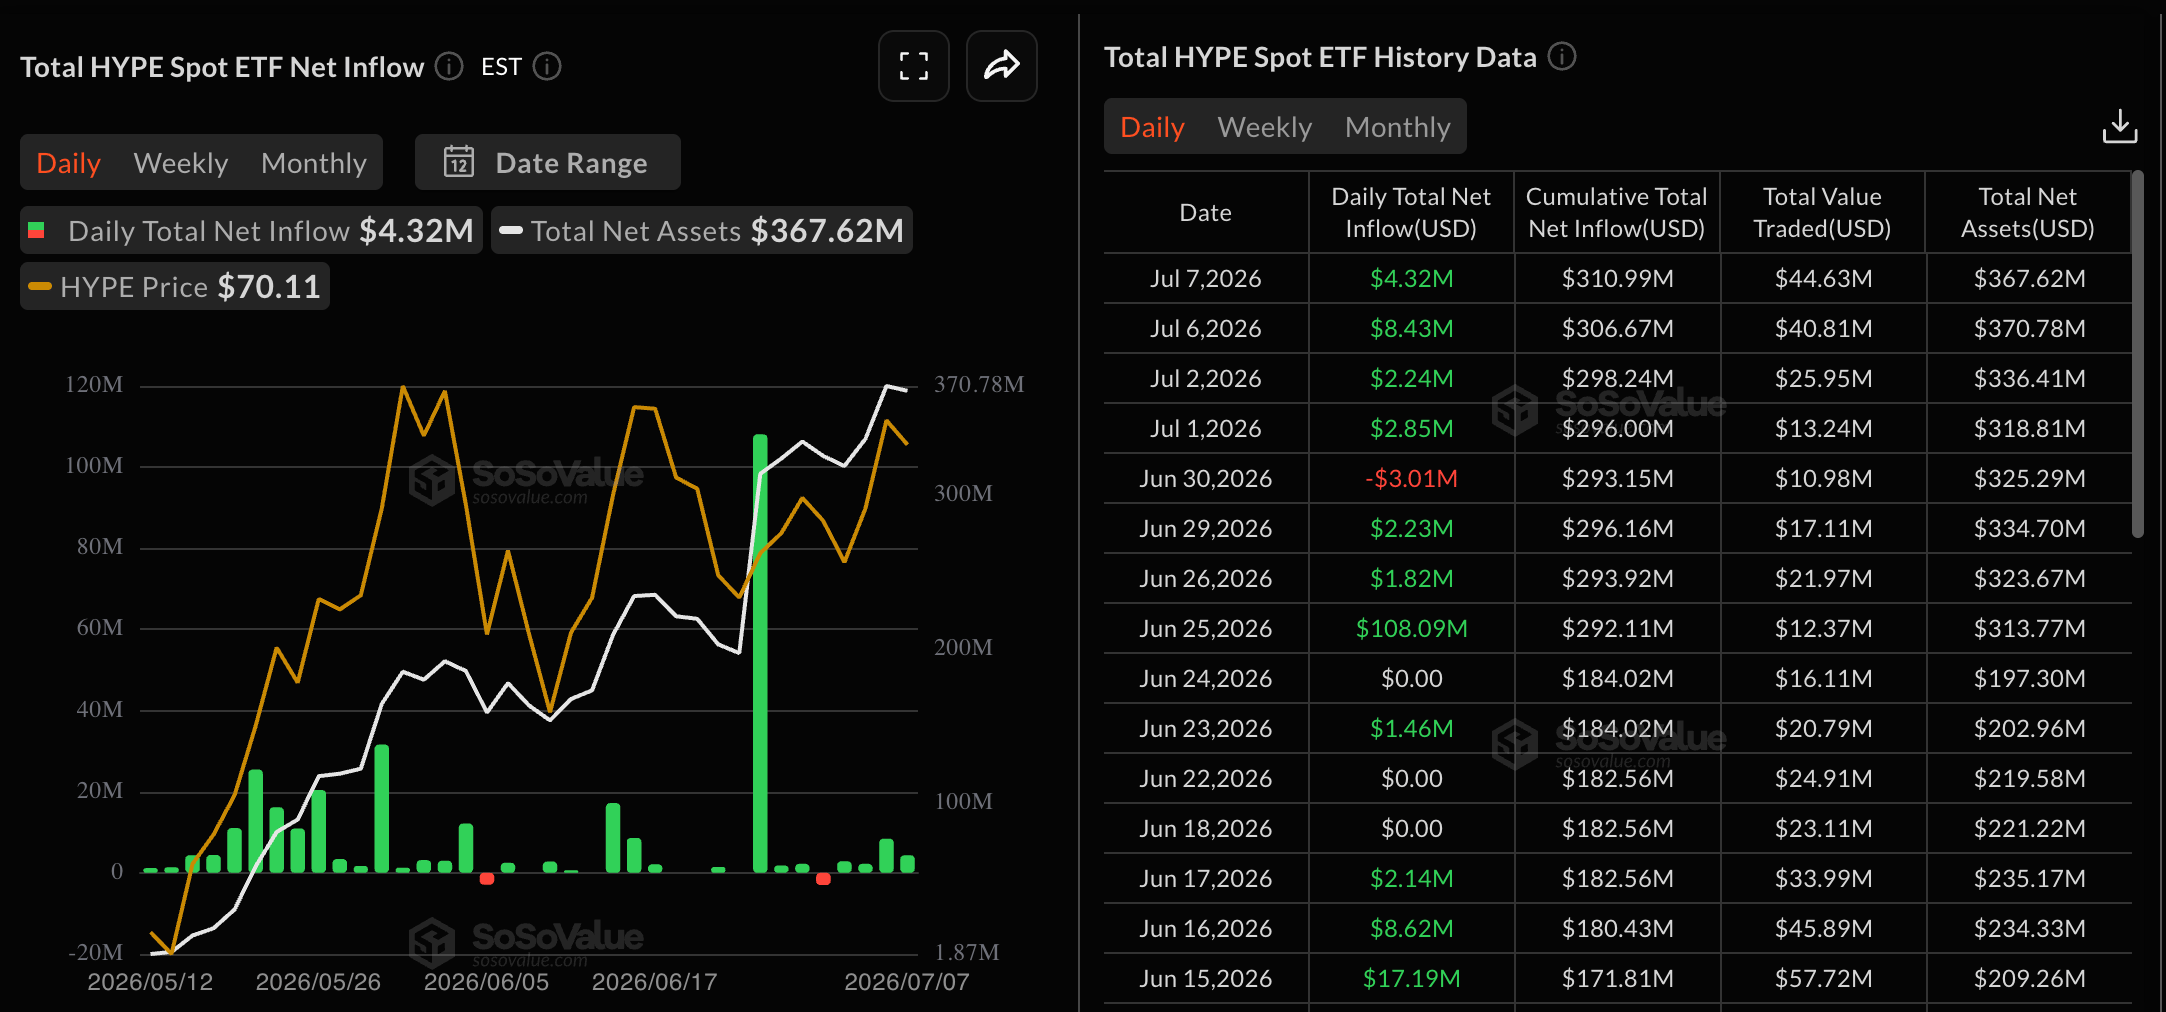
- HYPE-focused ETFs recorded $4.32 million in inflows on Tuesday, following over $8 million the previous day, reflecting steady institutional demand.
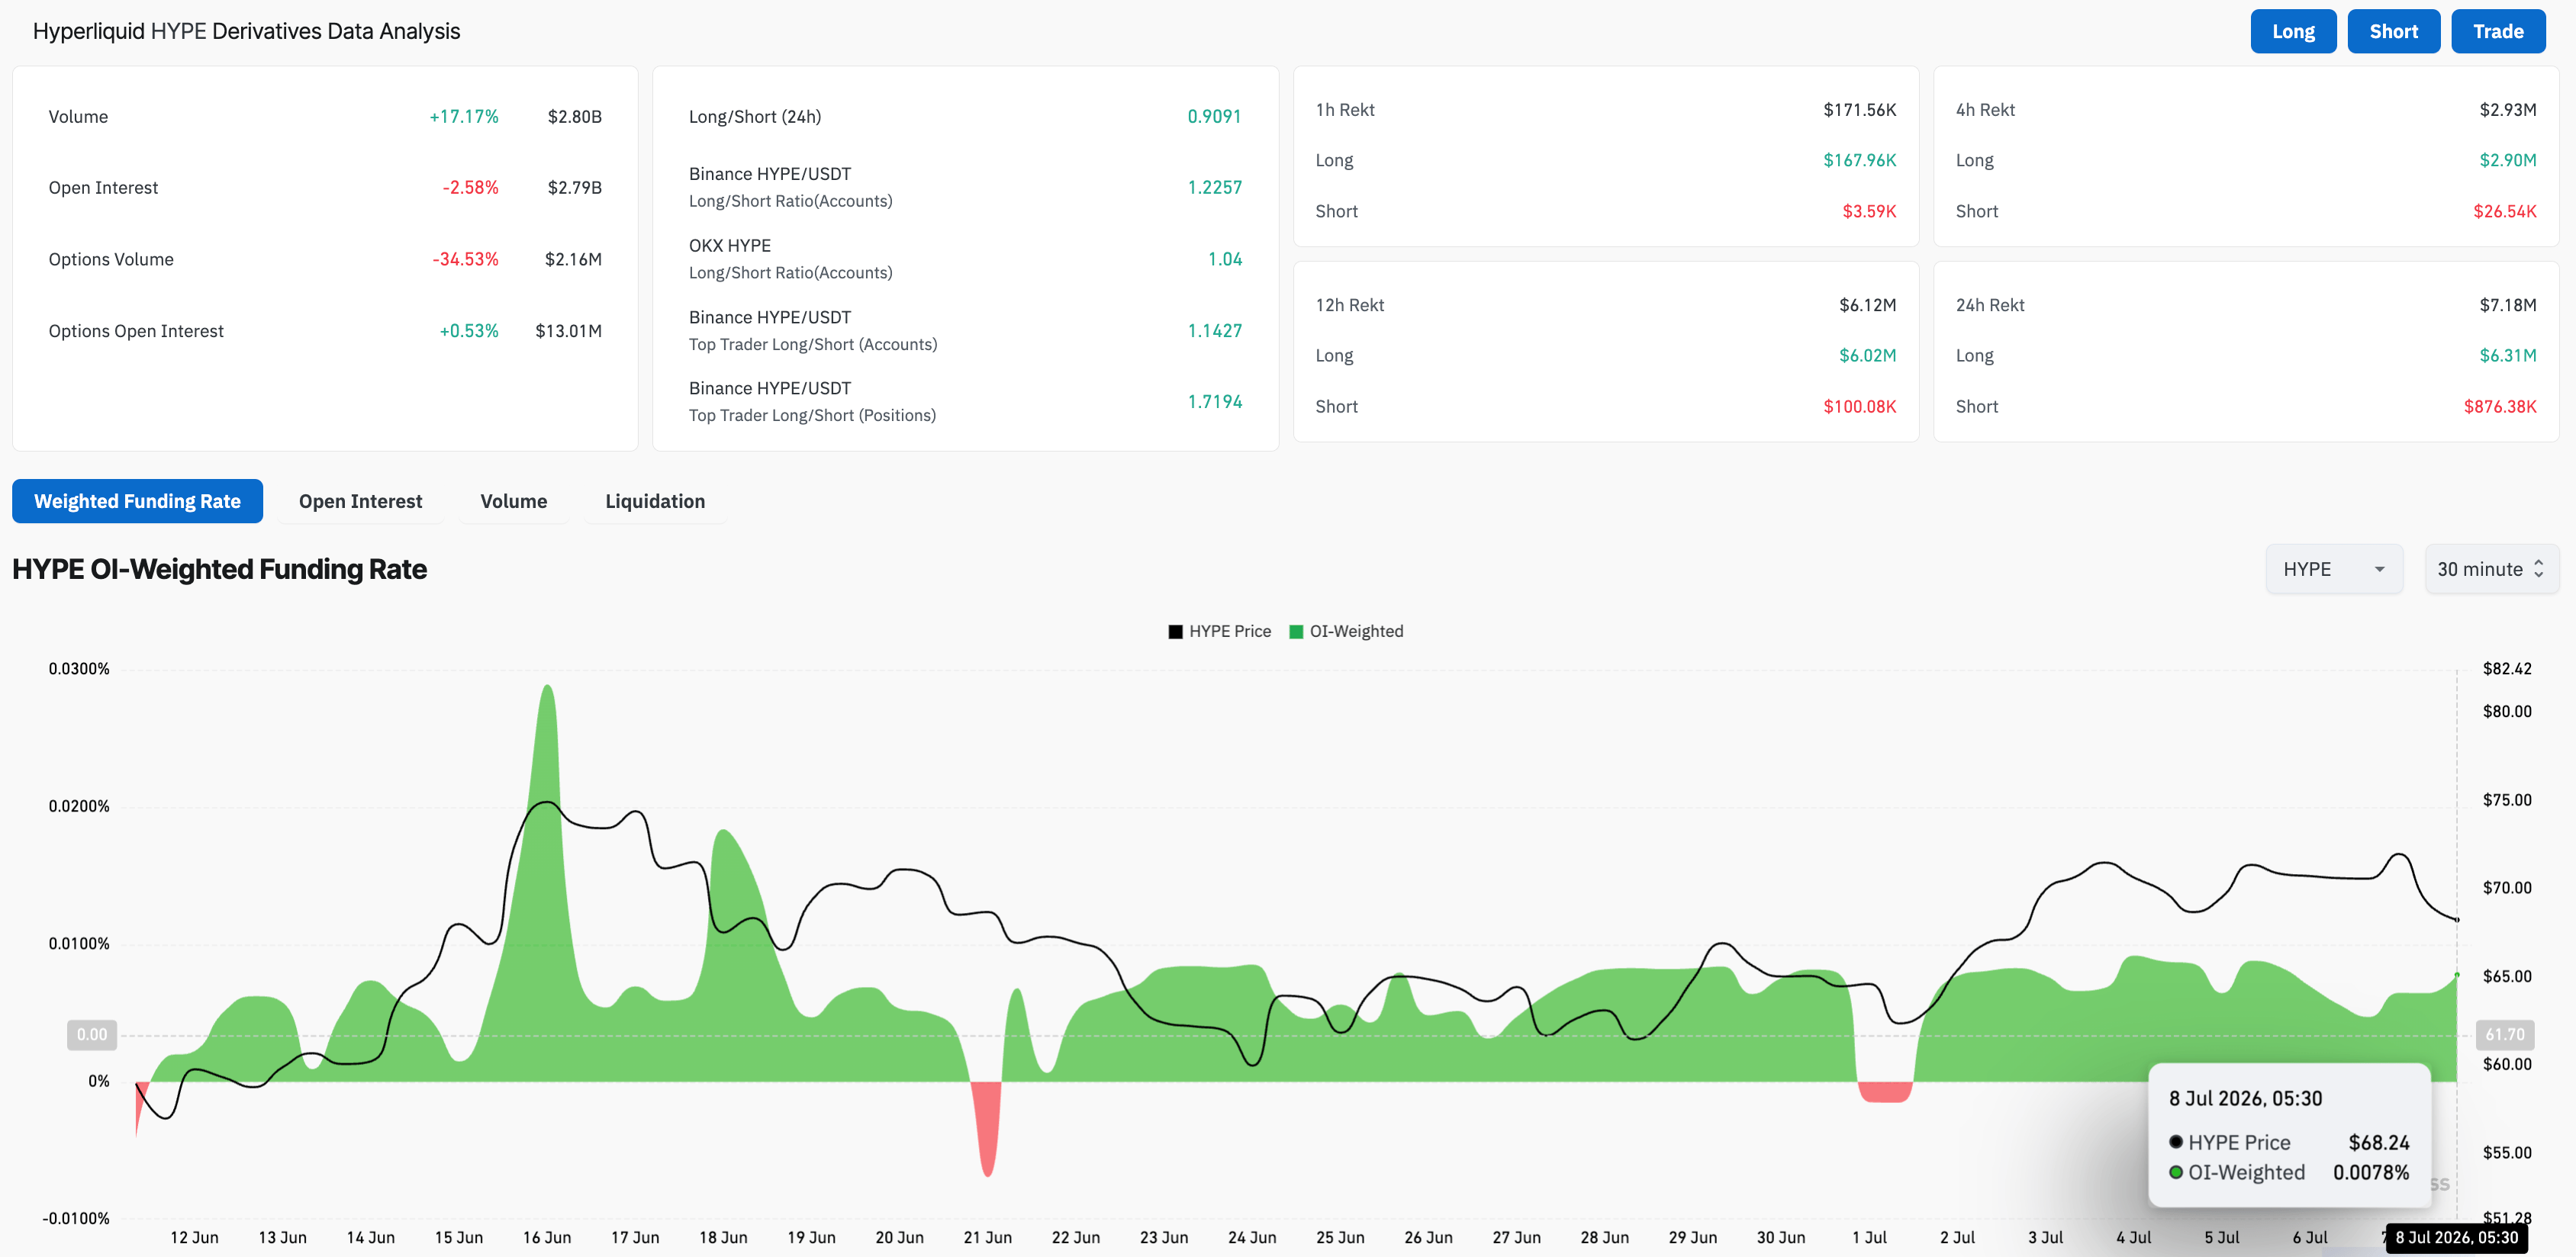
- Retail demand eases in HYPE as Open Interest wanes amid heightened long liquidations.
Hyperliquid (HYPE) slips below $70 on Wednesday, extending a steady decline so far this week. A broader market risk-off sentiment weighs down on the retail support for HYPE despite steady institutional demand, with $4.32 million in inflows on Tuesday.

Technically, HYPE is poised for a steeper decline toward a support trendline near $64.75, reinforced by the rising 50-day Exponential Moving Average (EMA) at $62.36.
HYPE loses retail strength despite firm ETF inflows
Hyperliquid is losing retail demand as broader crypto market risk-off sentiment persists. CoinGlass data shows the HYPE futures Open Interest (OI) is down over 2% in the last 24 hours to $2.79 billion, implying that traders are either reducing leverage or closing positions. The positional easing aligns with $7.18 million in total liquidations in the same period, led by $6.31 million in long liquidations, reaffirming sell-side dominance.
However, the funding rate remains stable in the positive range of 0.0078%, reflecting residual bullish sentiment, with some hoping for a rebound.
On the institutional side, demand holds steady with HYPE ETFs recording $4.32 million in inflows on Tuesday, after $8.43 million on Monday. This divergence in institutional and retail activity reflects short-term weakness but long-term upside potential.
Could HYPE extend losses below $60?
Hyperliquid trades around $68 at press time on Wednesday, maintaining a broader bullish bias as price holds above the 50-day EMA at $62.36, which sits well above the 200-day EMA at $48.40. HYPE shows a mild short-term weakness with the third consecutive day of losses so far this week, capped by a local resistance trendline near $72.75 on Monday.
From a technical perspective, the pullback suggests a steeper correction toward a rising support trendline near $64.75, backed by the 50-day EMA at $62.36.
Momentum is constructive, with the Moving Average Convergence Divergence (MACD) modestly above its signal line, while the Relative Strength Index (RSI) at 54 shows mild bullish momentum easing toward a neutral range.
On the topside, the key hurdle is the downtrend resistance line break zone at $72.73, where a decisive daily close above could reinforce the bullish bias and open the way toward the R1 and R2 Pivot Points at $77.09 and $89.14, respectively.
(The technical analysis of this story was written with the help of an AI tool. Know more.)














