

Hyperliquid Price Forecast: HYPE grinds above $40 amid faltering social dominance
- Hyperliquid hovers above $40 on Monday, extending gains within a rising wedge pattern.
- Declining social dominance of HYPE amid easing pressure in the Middle East points to cooling retail interest.
- A surge in Open Interest and funding rate suggests a positional buildup in HYPE futures.
Hyperliquid (HYPE) trades around $42 at press time on Monday, maintaining a lifting-off phase from an ascending trendline. Retail interest in the Decentralized Exchange (DEX) is cooling as social dominance fades, while the HYPE futures see an increase in Open Interest and funding rates, signaling leverage-linked positional buildup.

Hyperliquid’s retail strength is in limbo
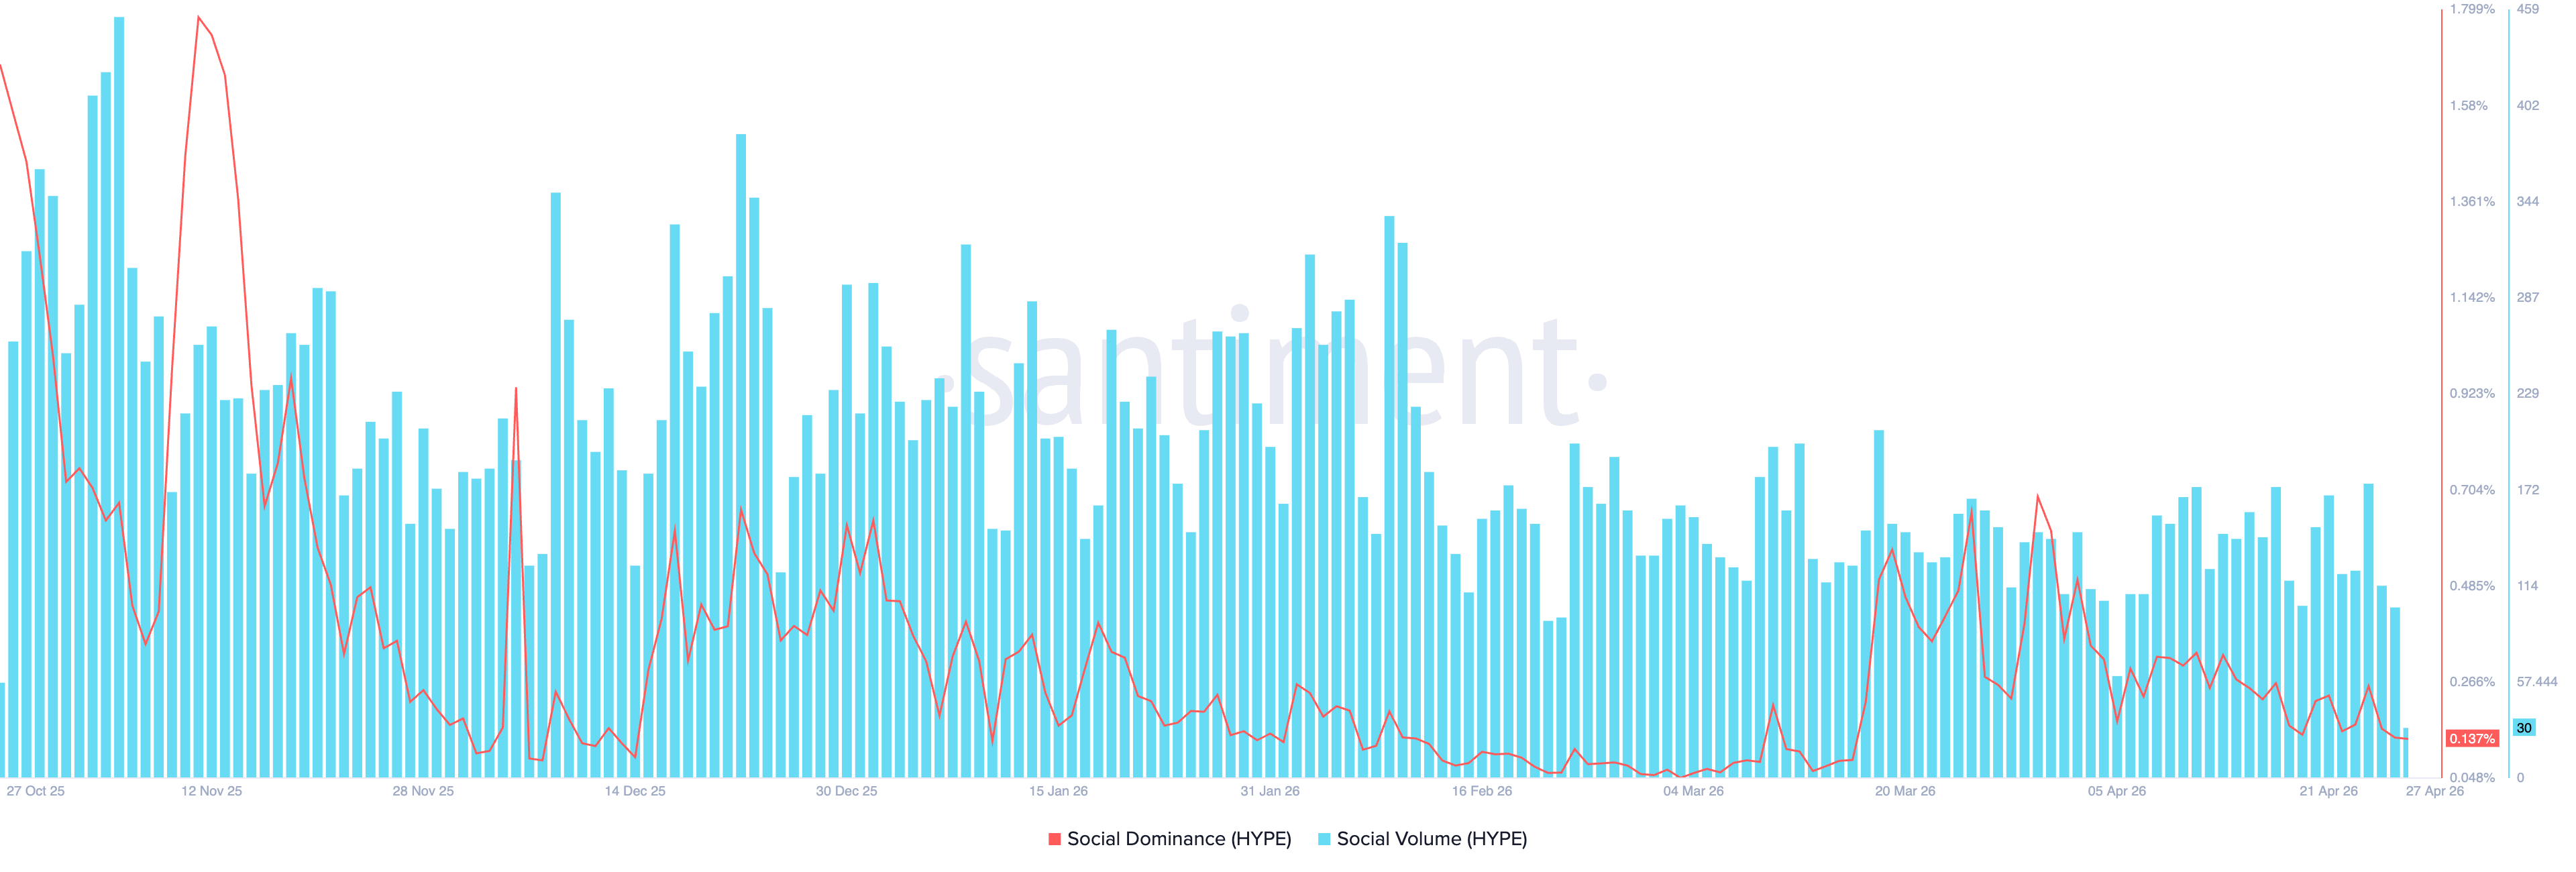
The social buzz surrounding Hyperliquid, a DEX providing 24/7 access to Oil futures trading, is fading amid US-Iran efforts to reach a peace deal. Santiment data shows Hyperliquid’s social dominance is down to 0.137% from the March 30 spike of 0.688% seen during the peak of the US-Iran conflict.
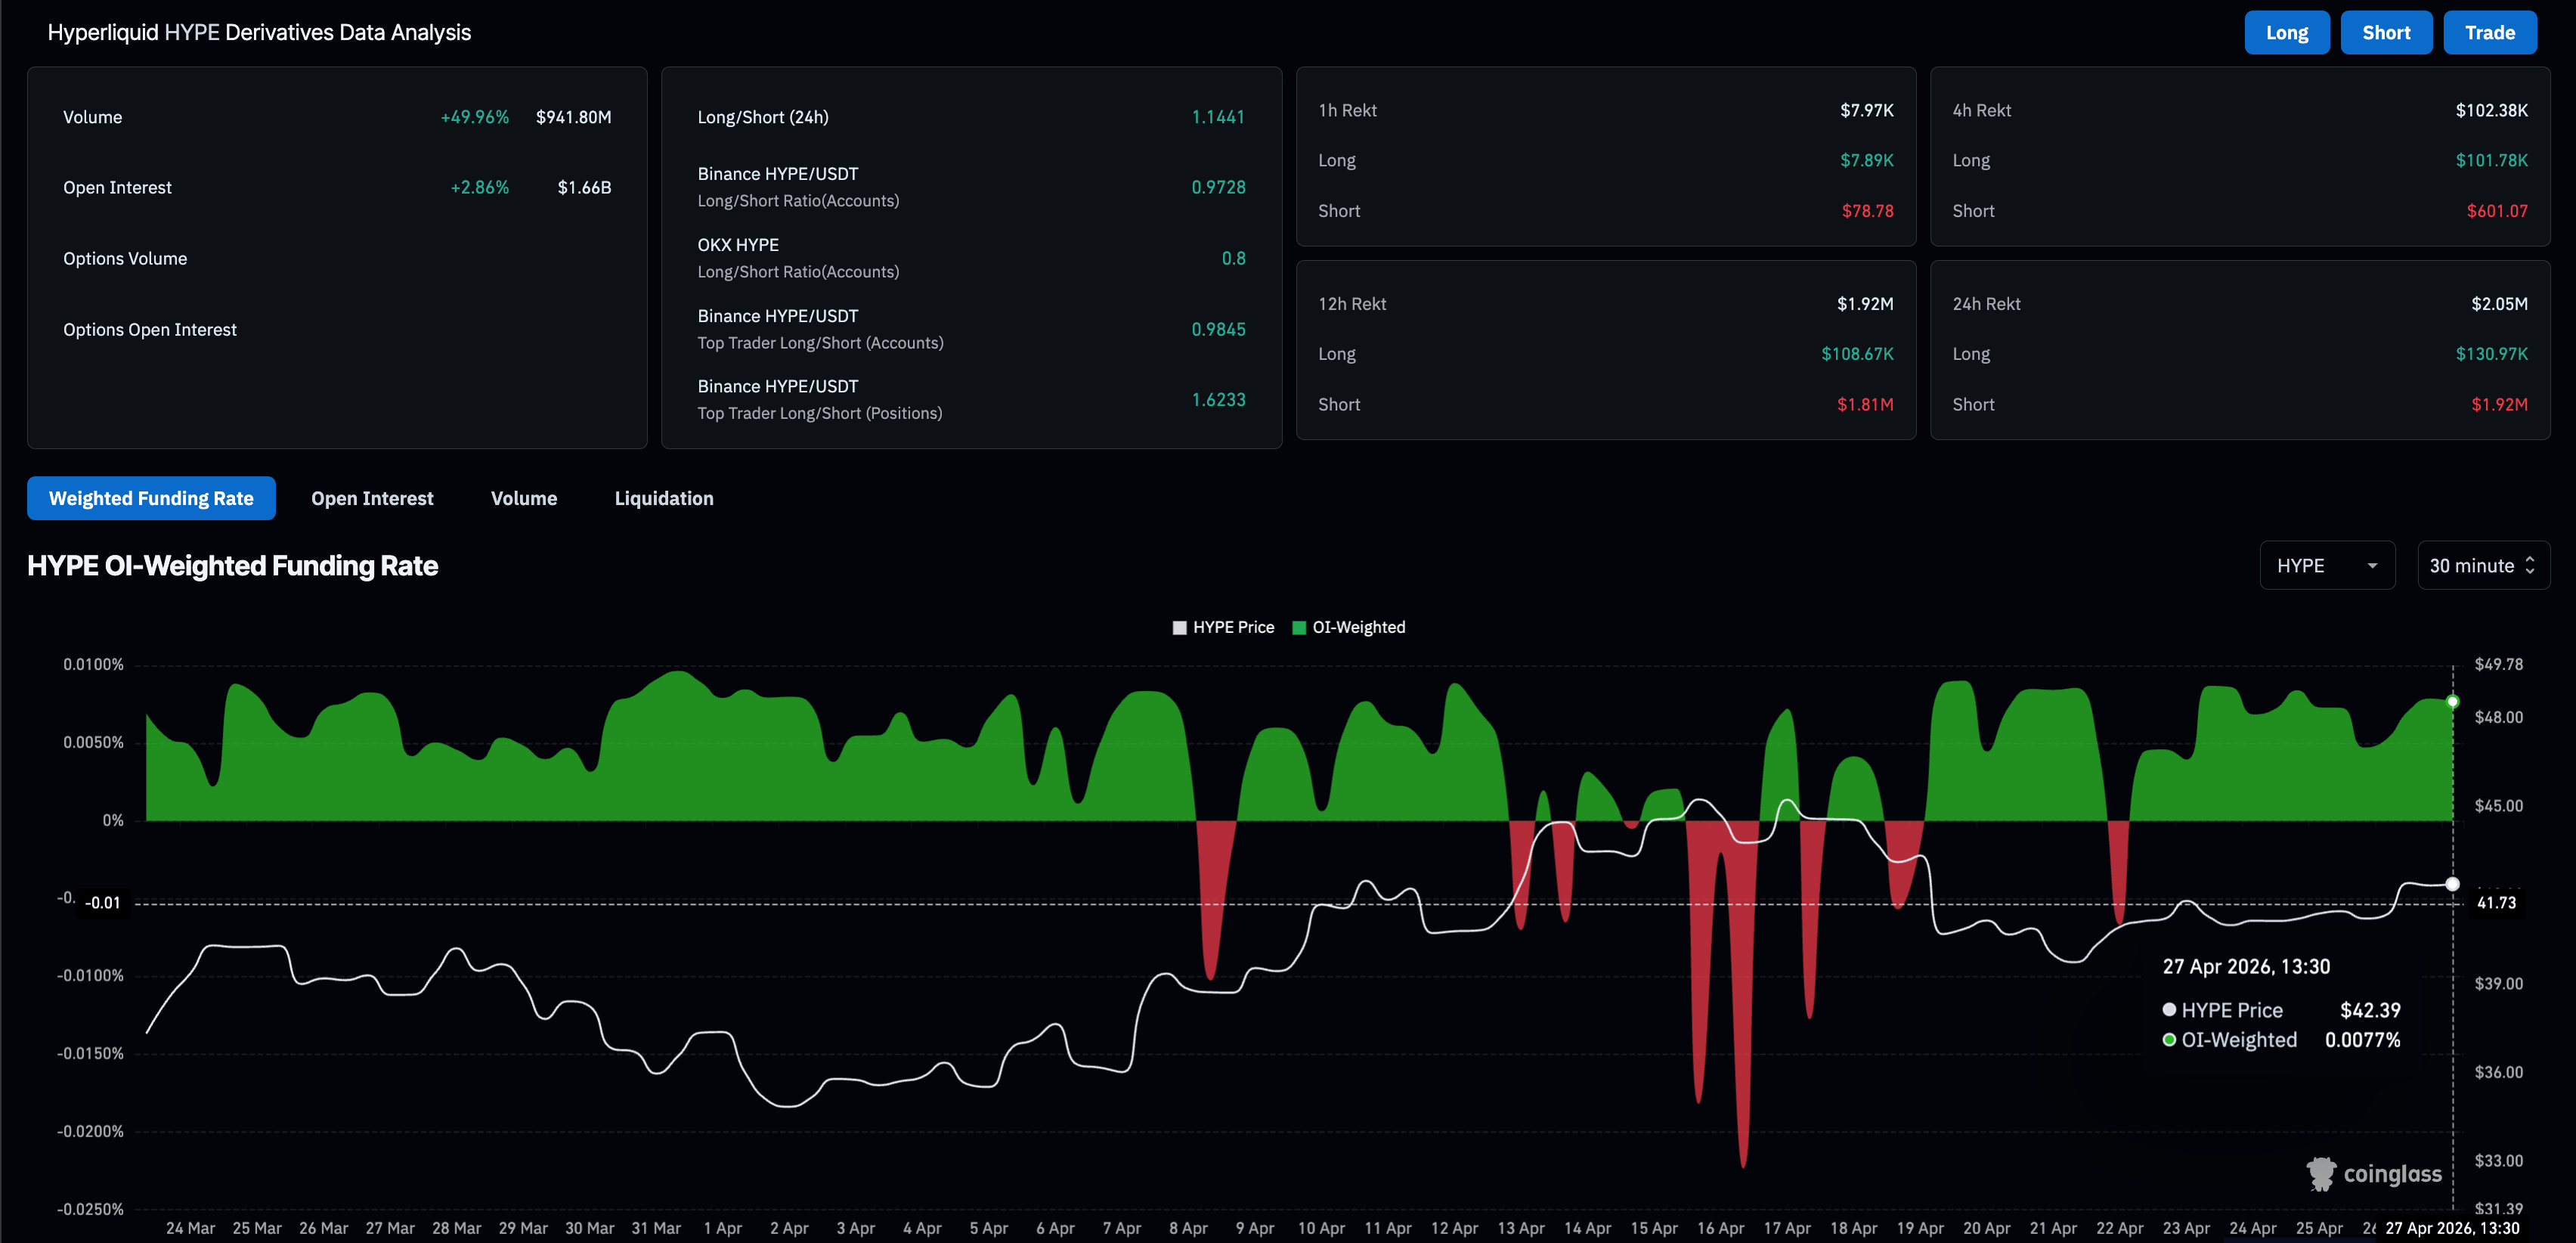
On the derivatives side, short-term positional buildup is seen in the HYPE futures market as Open Interest (OI) and funding rates surge. CoinGlass data shows the HYPE OI is up roughly 3% over the last 24 hours, reaching $1.66 billion, indicating a rise in the notional value of outstanding HYPE contracts.
Meanwhile, the funding rate stands at 0.0077%, which has remained mostly positive over the last month, reflecting traders' leverage-linked bullish interest.
Technical outlook: Will HYPE sustain above $40?
Hyperliquid recovery contracts between two converging trendlines on the daily chart, which form a rising wedge pattern. HYPE extends above the 50-day and 200-day Exponential Moving Averages (EMAs) at $38.98 and $34.90, respectively.
The Relative Strength Index (RSI) is at 57 on the daily chart, reflecting a positive but not overbought momentum. Meanwhile, the Moving Average Convergence Divergence (MACD) is rising toward the signal line, indicating the downside momentum is waning.
The R1 Pivot Point at $43.71 caps the short-term recovery in HYPE from the support trendline, serving as the immediate resistance and guarding the overhead trendline near $46.80.
Hyperliquid remains above the rising trendline support at around $41.21, suggesting the broader uptrend is intact. A close below this level would expose the 50-day EMA at $38.98, with the 200-day EMA at $34.90 reinforcing a deeper but still important demand zone if a larger pullback unfolds.
(The technical analysis of this story was written with the help of an AI tool.)














