

Pi Network Price Forecast: PI remains capped as breakout move lacks bullish steam
- Pi Network hovers above $0.1350 on Tuesday, struggling to extend an impulse move after breaking a key resistance trendline.
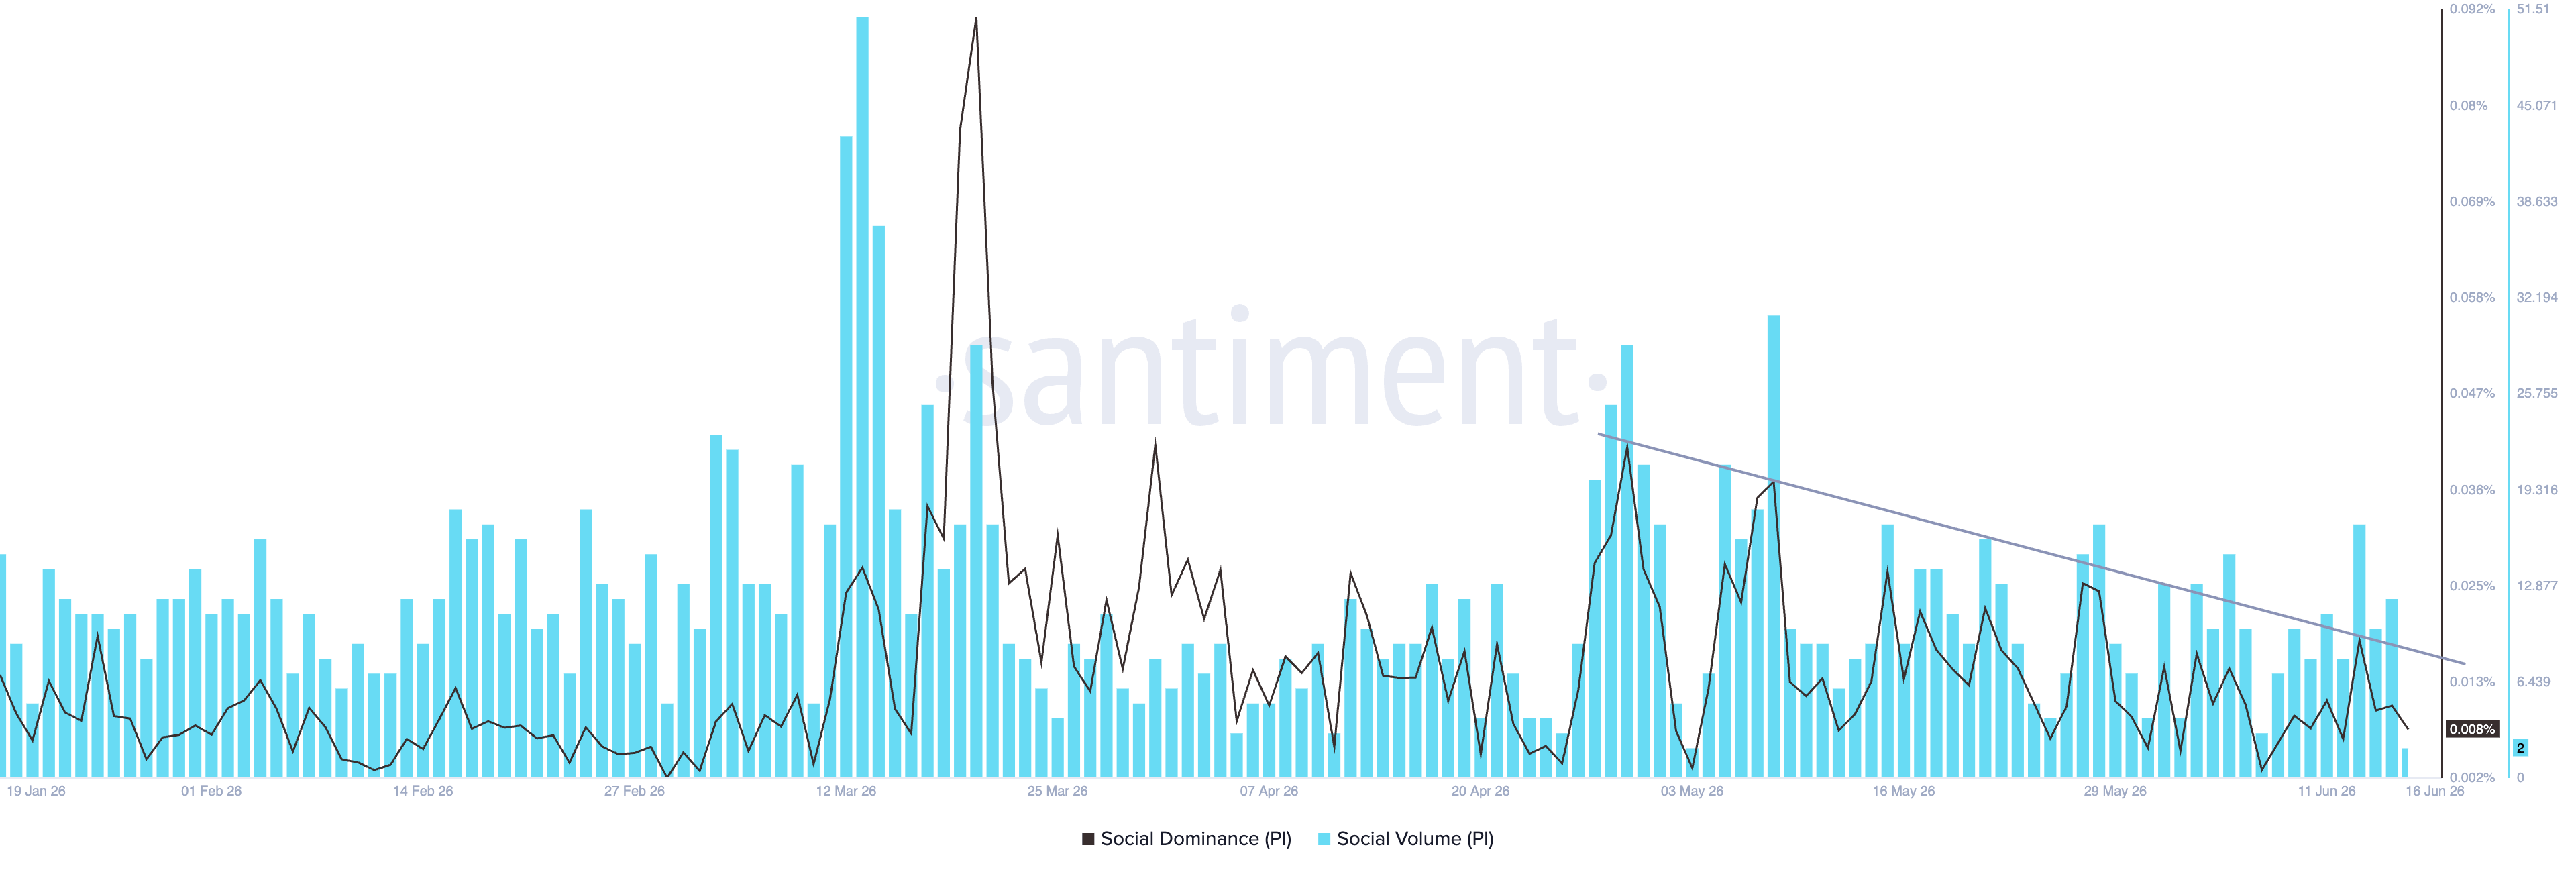
- Retail interest in PI remains low, as social dominance continues to decline, suggesting little fuel for a breakout rally.
- The technical outlook for PI is mixed as the trendline breakout remains capped by declining EMAs.
Pi Network (PI) holds above $0.1350 at press time on Tuesday, sustaining its 5% rebound gains from Saturday. The mild recovery so far this week, amid declining social dominance, reflects a lack of conviction among buyers to push the trendline breakout.

Pi Network’s muted social interest
Pi Network struggles to regain social momentum, which is typically linked to fueling its short-term recovery moves. Santiment data shows a clear downtrend in the social dominance peaks since early May, down to 0.007% on Tuesday. Muted retail interest in PI reduces its upside potential, risking a throwback to the broken trendline.
Technical outlook: Will Pi Network regain momentum?
Pi Network edges lower on Tuesday, maintaining a broader bearish phase as it remains below the 50-, 100-, and 200-day Exponential Moving Averages (EMAs) at $0.1483, $0.1620, and $0.2008, respectively. The stack of EMAs overhead reinforces a downside bias, even as the Moving Average Convergence Divergence (MACD) has crossed above its signal line and the Relative Strength Index (RSI) at 44 shows recovery toward the midline, hinting more at consolidation than a sustained bullish reversal.
On the topside, initial resistance is near the 50-day EMA at roughly $0.1483, followed by a more substantial supply zone around the 100-day EMA at $0.1620.
Looking down, a pullback below $0.1300 would nullify the trendline breakout rally, risking a steeper decline toward the June 6 low of $0.1184.
(The technical analysis of this story was written with the help of an AI tool.)














