

Solana Price Forecast: Mixed market sentiment caps recovery
- Solana price stabilizes at $79 on Friday after correcting by over 9% so far this week.
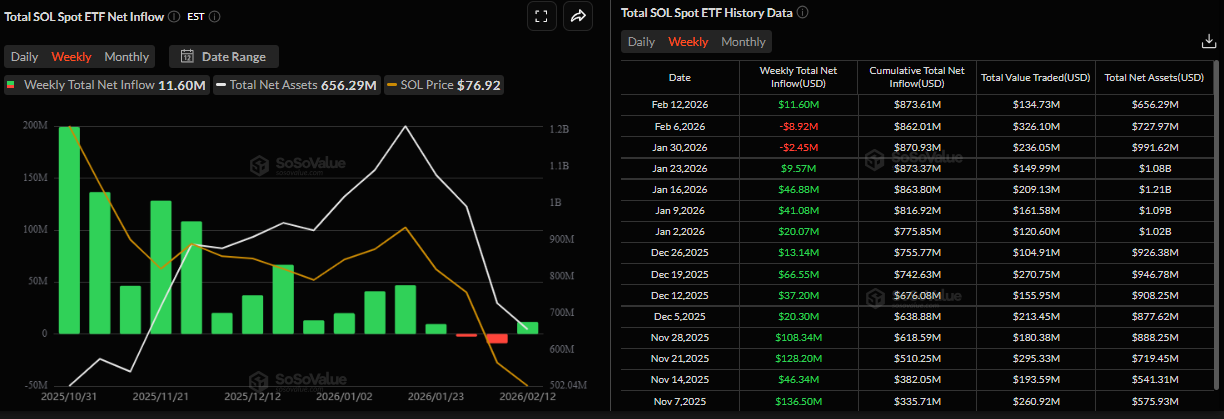
- US-listed spot SOL ETFs recorded inflows of $11.60 million through Thursday, breaking two consecutive weeks of withdrawals.
- Derivatives data indicates a cautious outlook, as funding rates turn negative alongside falling open interest.
Solana (SOL) is trading at $79 as of Friday, following a correction of over 9% so far this week. On-chain and derivatives data indicates mixed sentiment among traders, further limiting the chances of a price recovery.

Diverging indicators restrain Solana’s recovery
Institutional demand for Solana returns this week. SoSoValue data shows that Solana spot Exchange Traded Funds (ETFs) recorded inflows of $11.60 million through Thursday, ending two consecutive weeks of withdrawals. If this trend continues and intensifies, SOL price could recover in the upcoming days.
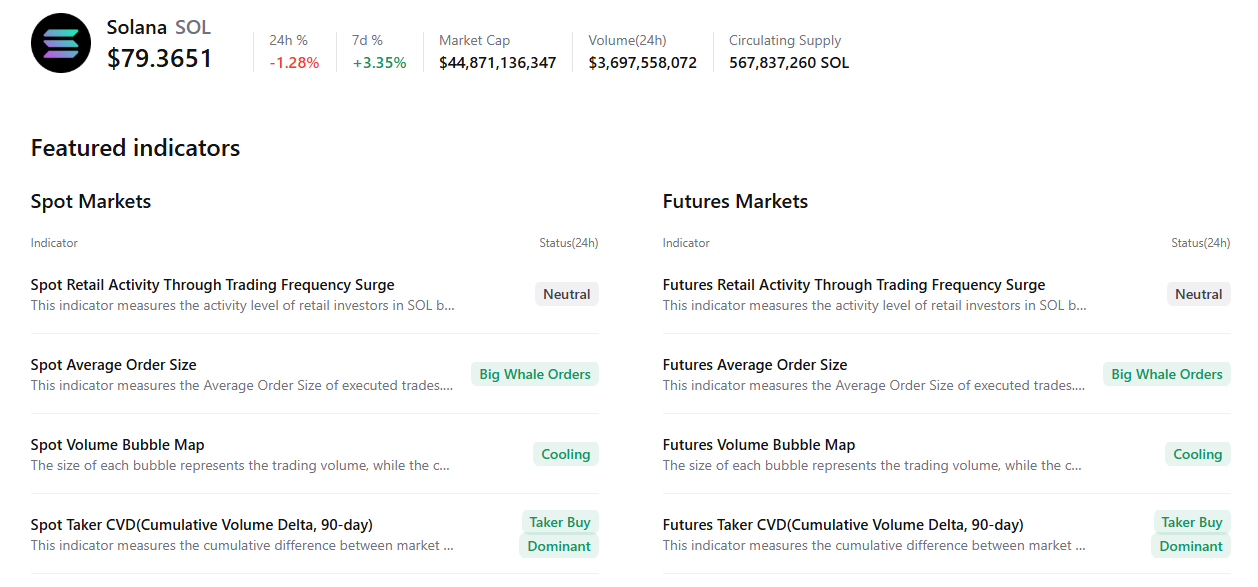
In addition to positive flows, CryptoQuant’s summary data indicates a positive outlook, despite ongoing price weakness. SOL spot and futures market show large whale orders, cooling conditions, and buy dominance, hinting at a potential recovery.
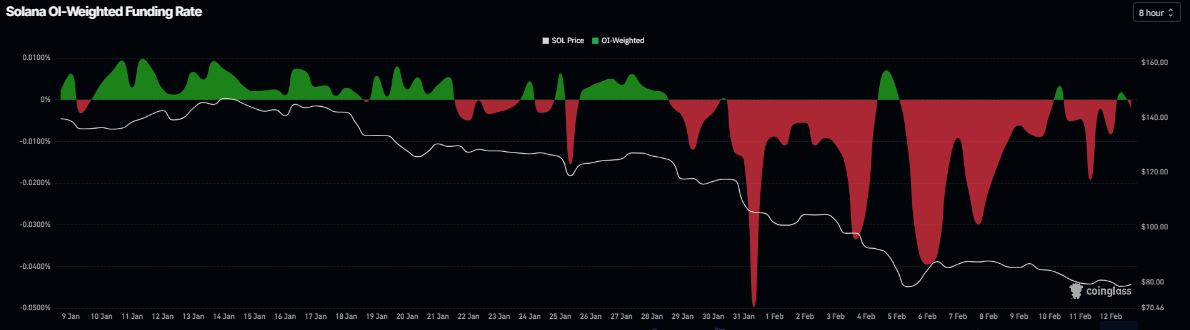
However, derivatives markets signal caution among traders. CoinGlass data shows SOL’s funding rate flipped negative on Friday, reading -0.0014%, indicating that short positions are paying longs and hinting at a bearish sentiment.
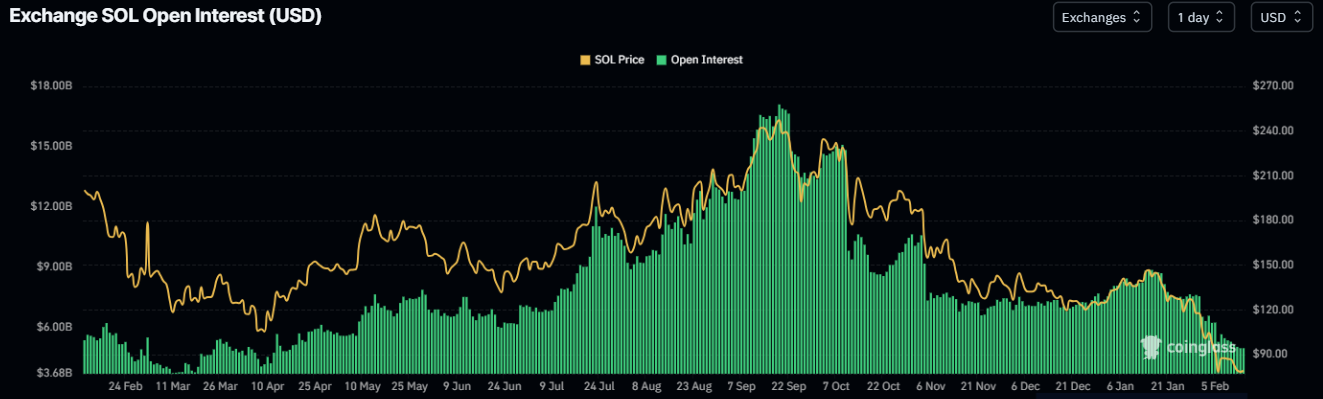
In addition, Solana’s open interest fell to $4.96 billion on Friday, down steadily since mid-January and reaching levels not seen since mid-April 2025. This drop in OI reflects waning investor participation and projects a bearish outlook.
These divergences highlight growing uncertainty among traders and weaken bullish conviction, capping Solana’s recovery.
Solana Price Forecast: SOL bears aiming for the $60 mark
Solana’s price extended its correction this week, falling nearly 9% after an 8.62% decline in the previous week. As of writing on Friday, Solana is trading at $79.04.
If Solana continues its downward spiral, it could extend the decline toward the February 6 low of $67.50. A close below this could extend further losses toward the next key psychological level at $60.
The Relative Strength Index (RSI) on the daily chart reads 26, an extreme oversold condition, indicating strong bearish momentum. The Moving Average Convergence Divergence (MACD) also showed a bearish crossover on January 19, which remains intact with rising red histogram bars below the neutral level, further supporting the negative outlook.
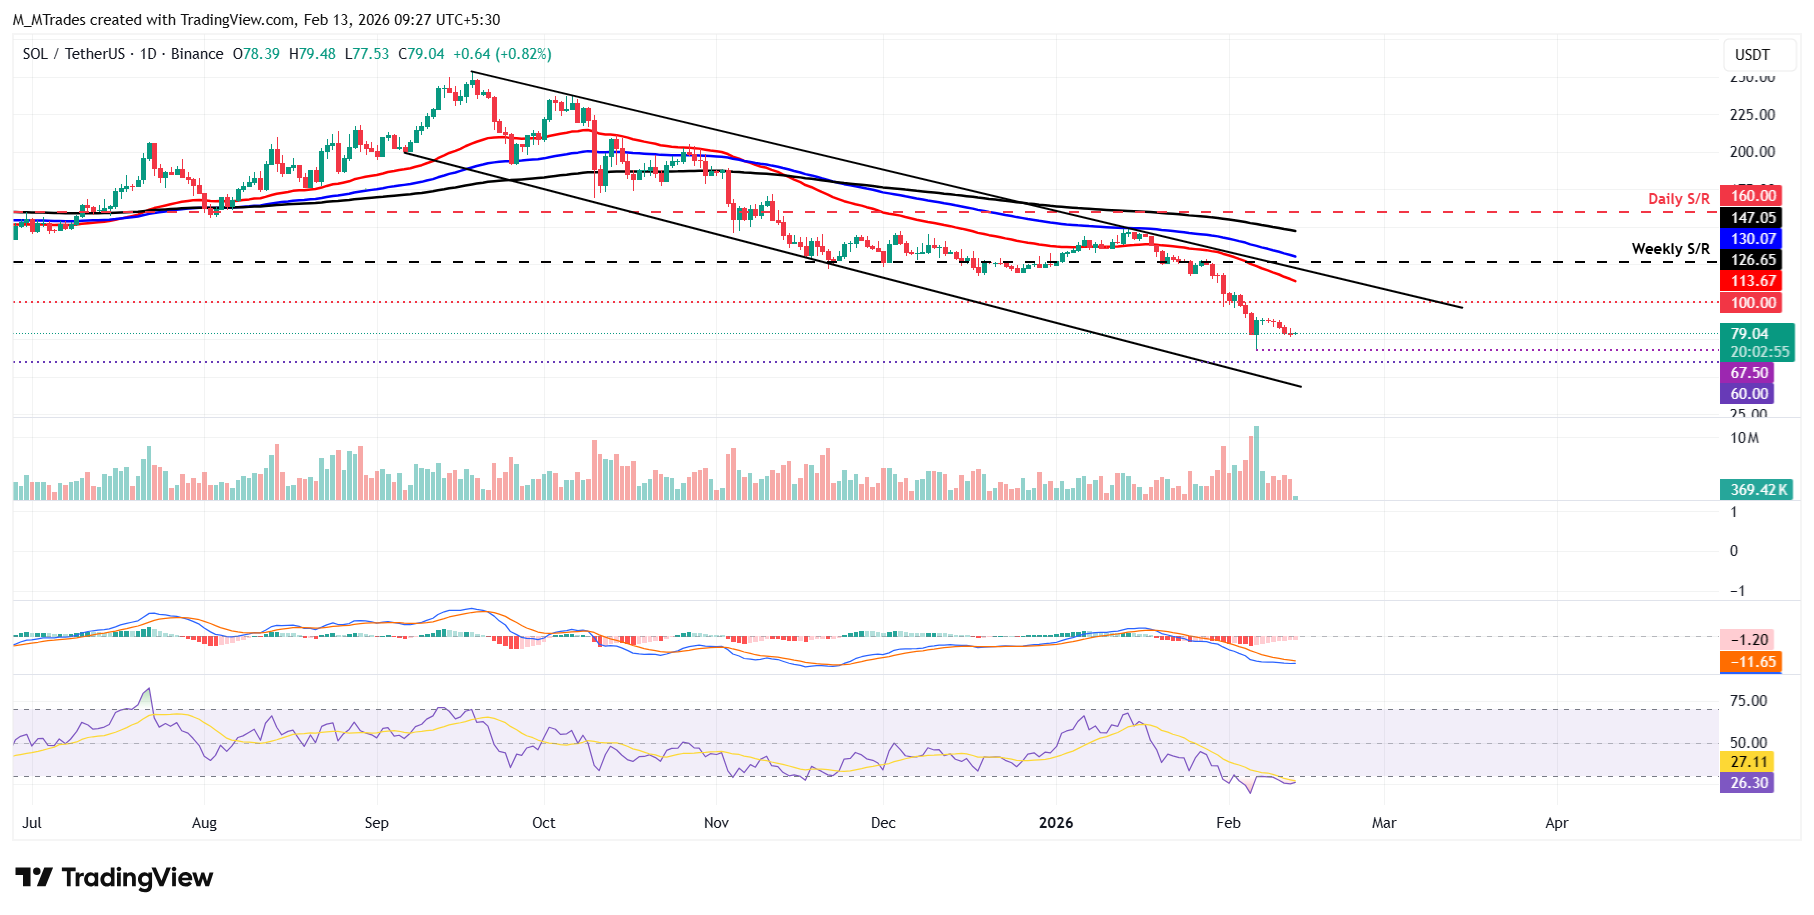
However, if SOL recovers, it could extend the advance toward the key psychological level at $80.














