

Zcash Price Forecast: ZEC maintains bullish structure above key retracement support
- Zcash edges higher on Friday, holding above $500 after an 8% drop the previous day.
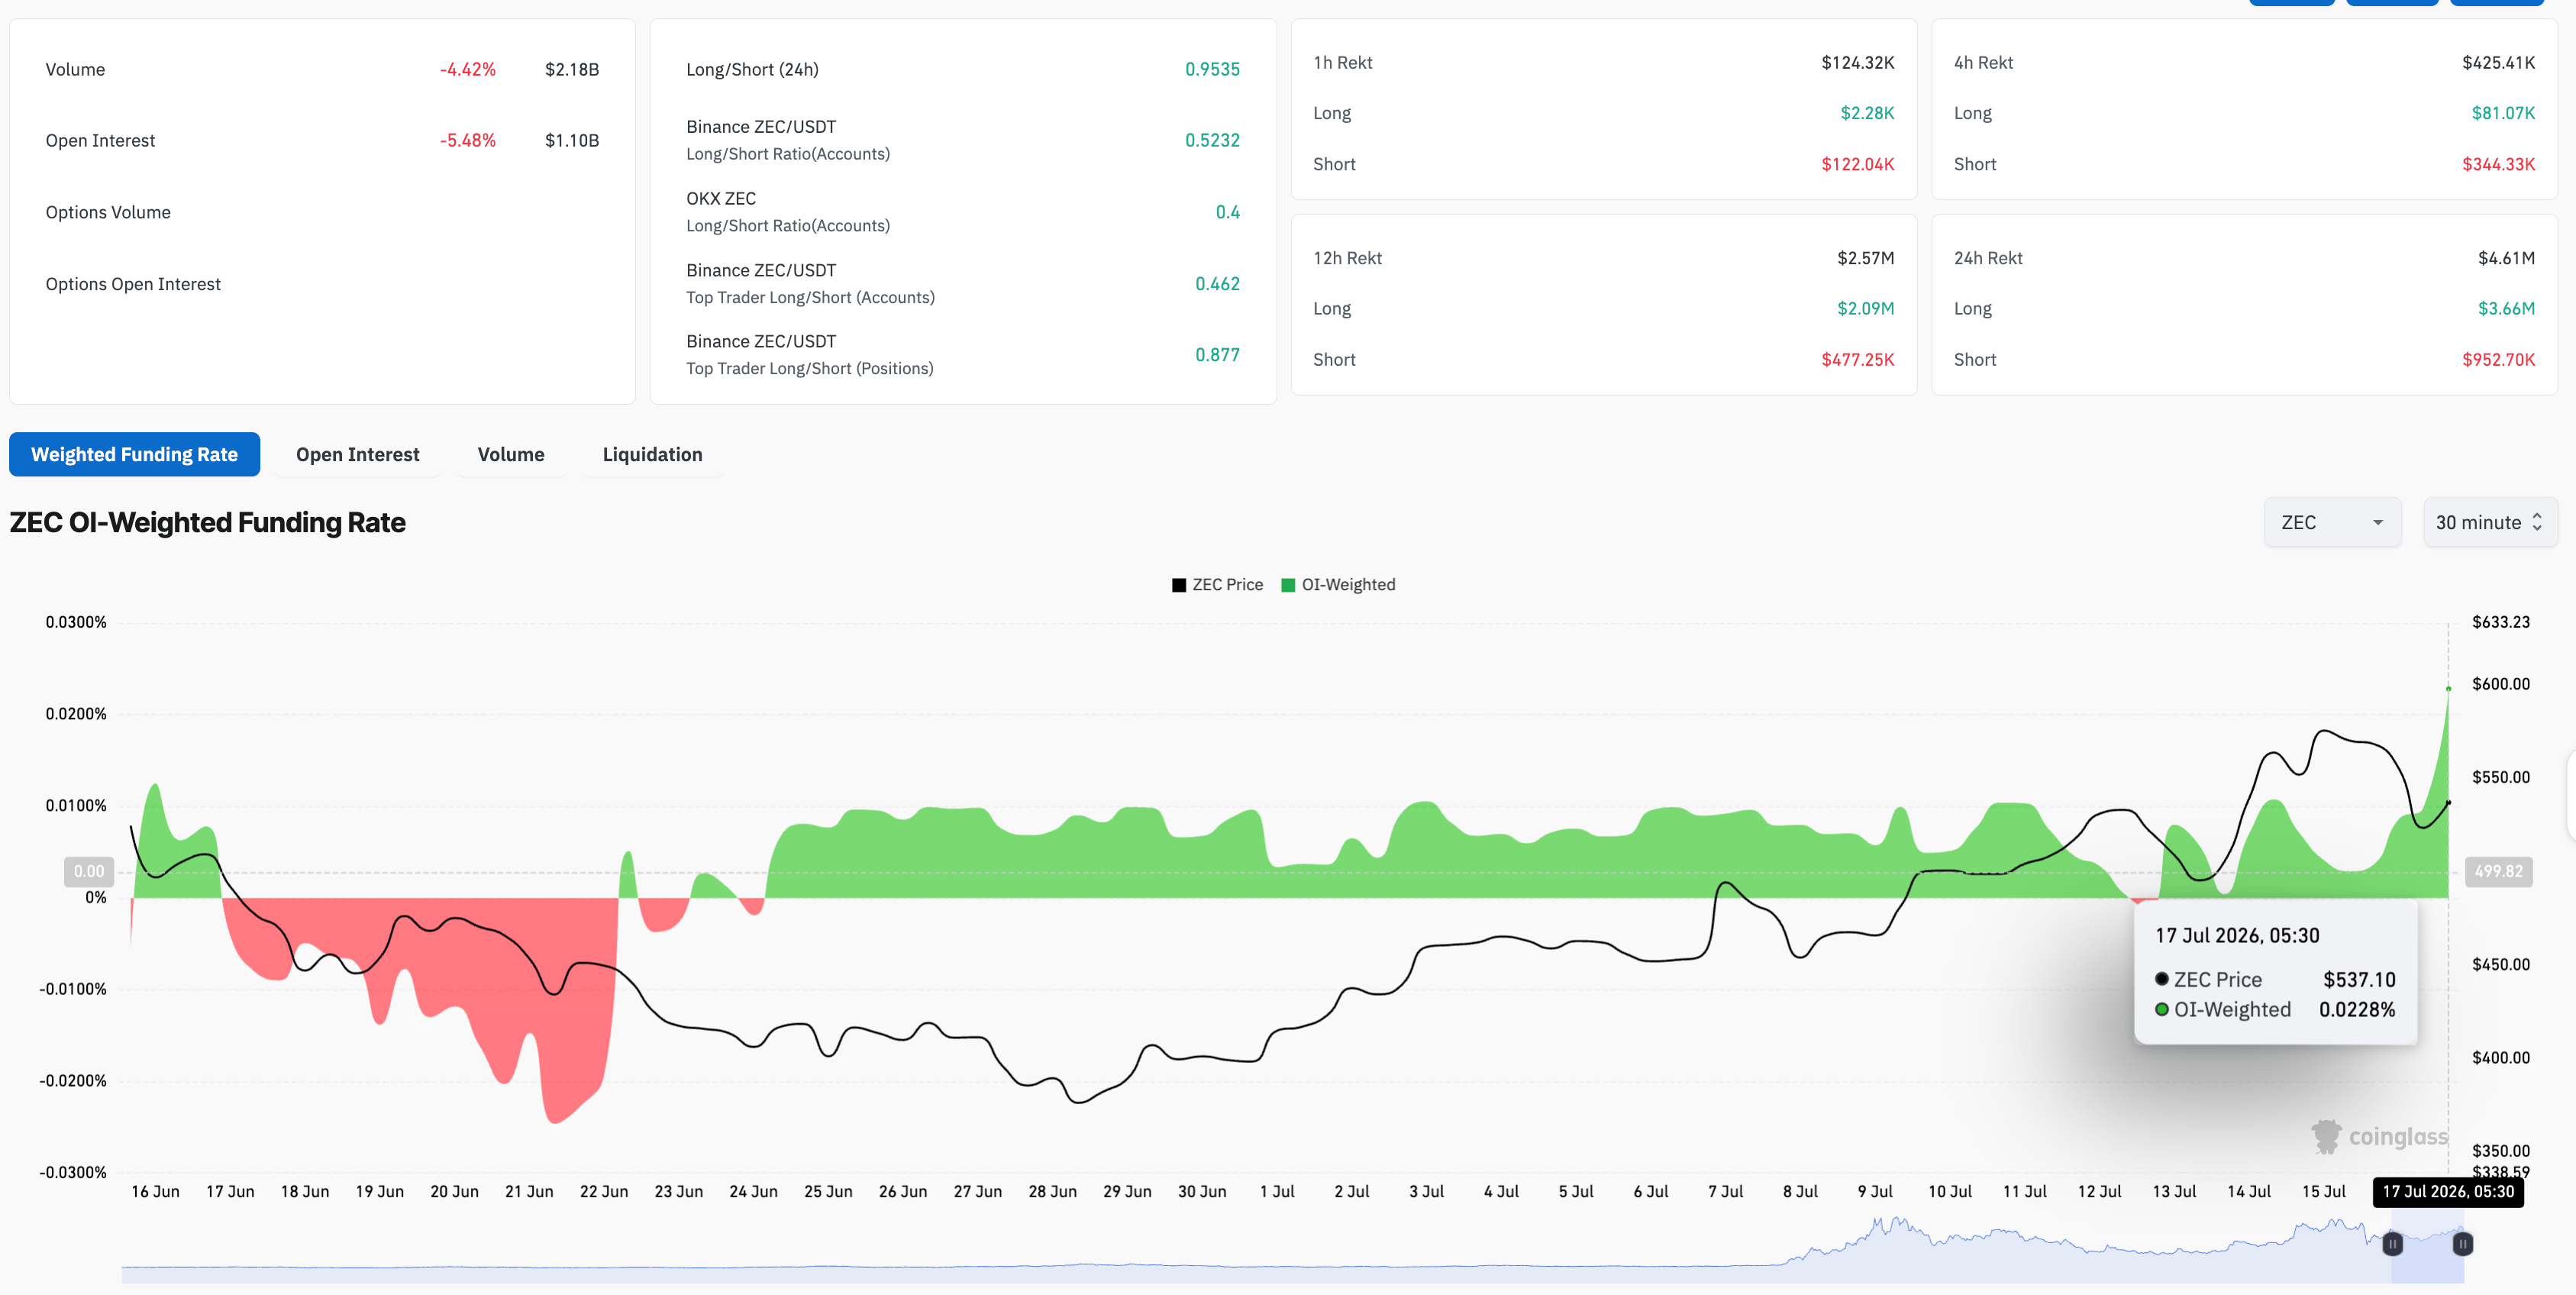
- Derivatives data indicates mixed retail sentiment, with Open Interest contracts contracting, while a positive funding rate spike suggests bullish demand.
- The technical outlook for Zcash is bullish, as the structural uptrend remains intact above a key retracement support level.
Zcash (ZEC) is up over 2% on Friday, recovering from an 8% decline the previous day. The privacy coin maintains its retail strength with a rising funding rate despite a minor contraction in ZEC futures Open Interest. Technically, ZEC retains a structural upward trend above its crucial moving averages with an upside toward $690.

Retail support holds amid minor pullback
CoinGlass data shows the ZEC futures Open Interest (OI) dropped over 5% in the last 24 hours to $1.10 billion, reflecting a contraction in active perpetual contracts, which aligns with Thursday’s pullback. However, the surge in funding rate to 0.0228%, from 0.0100% the previous day, reflects a buy-the-dip approach among traders.
Will ZEC extend gains?
Zcash holds a bullish near-term bias above its 50-day Exponential Moving Average (EMA) at $476 and the 200-day EMA at $390. At the time of writing, ZEC is up 2% on Friday from its 78.6% Fibonacci retracement level at $520, measured over the $690 to $184 downswing, which reinforces a supported trend structure.
A steady upward trend could target the previous swing high of $690, and a breakout could extend the rally to the 127.2% Fibonacci extension at $987.
Momentum is constructive, with the Relative Strength Index (RSI) hovering near 58 with more upside before reaching the overbought levels. At the same time, the Moving Average Convergence Divergence (MACD) is rising into positive territory alongside its signal line, suggesting that buyers retain control.
On the downside, initial support is aligned with the 78.6% Fibonacci retracement at $520, where a deeper pullback could attract dip-buying interest near the 50-day EMA at $476.
(The technical analysis of this story was written with the help of an AI tool. Know more.)














