
Bitcoin Price Forecast: BTC stages cautious recovery following Trump’s State of the Union address
Bởi Manish Chhetri
Ngày xuất bản: 25 Feb 2026 | Ngày chỉnh sửa: 25 Feb 2026


BÀI VIẾT PHỔ BIẾN

Bitcoin (BTC) is attempting a cautious recovery as it approaches the previously broken lower consolidation boundary around $66,000 at the time of writing on Thursday. Institutional demand shows mild signs of recovery, as spot Bitcoin Exchange Traded Funds (ETFs) recorded inflows on Tuesday.
- Bitcoin price approaches the previously broken lower consolidation boundary, rejection suggests a downside target below $60,000.
- US-listed spot ETFs attracted over $257 million on Tuesday, the largest single-day inflow since February 6.
- Tensions between the US and Iran ahead of the third round of nuclear talks on Thursday could bring fresh volatility toward BTC.
Bitcoin (BTC) is attempting a cautious recovery as it approaches the previously broken lower consolidation boundary around $66,000 at the time of writing on Thursday. Institutional demand shows mild signs of recovery, as spot Bitcoin Exchange Traded Funds (ETFs) recorded inflows on Tuesday. Meanwhile, rising geopolitical tensions between the US and Iran ahead of renewed nuclear talks on Thursday could trigger volatility for the Crypto King.
Bitcoin optimism soars in tandem with Trump’s speech
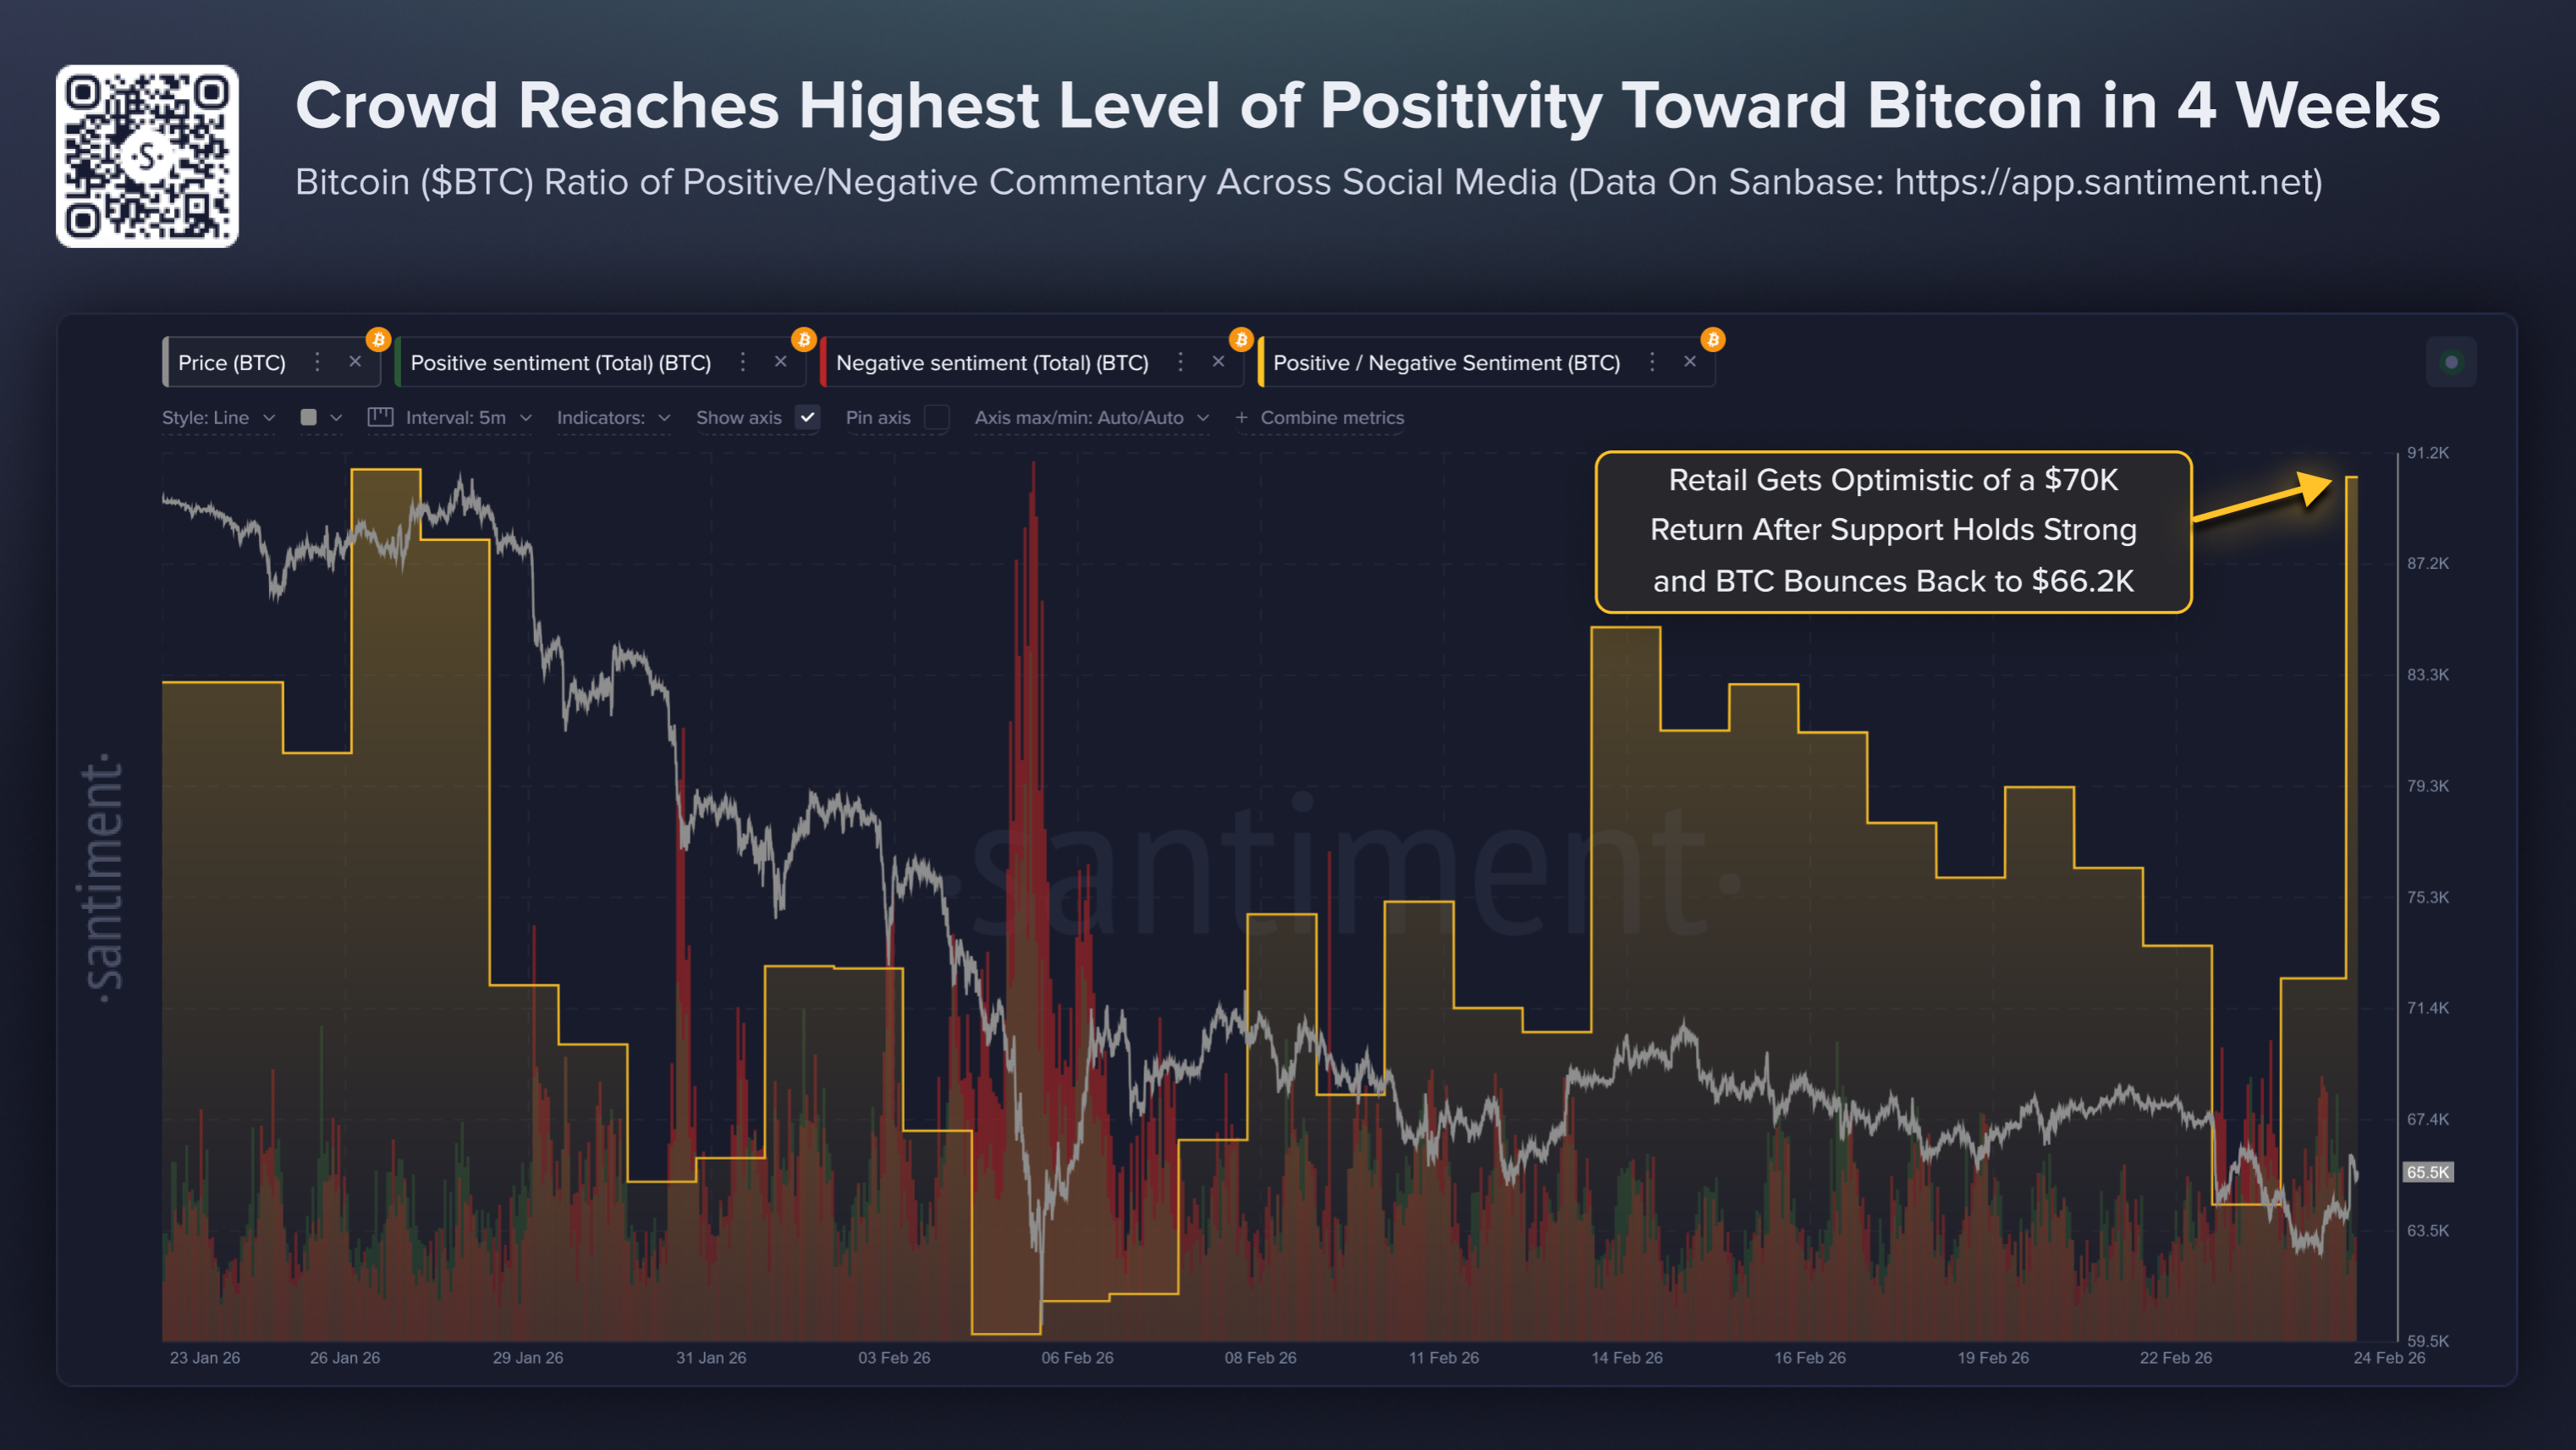
Bitcoin price recovers slightly, trading above $65,000 during the early European trading session on Wednesday. The Santiment chart below shows that the social commentary across X, Reddit, Telegram, and other platforms reaches the highest ratio of bullish vs. bearish comments in 4 weeks following President Trump’s State of the Union speech.
The analyst noted, “If retail Fear of missing out (FOMO) remains high, and there’s a consensus that ‘the bear cycle is ending, this can halt rallies due to the crowd’s consistent history of getting crypto’s price moves wrong.”
Tensions between the US and Iran cap Bitcoin recovery
Market participants are closely monitoring developments surrounding US-Iran tensions ahead of nuclear talks in Geneva on Thursday. The US embassy in Lebanon on Monday evacuated “dozens of its staff members” as a precaution amid anticipated regional developments, keeping a lid on risk-on sentiment.
Moreover, any signs of rising tensions between the US and Iran could further dampen the risk sentiment, prompting investors to move towards safe-haven assets such as Gold (XAU), while weighing on Bitcoin.
Defensive stance among perpetual trades
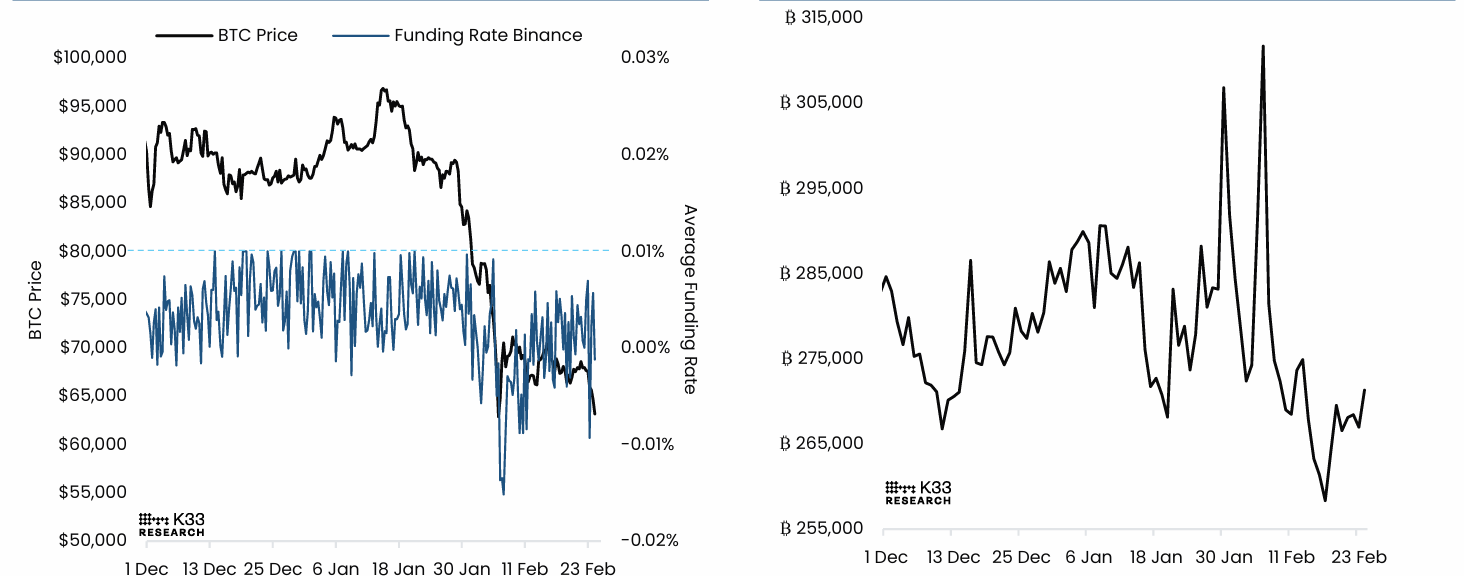
A K33 Research report on Tuesday highlighted that traders continue to move defensively in BTC perpetual markets.
The chart below shows that funding rates remain well below neutral levels and have turned deeply negative following BTC’s sharp decline on Monday morning.
The one-week average funding rate climbed to positive territory at 1.95% on Tuesday, while the 30-day average funding rate of 0.78% is the lowest since September 2024.
Amid subdued funding, exposure has remained limited, with open interest hovering near 270,000 BTC, signaling continued reluctance to add leveraged BTC exposure.
“The current perp regime points to a low risk of sudden squeezes, but the historically volatile nature of open interest suggests that this regime may shift quickly,” concluded the K33 analyst.
Bitcoin Price Forecast: BTC tests technical pattern with downside target below $60,000
The Crypto King price on the 4-hour chart is retesting a previously broken lower consolidating range, trading at $65,500 as of writing on Wednesday. The near-term bias is cautiously bearish as price holds below the clustered 50- and 100-period Exponential Moving Averages (EMAs), which remain sloping lower and capping the upside.
The recent recovery from the $64,000 area lacks strong follow-through, with the Relative Strength Index (RSI) on the 4-hour chart hovering just below the 50 mark, suggesting only modest easing of prior bearish pressure.
The Moving Average Convergence Divergence (MACD) line has crossed back above its signal line, with a modestly positive histogram pointing to a rebound phase within a still-fragile broader downbeat structure.
Immediate resistance emerges near the $66,500 zone (lower consolidating boundary), where the 50-period EMA meets recent intraday highs, followed by stronger resistance at the $68,500 region, aligning with prior consolidation before the latest leg lower.
On the downside, initial support is seen around $63,000 (a key psychological level), guarding the path toward the horizontal line at $60,000, which marks a more substantial medium-term floor.
A sustained break above $68,500 would soften the bearish tone, with a recovery toward the upper consolidating boundary near $71,700, while a drop back through $63,000 would expose $60,000 first, then toward the technical target of $58,822.
-1772014567785-1772014567788.png)
(The technical analysis of this story was written with the help of an AI tool.)
Bitcoin, altcoins, stablecoins FAQs
Bitcoin is the largest cryptocurrency by market capitalization, a virtual currency designed to serve as money. This form of payment cannot be controlled by any one person, group, or entity, which eliminates the need for third-party participation during financial transactions.
Altcoins are any cryptocurrency apart from Bitcoin, but some also regard Ethereum as a non-altcoin because it is from these two cryptocurrencies that forking happens. If this is true, then Litecoin is the first altcoin, forked from the Bitcoin protocol and, therefore, an “improved” version of it.
Stablecoins are cryptocurrencies designed to have a stable price, with their value backed by a reserve of the asset it represents. To achieve this, the value of any one stablecoin is pegged to a commodity or financial instrument, such as the US Dollar (USD), with its supply regulated by an algorithm or demand. The main goal of stablecoins is to provide an on/off-ramp for investors willing to trade and invest in cryptocurrencies. Stablecoins also allow investors to store value since cryptocurrencies, in general, are subject to volatility.
Bitcoin dominance is the ratio of Bitcoin's market capitalization to the total market capitalization of all cryptocurrencies combined. It provides a clear picture of Bitcoin’s interest among investors. A high BTC dominance typically happens before and during a bull run, in which investors resort to investing in relatively stable and high market capitalization cryptocurrency like Bitcoin. A drop in BTC dominance usually means that investors are moving their capital and/or profits to altcoins in a quest for higher returns, which usually triggers an explosion of altcoin rallies.

Acuity Trading là công ty fintech có trụ sở tại London, thành lập năm 2013, chuyên về dữ liệu thay thế và phân tích cảm xúc dựa trên AI cho giao dịch và đầu tư. Họ đã cách mạng hóa trải nghiệm giao dịch trực tuyến với các công cụ tin tức và cảm xúc trực quan, và hiện tiếp tục dẫn đầu thị trường với dữ liệu thay thế tạo alpha và các công cụ giao dịch tương tác cao dựa trên nghiên cứu AI mới nhất.
Đọc thêm


