
Bitcoin Weekly Forecast: BTC holds key support amid ETFs outflows
Bởi Manish Chhetri
Ngày xuất bản: 19 Dec 2025 | Ngày chỉnh sửa: 19 Dec 2025


BÀI VIẾT PHỔ BIẾN

Bitcoin (BTC) continues to consolidate after recent losses, holding around $87,000 on Friday. Weakening spot Exchange-Traded Funds (ETFs) demand continues to pressure the market, while Strategy adds another 10K BTC this week.
- Bitcoin price steadies around $88,000 on Friday, holding above a key support zone as the corrective phase persists.
- Institutional demand for Bitcoin weakens as spot ETFs record $338 million outflow by Thursday, while Strategy adds another 10K BTC to its holdings.
- US inflation came in softer than expected, boosting a slight risk-on sentiment that could help BTC's recovery.
Bitcoin (BTC) continues to consolidate after recent losses, holding around $87,000 on Friday. Weakening spot Exchange-Traded Funds (ETFs) demand continues to pressure the market, while Strategy adds another 10K BTC this week. Meanwhile, softer-than-expected US inflation could serve as a catalyst for a BTC rebound.
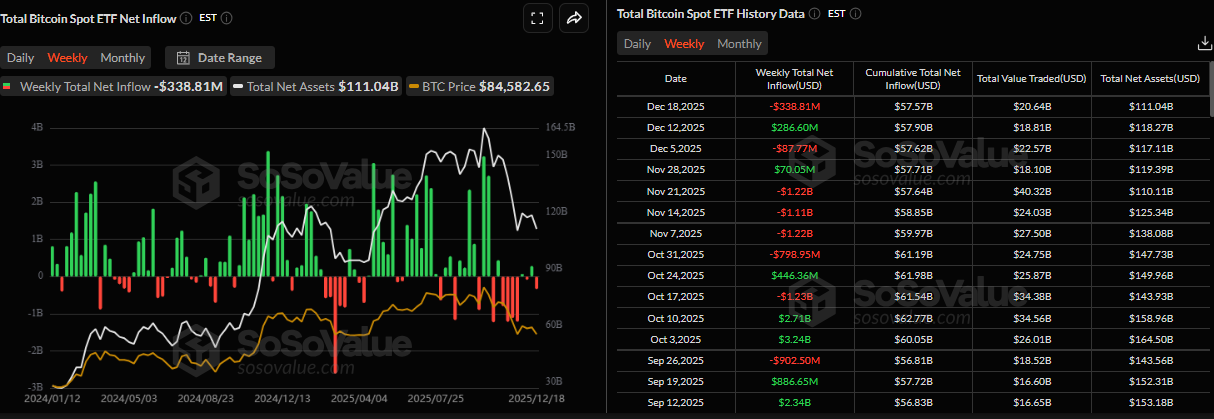
ETFs' outflows weigh on Bitcoin
Bitcoin price correction this week was supported by weakening institutional demand. SoSoValue data show that Spot Bitcoin ETFs recorded a net total outflow of $338.81 million by Thursday, marking the largest weekly outflow since November 21 and breaking the previous week’s streak of positive inflows. If these outflows continue and intensify, the Bitcoin price could see further correction.
However, on the corporate front, Strategy Executive Chairman Michael Saylor announced on Monday that his company, Strategy Inc. (MSTR), purchased 10,645 Bitcoin for $980 million. This purchase followed the previous week’s buy-in of 10,624 BTC, highlighting the firm’s continued aggressive accumulation strategy and long-term conviction in Bitcoin despite ongoing market weakness.

Soft US inflation data could boost BTC recovery
The US inflation report, measured by the Consumer Price Index (CPI), was released on Thursday and the headline figure came in at 2.7% year-on-year in November, below the expected 3.1%. Meanwhile, the core CPI, which excludes volatile food and energy prices, rose by 2.6%, missing the 3% expectations. This figure marks the slowest pace since 2021.
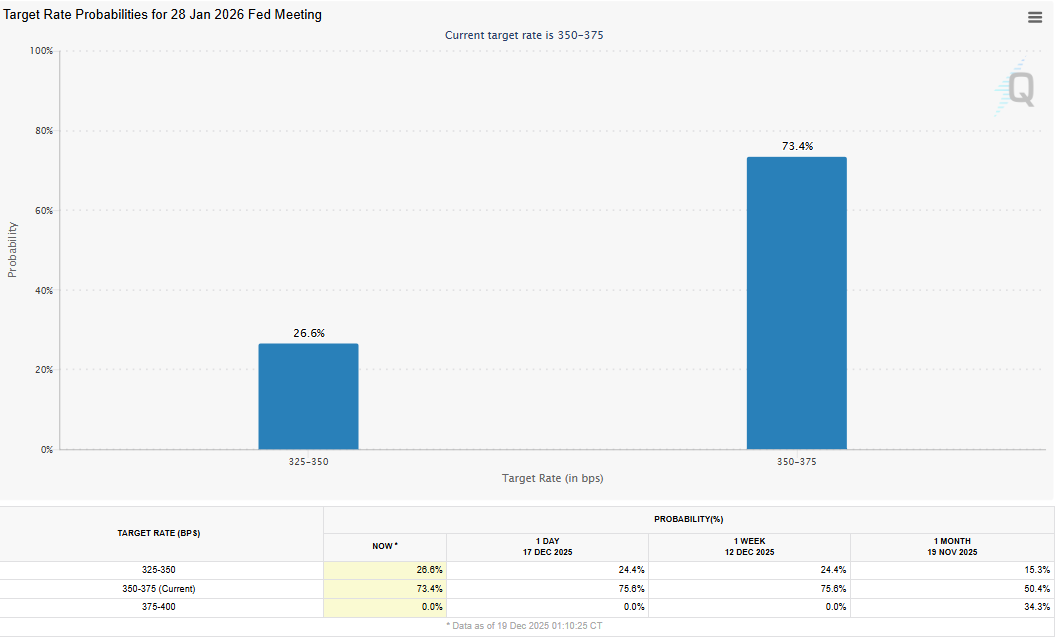
The softer-than-expected US CPI data has fueled speculation that the Federal Reserve (Fed) might cut interest rates sooner than previously expected.
Market participants are now pricing a 26.6% probability that the Fed will reduce interest rates by 25 basis points (bps) to the range of 3.25%-3.50% at its next meeting in January, according to the CME FedWatch tool. These macroeconomic conditions could trigger risk-on sentiment in markets, boosting riskier assets such as Bitcoin.
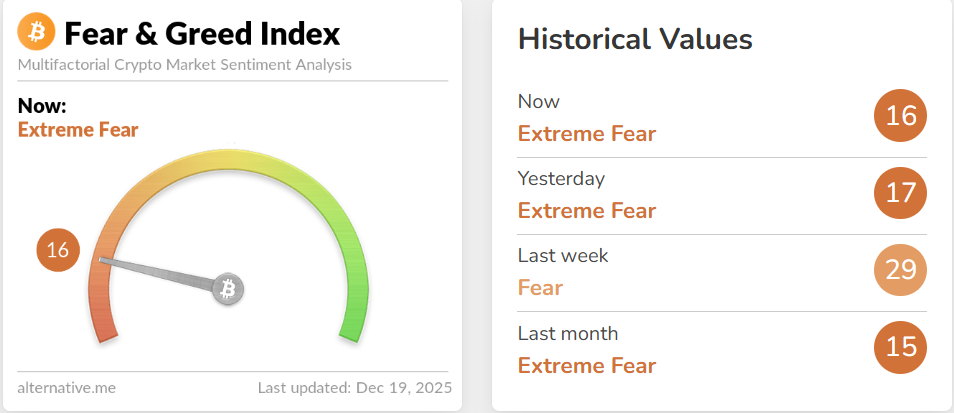
Extreme fear among BTC traders
The Fear and Greed Index fell to 16 on Friday from 29 the previous week, suggesting the crypto market is currently in a deep risk-off phase, in line with falling prices, ETF outflows, and weak momentum.
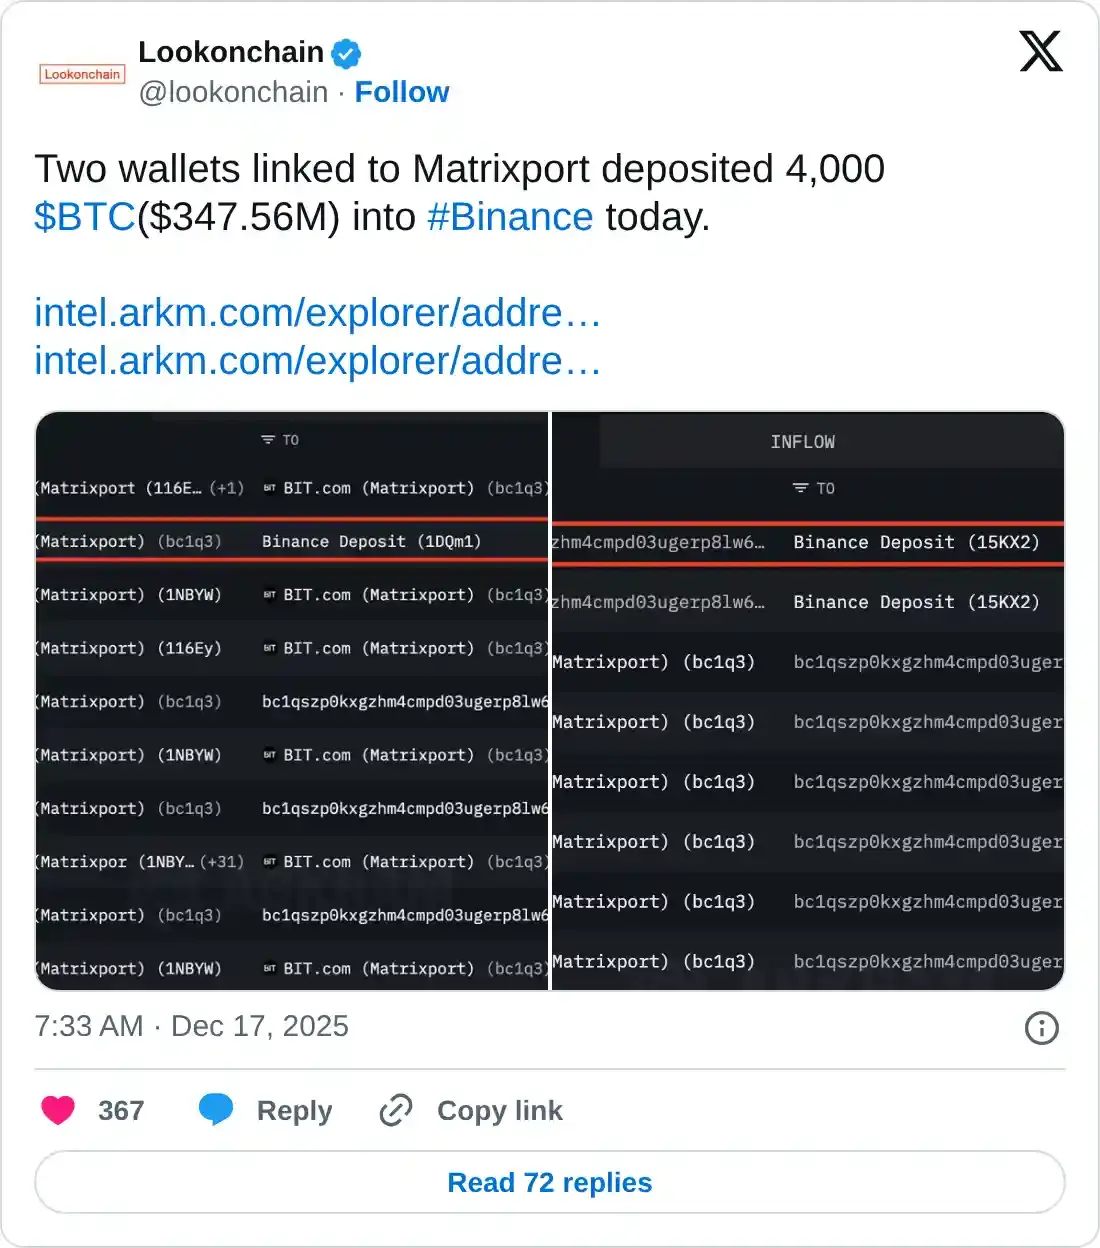
In addition, Lookonchain data indicate that two Matrixport-linked wallets deposited 4,000 BTC, valued at $347.56 million, into the Binance exchange on Wednesday. Traders should be cautious, as transferring such a large amount of Bitcoin to a centralized exchange often signals an intent to sell or distribute it, which can create bearish sentiment, as market participants anticipate increased supply.
Liquidity boost could support BTC recovery
Beyond mixed sentiment among institutional investors and extreme fear among traders, The Kobeissi Letter X post from Tuesday hints at signs of optimism for BTC.
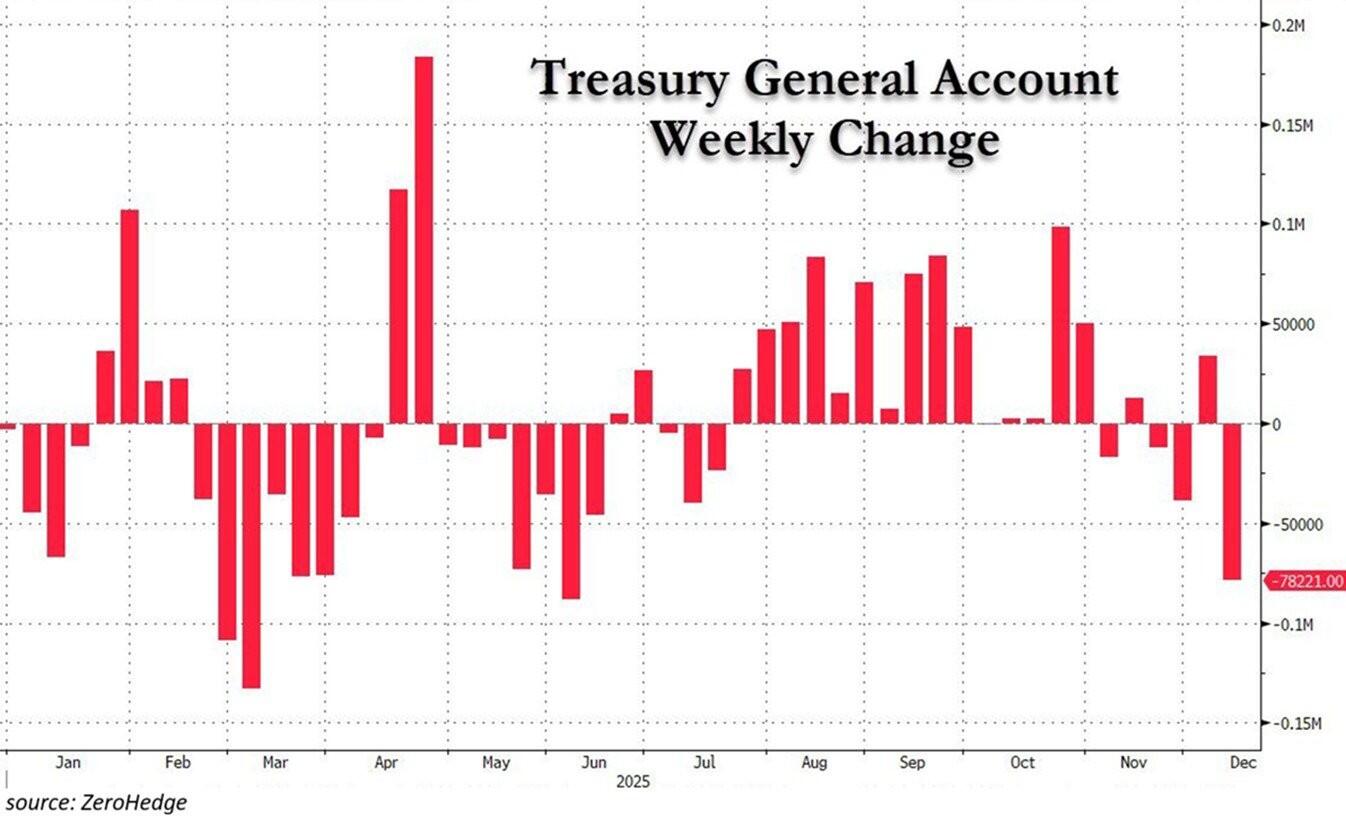
The report explained that the Treasury General Account (TGA) dropped to $78 billion over the last week, the largest liquidity injection since June, as shown in the chart below. The analyst noted that the TGA is the US government’s primary cash account at the Federal Reserve (Fed), and that when it declines, cash flows directly into the financial system, boosting liquidity.
Furthermore, the Federal Reserve is injecting $40 billion into the economy through bond purchases. It will reinvest $14.4 billion in principal payments from its Mortgage-Backed Securities (MBS) to purchase Treasury bills over the same period, thereby amplifying overall liquidity conditions.
This wave of net liquidity injection into financial markets will make borrowing cheaper and encourage risk-on sentiment, particularly in assets such as stocks and cryptocurrencies, providing near-term support for BTC.
Clarity Act to enter the US Senate in January
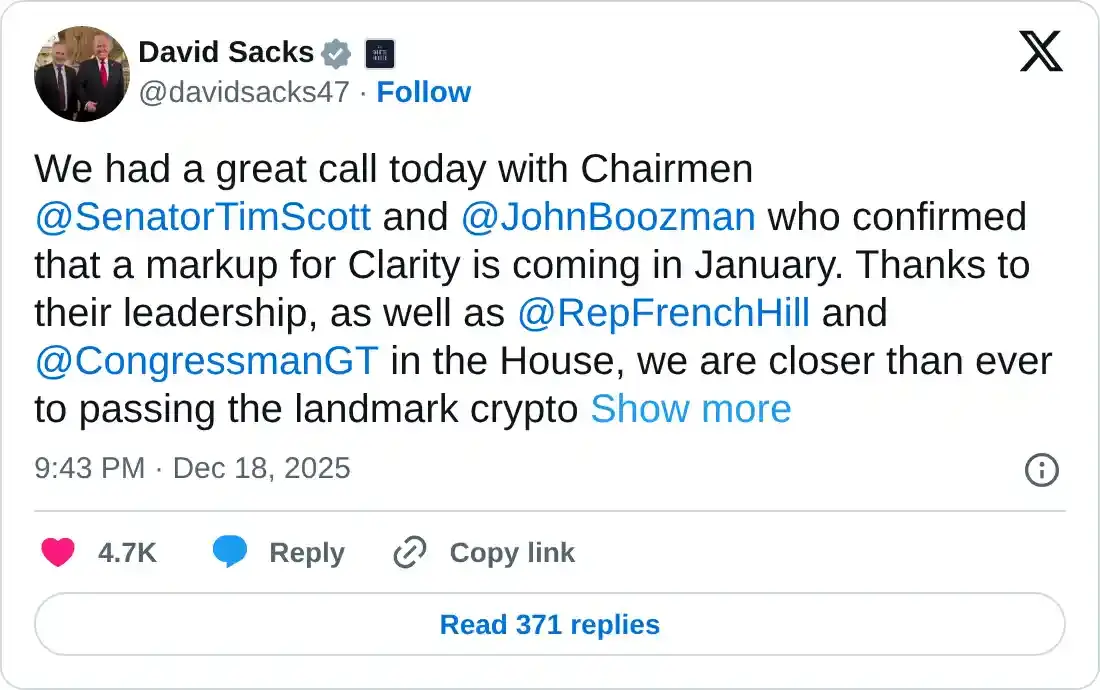
David Sacks, the White House AI and crypto adviser, posted on his X account on Friday that markup for the Clarity Act is coming in January.
Sacks continued, ‘We are closer than ever to passing the landmark crypto market structure legislation that President Trump has called for. We look forward to finishing the job in January!”
The Clarity Act is a regulatory framework for digital assets in the US that primarily clarifies the division of oversight between the Securities and Exchange Commission (SEC) and the Commodity Futures Trading Commission (CFTC).
If passed, the bill would be bullish for cryptocurrencies, as it moves the industry out of a legal gray area and into mainstream financial regulation, providing regulatory clarity, which could boost wider adoption and prices in the long term.
Is BTC out of the woods?
Bitcoin’s weekly chart shows the price finding support around the 100-week Exponential Moving Average (EMA) at $85,769, consolidating in this zone since the end of November. As of this week, BTC is trading at around $88,000.
If the 100-week EMA at $85,769 continues to hold, BTC could extend the rally toward the 50-week EMA at $98,581.
The Relative Strength Index (RSI) on the weekly chart is 37, still below the neutral level of 50, indicating that bears remain in control. However, the RSI is flattening around this level, signaling that selling pressure may be stabilizing and downside momentum is beginning to weaken.

On the daily chart, Bitcoin was rejected at the psychological $90,000 resistance on Monday but found support at the 78.6% Fibonacci retracement at $85,569, leading to consolidation between these levels so far this week. As of Friday, BTC is trading above $87,900, rebounding after retesting $85,569.
If BTC breaks and closes below $85,569 on a daily basis, it could extend the decline toward the psychological $80,000 level.
The Relative Strength Index (RSI) on the daily chart is at 43, below its neutral level of 50, indicating bearish momentum gaining traction. Moreover, the Moving Average Convergence Divergence (MACD) showed a bearish crossover on Wednesday, further supporting the bearish view.

Looking up, if BTC closes above the $90,000 resistance level, it could extend the recovery toward the next key resistance at $94,253.
Bitcoin, altcoins, stablecoins FAQs
Bitcoin is the largest cryptocurrency by market capitalization, a virtual currency designed to serve as money. This form of payment cannot be controlled by any one person, group, or entity, which eliminates the need for third-party participation during financial transactions.
Altcoins are any cryptocurrency apart from Bitcoin, but some also regard Ethereum as a non-altcoin because it is from these two cryptocurrencies that forking happens. If this is true, then Litecoin is the first altcoin, forked from the Bitcoin protocol and, therefore, an “improved” version of it.
Stablecoins are cryptocurrencies designed to have a stable price, with their value backed by a reserve of the asset it represents. To achieve this, the value of any one stablecoin is pegged to a commodity or financial instrument, such as the US Dollar (USD), with its supply regulated by an algorithm or demand. The main goal of stablecoins is to provide an on/off-ramp for investors willing to trade and invest in cryptocurrencies. Stablecoins also allow investors to store value since cryptocurrencies, in general, are subject to volatility.
Bitcoin dominance is the ratio of Bitcoin's market capitalization to the total market capitalization of all cryptocurrencies combined. It provides a clear picture of Bitcoin’s interest among investors. A high BTC dominance typically happens before and during a bull run, in which investors resort to investing in relatively stable and high market capitalization cryptocurrency like Bitcoin. A drop in BTC dominance usually means that investors are moving their capital and/or profits to altcoins in a quest for higher returns, which usually triggers an explosion of altcoin rallies.

Acuity Trading là công ty fintech có trụ sở tại London, thành lập năm 2013, chuyên về dữ liệu thay thế và phân tích cảm xúc dựa trên AI cho giao dịch và đầu tư. Họ đã cách mạng hóa trải nghiệm giao dịch trực tuyến với các công cụ tin tức và cảm xúc trực quan, và hiện tiếp tục dẫn đầu thị trường với dữ liệu thay thế tạo alpha và các công cụ giao dịch tương tác cao dựa trên nghiên cứu AI mới nhất.
Đọc thêm


