
Trade The World
Cardano Price Forecast: ADA bears regain control after rejection at key resistance
Bởi Manish Chhetri
Ngày xuất bản: 14 Oct 2025 | Ngày chỉnh sửa: 14 Oct 2025


POPULAR ARTICLES

Cardano (ADA) price edges down at around $0.715 at the time of writing on Tuesday after facing rejection from the key resistance level. The bearish sentiment is further supported by the negative Spot Taker CVD (Cumulative Volume Delta) and rising short bets among traders.
- Cardano price edges slightly down on Tuesday after revisiting its key resistance level at $0.734.
- On-chain and derivatives data suggest bearish sentiment, as Spot Taker CVD is negative and short bets are rising.
- Technical outlook indicates potential for a deeper correction, with bears eyeing the $0.646 support zone.
Cardano (ADA) price edges down at around $0.715 at the time of writing on Tuesday after facing rejection from the key resistance level. The bearish sentiment is further supported by the negative Spot Taker CVD (Cumulative Volume Delta) and rising short bets among traders. On the technical side, indicators suggest ADA may face a deeper correction ahead.
On-chain and derivatives show bearish bias
CryptoQuant’s Spot Taker CVD for Cardano is negative, and its value has been steadily falling since early October. This metric measures the cumulative difference between market buy and sell volumes over a three-month period. When the three-month CVD is positive, it suggests the Taker Buy Dominant Phase. A negative value, as it is currently happening, indicates the Taker Sell Dominant Phase.
 (3)-1760412364554-1760412364556.png)
Cardano Spot Taker CVD chart. Source: CryptoQuant
On the derivatives side, CoinGlass’s ADA long-to-short ratio, which stands at 0.81, is the lowest value in a month. This ratio, below one, reflects bearish sentiment in the markets, as more traders are betting on the asset price to fall.
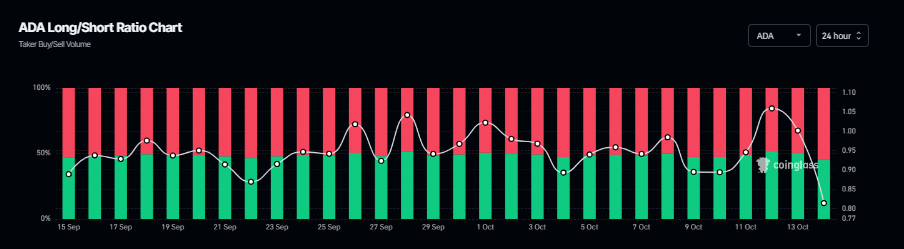
ADA long-to-short ratio chart. Source: Coinglass
Cardano Price Forecast: ADA bears tighten grip
Cardano price broke below the ascending trendline (drawn by connecting multiple lows since the end of June) on Friday and corrected by more than 22% that day. However, on Sunday, ADA recovered by 15% and continued into Monday, retesting the 61.8% Fibonacci retracement level at $0.734. At the time of writing on Tuesday, it trades slightly down, facing rejection from the $0.734 level.
If ADA continues its correction, it could extend the decline toward the next key support level at $0.646.
The Relative Strength Index (RSI) on the daily chart reads 40, below the neutral level of 50, indicating that the bears are in control of the momentum.
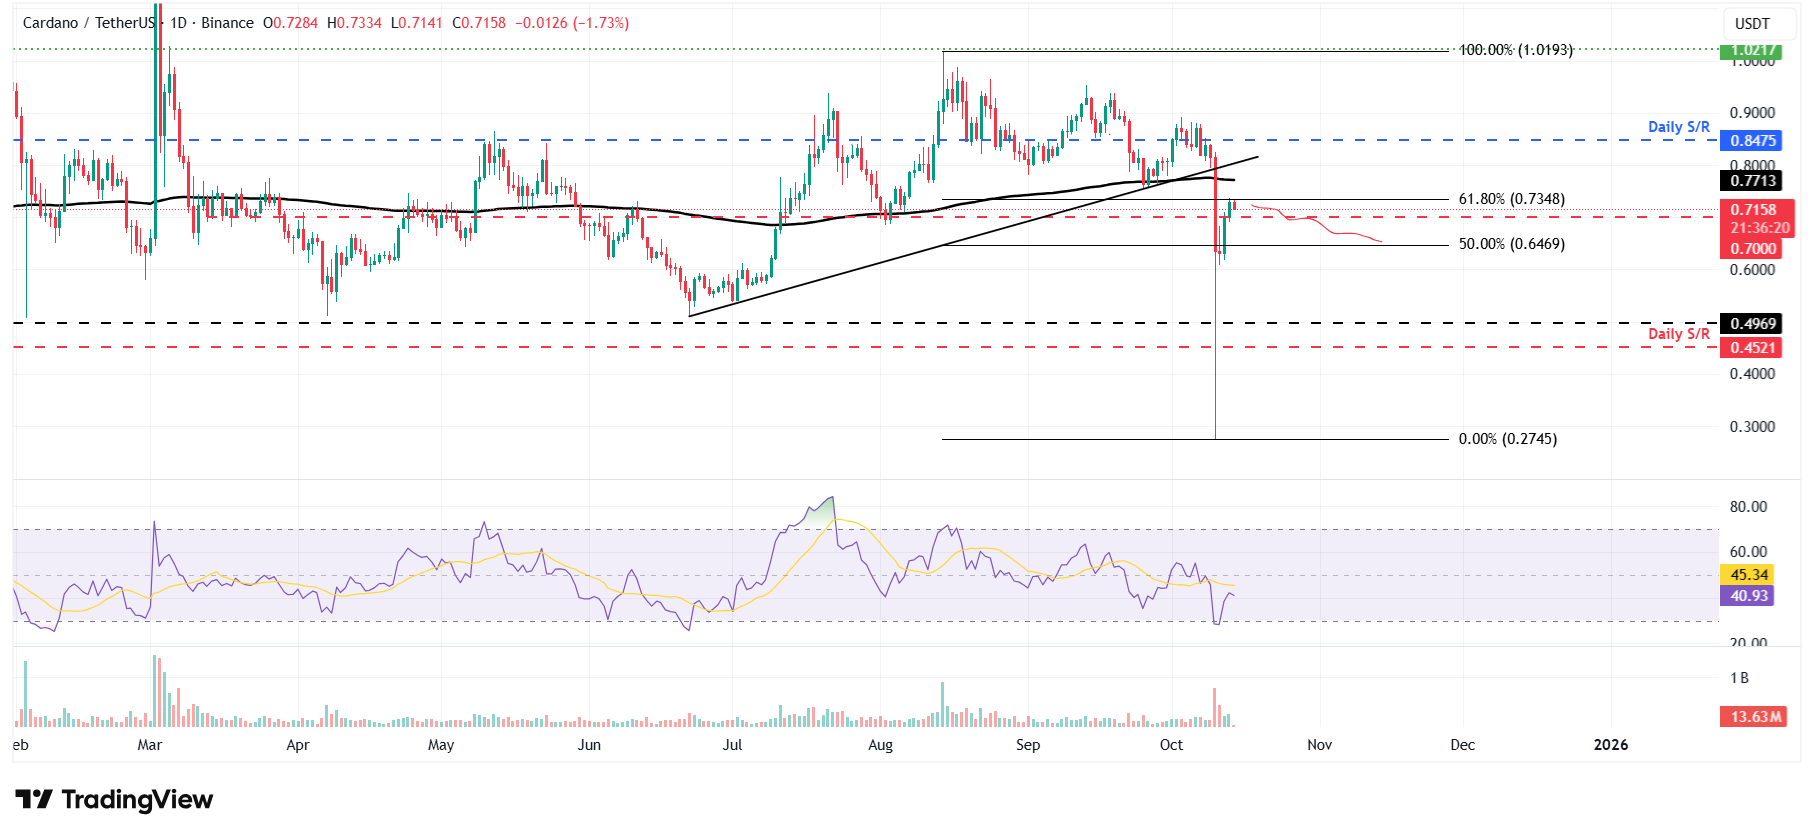
ADA/USDT daily chart
However, if ADA breaks and closes above $0.734 level on a daily basis, it could extend the recovery toward the 200-day Exponential Moving Average (EMA) at 0.771.

Acuity Trading
Acuity Trading là công ty fintech có trụ sở tại London, thành lập năm 2013, chuyên về dữ liệu thay thế và phân tích cảm xúc dựa trên AI cho giao dịch và đầu tư. Họ đã cách mạng hóa trải nghiệm giao dịch trực tuyến với các công cụ tin tức và cảm xúc trực quan, và hiện tiếp tục dẫn đầu thị trường với dữ liệu thay thế tạo alpha và các công cụ giao dịch tương tác cao dựa trên nghiên cứu AI mới nhất.
Read More


