
Trade The World
Cardano Price Forecast: ADA eyes recovery as bullish momentum builds
Bởi Manish Chhetri
Ngày xuất bản: 25 Aug 2025 | Ngày chỉnh sửa: 25 Aug 2025


POPULAR ARTICLES

Cardano (ADA) price is showing signs of recovery after rebounding from a crucial support level last week. This price optimism is further supported by rising Open Interest and stablecoin market capitalization, pointing toward improving market sentiment.
- Cardano price hovers around $0.92 on Monday after rebounding from its key support at $0.84 last week.
- Derivatives and on-chain data show rising Open Interest and stablecoin market capitalization, hinting at improving sentiment.
- Technical indicators point to bearish exhaustion, suggesting room for an upside rally.
Cardano (ADA) price is showing signs of recovery after rebounding from a crucial support level last week. This price optimism is further supported by rising Open Interest and stablecoin market capitalization, pointing toward improving market sentiment. The technical indicators suggest that the recent bearish momentum may be fading, opening the door for a potential upside rally.
Cardano’s derivatives and on-chain data hint at recovery
CoinGlass data show that Cardano’s futures’ OI at exchanges rose from $1.54 billion on Friday to $1.77 billion on Monday, nearing its record high of $1.87 billion. Rising OI represents new or additional money entering the market and new buying, which could fuel the current ADA price rally.
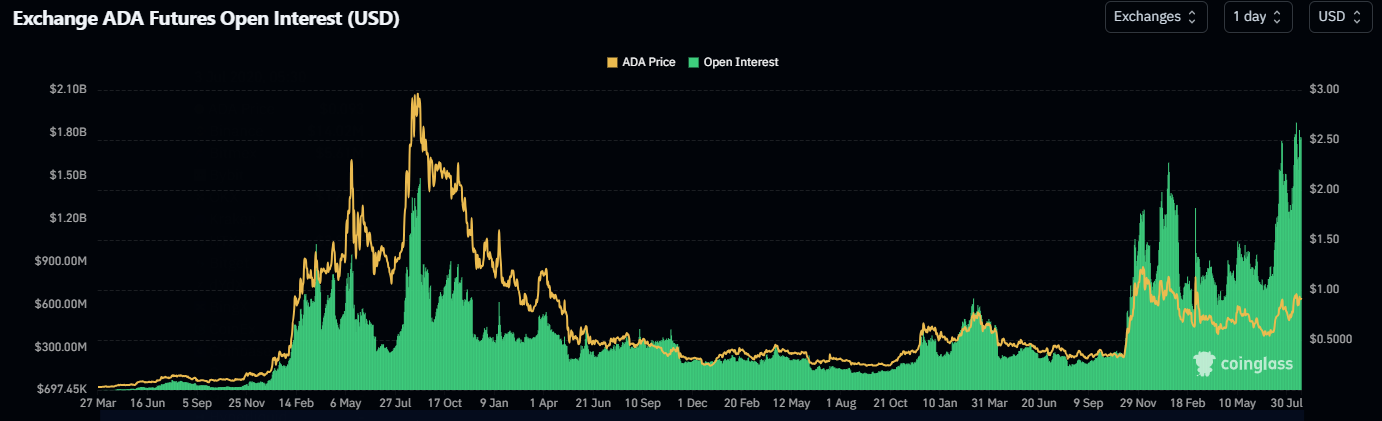
ADA Open Interest chart. Source: Coinglass
Data from crypto intelligence tracker DefiLlama shows that Cardano’s stablecoin market capitalization has been consistently rising since the end of July and currently stands at $38.58 on Monday. Such stablecoin activity and value increase on the ADA project indicate a bullish outlook, as they boost network usage and can attract more users to the ecosystem.
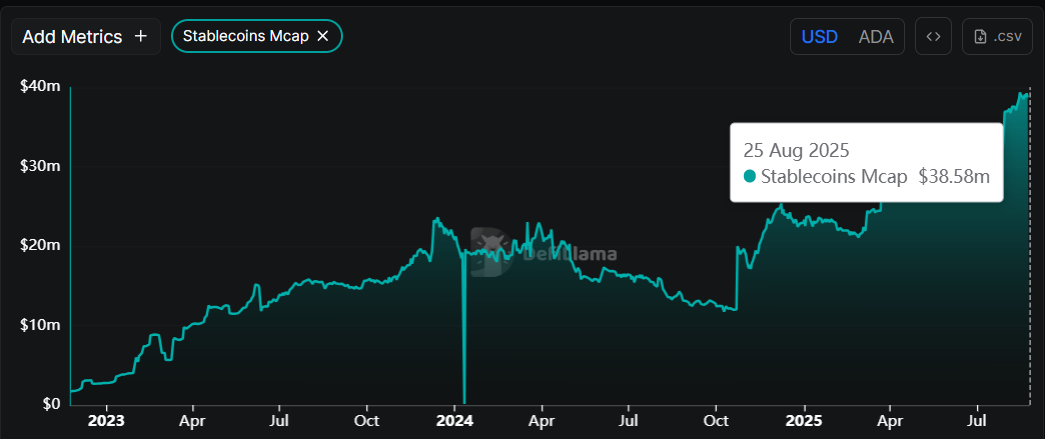
Cardano stablecoins Mcap chart. Source: DefiLlama
Cardano Price Forecast: ADA finds support around a key zone
Cardano price broke above the descending trendline (drawn by connecting multiple highs since early December) on August 13 and rallied, retesting its key psychological level of $1 the next day. However, ADA failed to sustain the upward momentum. It declined 5.4% last week, rebounding from its broken trendline support, which roughly coincides with the 61.8% Fibonacci retracement level at $0.82, making it a key support zone. At the start of this week, on Monday, it hovers at around $0.92.
If ADA continues its upward trend, it could extend the rally toward its August 14 high of $1.02. A successful close above this could extend the gains toward its yearly high at $1.17.
The Relative Strength Index (RSI) on the daily chart reads 58 above its neutral level of 50, indicating bullish momentum gaining traction. The Moving Average Convergence Divergence (MACD) lines converge against each other, indicating indecision among the traders.
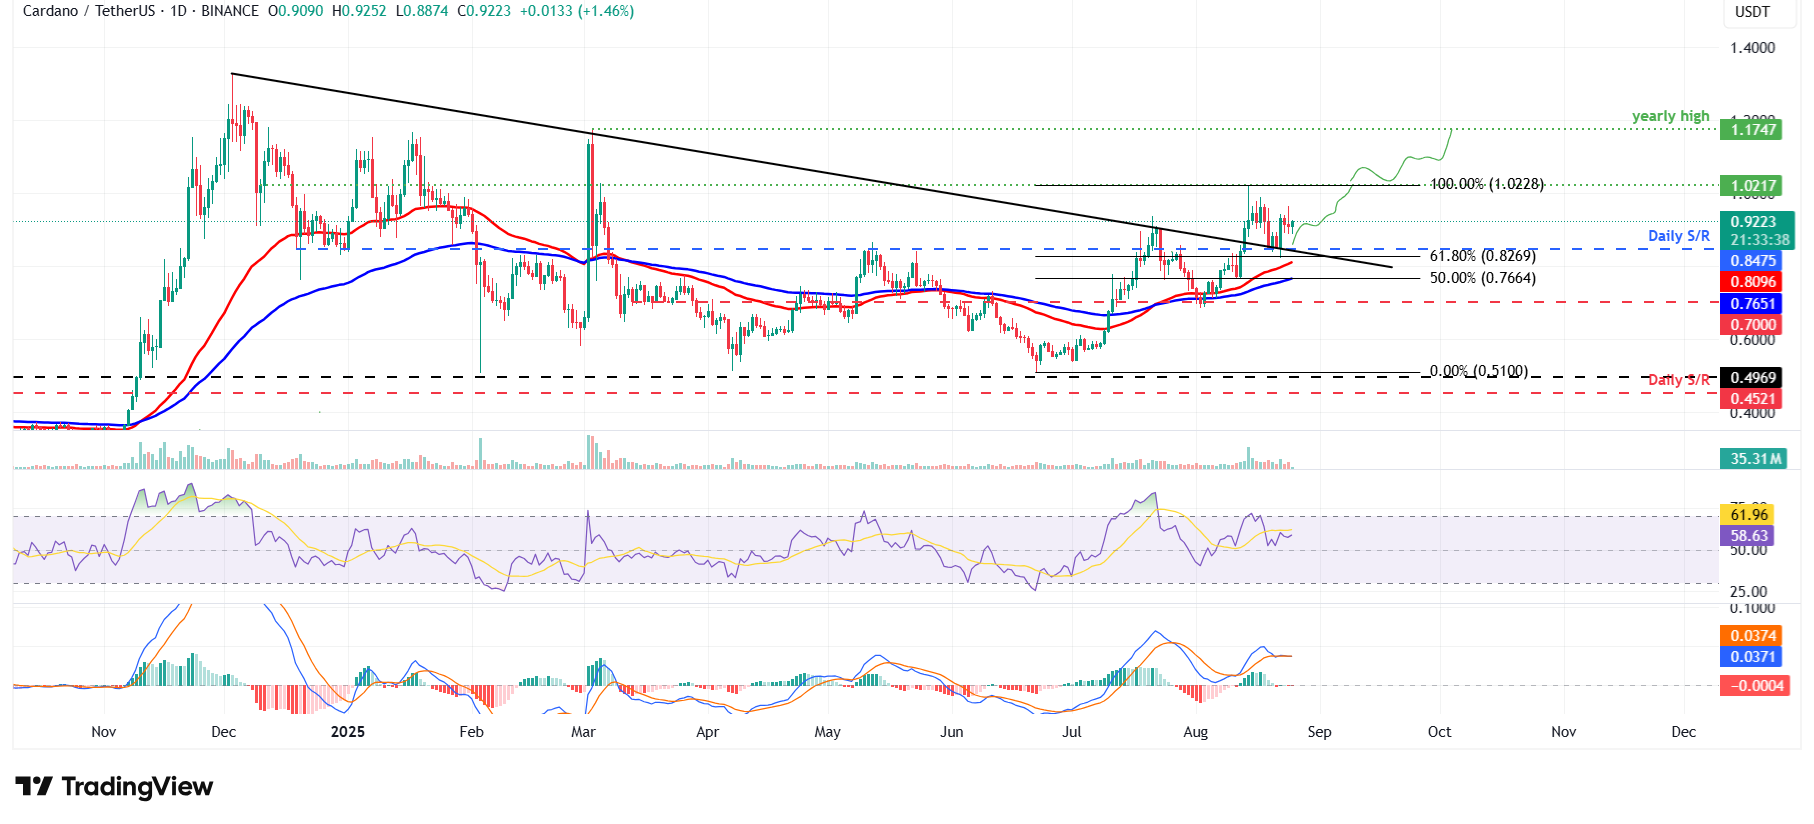
ADA/USDT daily chart
However, if ADA faces a correction, it could extend the decline toward its daily support at $0.84.

Acuity Trading
Acuity Trading là công ty fintech có trụ sở tại London, thành lập năm 2013, chuyên về dữ liệu thay thế và phân tích cảm xúc dựa trên AI cho giao dịch và đầu tư. Họ đã cách mạng hóa trải nghiệm giao dịch trực tuyến với các công cụ tin tức và cảm xúc trực quan, và hiện tiếp tục dẫn đầu thị trường với dữ liệu thay thế tạo alpha và các công cụ giao dịch tương tác cao dựa trên nghiên cứu AI mới nhất.
Read More


