
Trade The World
Cardano Price Forecast: ADA risks deeper correction as open interest drops to a yearly low, short bets surge
Bởi Manish Chhetri
Ngày xuất bản: 20 Oct 2025 | Ngày chỉnh sửa: 20 Oct 2025


POPULAR ARTICLES

Cardano (ADA) hovers around $0.64 at the time of writing on Monday, having corrected nearly 7% in the previous week. Derivatives data signal waning trader confidence and growing expectations of further downside as Open Interest (OI) drops to a yearly low, coupled with a surge in short bets.
- Cardano price hovers around $0.64 on Monday after falling nearly 7% last week.
- Derivatives data show bearish signs as open interest dips to a year-to-date low while short bets hit a monthly high.
- The technical outlook indicates potential for a deeper correction, pushing ADA below the $0.60 level.
Cardano (ADA) hovers around $0.64 at the time of writing on Monday, having corrected nearly 7% in the previous week. Derivatives data signal waning trader confidence and growing expectations of further downside as Open Interest (OI) drops to a yearly low, coupled with a surge in short bets. The technical indicators also suggest the potential for a deeper correction targeting levels below $0.60.
Cardano’s derivatives hint at further correction
Cardano’s futures Open Interest (OI) dropped to $112.82 million on Monday, the lowest year-to-date level and levels not seen since November 2024, according to Coinglass data. This drop in OI reflects waning investor participation and projects a bearish outlook.
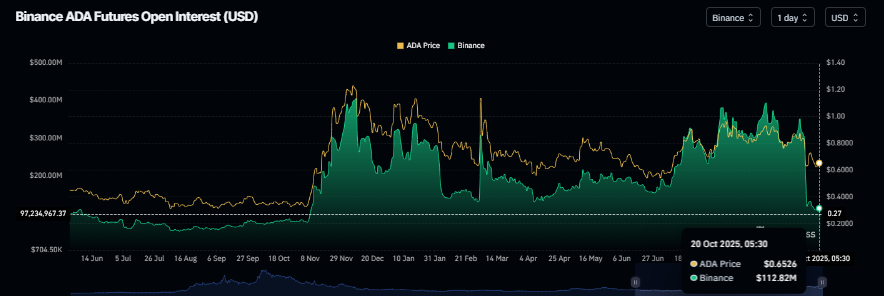
ADA futures OI chart. Source: Coinglass
CoinGlass’s ADA long-to-short ratio, which stands at 0.85, is the lowest value in a month. This ratio, below one, reflects bearish sentiment in the markets, as more traders are betting on the asset price to fall.
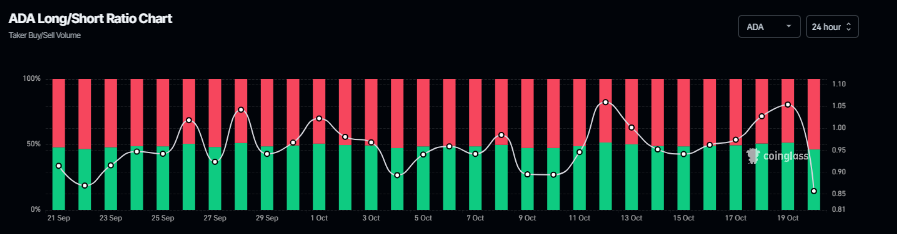
Cardano long-to-short ratio chart. Source: Coinglass
Cardano Price Forecast: ADA bears aiming for levels below $0.60
Cardano price faced rejection from the 61.8% Fibonacci retracement level at $0.73 on Tuesday and corrected more than 15% by Friday, closing below the $0.64 level. However, ADA recovered slightly during the weekend. At the time of writing on Monday, it hovers at around $0.65.
If ADA continues its correction, it could extend the decline toward the next key support level at $0.56.
The Relative Strength Index (RSI) on the daily chart reads 37, below the neutral level of 50, indicating that the bears are in control of the momentum. Moreover, the Moving Average Convergence Divergence (MACD) also showed a bearish crossover in early October, which remains in effect, further supporting the bearish view.
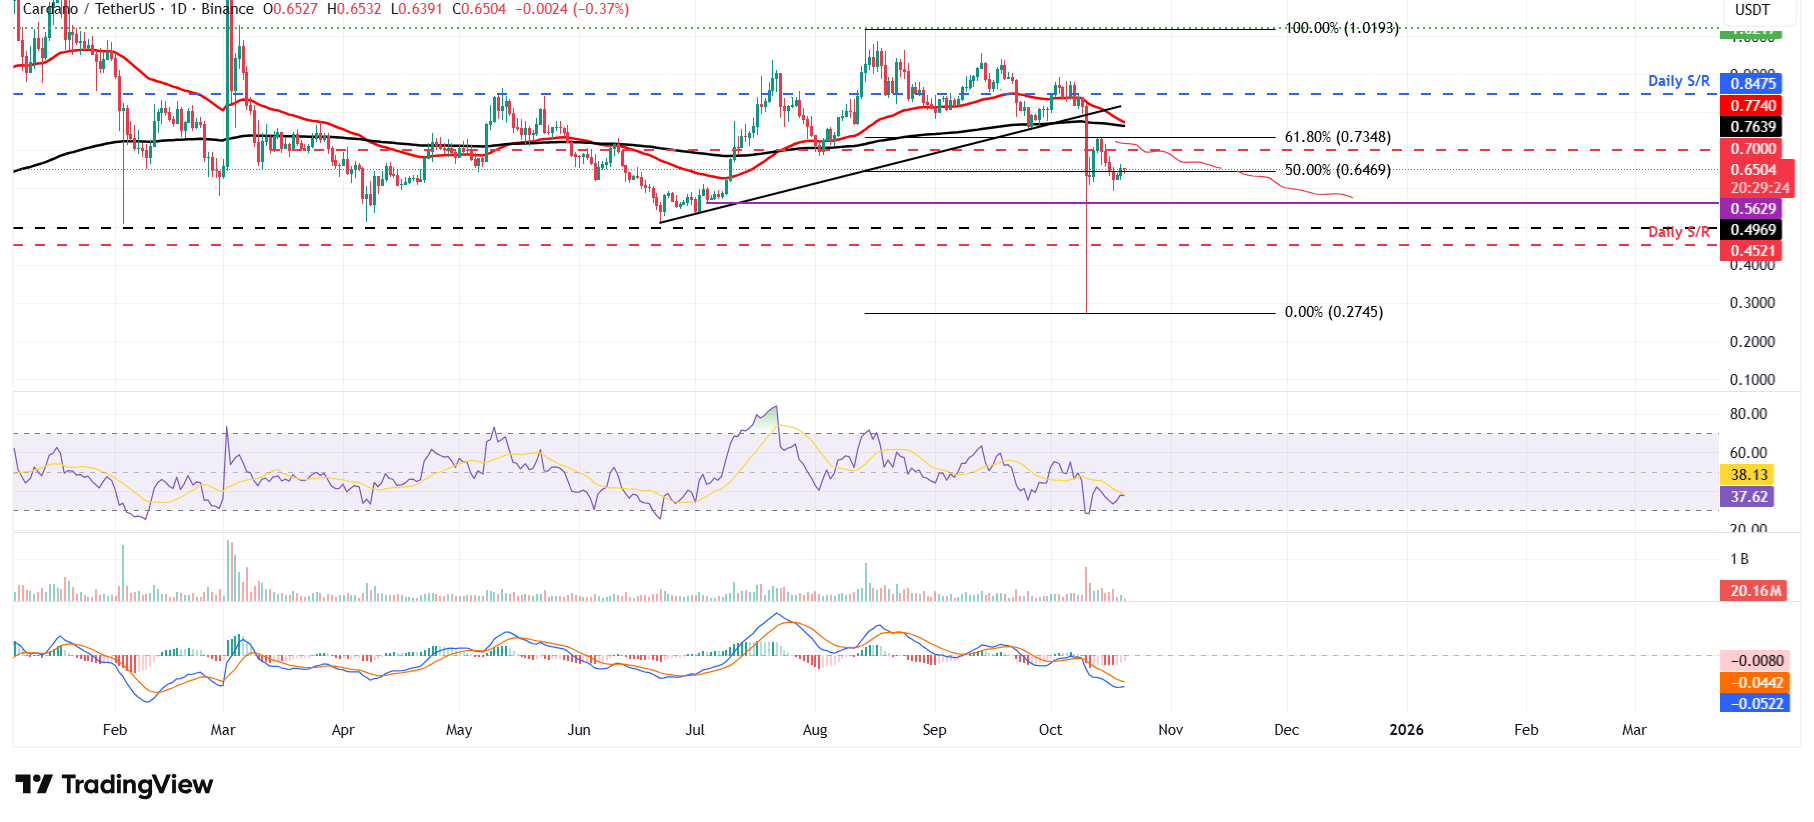
ADA/USDT daily chart
On the other hand, if ADA recovers, it could extend the recovery toward the 61.8% Fibonacci retracement level at $0.73.

Acuity Trading
Acuity Trading là công ty fintech có trụ sở tại London, thành lập năm 2013, chuyên về dữ liệu thay thế và phân tích cảm xúc dựa trên AI cho giao dịch và đầu tư. Họ đã cách mạng hóa trải nghiệm giao dịch trực tuyến với các công cụ tin tức và cảm xúc trực quan, và hiện tiếp tục dẫn đầu thị trường với dữ liệu thay thế tạo alpha và các công cụ giao dịch tương tác cao dựa trên nghiên cứu AI mới nhất.
Read More


