
Trade The World
EUR/JPY price forecast: Falls toward 171.00 on signs of a potential bearish shift
Bởi Akhtar Faruqui
Ngày xuất bản: 14 Aug 2025 | Ngày chỉnh sửa: 14 Aug 2025


POPULAR ARTICLES

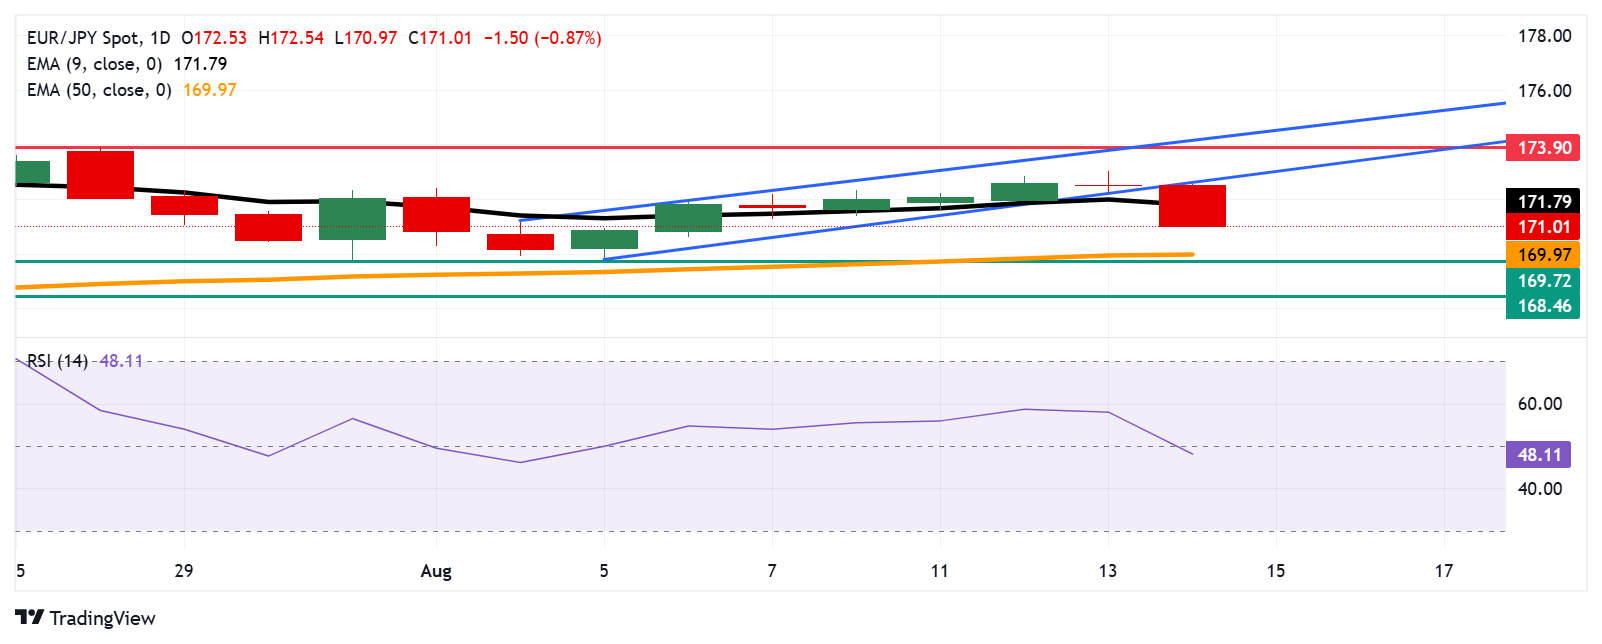
EUR/JPY depreciates more than 0.5%, trading around 171.20 during the European hours on Thursday. The technical analysis of the daily chart suggests a shift from bullish to bearish momentum as the currency cross has broken below the ascending channel pattern.
- EUR/JPY may find the primary support at the 50-day EMA of 169.98.
- A bearish shift appears as the currency cross broke below the ascending channel pattern.
- The immediate resistance appears at the nine-day EMA of 171.79.
EUR/JPY depreciates more than 0.5%, trading around 171.20 during the European hours on Thursday. The technical analysis of the daily chart suggests a shift from bullish to bearish momentum as the currency cross has broken below the ascending channel pattern.
The 14-day Relative Strength Index (RSI) is positioned below the 50 mark, suggesting a bearish is in play. Additionally, the short-term price momentum is weaker as the EUR/JPY cross moved below the nine-day Exponential Moving Average (EMA).
On the downside, the EUR/JPY cross may target the 50-day EMA at 169.97, followed by the six-week low at 169.72, which was recorded on July 31. A break below this level would prompt the currency cross to test the two-month low at 168.46, registered on July 1.
The EUR/JPY cross could test the immediate barrier at the nine-day EMA of 171.81. A break above this level would strengthen short-term price momentum, allowing the currency cross to re-enter the ascending channel, signaling a false breakout and a bullish recovery. Further advances would lead the currency cross to approach 173.90, the highest since July 2024, recorded on July 28, 2025, followed by the upper boundary of the ascending channel around 174.30.
EUR/JPY: Daily Chart
Euro PRICE Today
The table below shows the percentage change of Euro (EUR) against listed major currencies today. Euro was the weakest against the Japanese Yen.
| USD | EUR | GBP | JPY | CAD | AUD | NZD | CHF | |
|---|---|---|---|---|---|---|---|---|
| USD | 0.29% | 0.01% | -0.57% | 0.16% | 0.28% | 0.48% | 0.23% | |
| EUR | -0.29% | -0.25% | -0.86% | -0.14% | -0.02% | 0.17% | -0.07% | |
| GBP | -0.01% | 0.25% | -0.62% | 0.22% | 0.30% | 0.53% | 0.28% | |
| JPY | 0.57% | 0.86% | 0.62% | 0.76% | 0.85% | 0.95% | 0.76% | |
| CAD | -0.16% | 0.14% | -0.22% | -0.76% | 0.16% | 0.32% | 0.07% | |
| AUD | -0.28% | 0.02% | -0.30% | -0.85% | -0.16% | 0.23% | -0.13% | |
| NZD | -0.48% | -0.17% | -0.53% | -0.95% | -0.32% | -0.23% | -0.29% | |
| CHF | -0.23% | 0.07% | -0.28% | -0.76% | -0.07% | 0.13% | 0.29% |
The heat map shows percentage changes of major currencies against each other. The base currency is picked from the left column, while the quote currency is picked from the top row. For example, if you pick the Euro from the left column and move along the horizontal line to the US Dollar, the percentage change displayed in the box will represent EUR (base)/USD (quote).

Acuity Trading
Acuity Trading là công ty fintech có trụ sở tại London, thành lập năm 2013, chuyên về dữ liệu thay thế và phân tích cảm xúc dựa trên AI cho giao dịch và đầu tư. Họ đã cách mạng hóa trải nghiệm giao dịch trực tuyến với các công cụ tin tức và cảm xúc trực quan, và hiện tiếp tục dẫn đầu thị trường với dữ liệu thay thế tạo alpha và các công cụ giao dịch tương tác cao dựa trên nghiên cứu AI mới nhất.
Read More


