
EUR/USD Price Forecast: Hovers around nine-day EMA above 1.1800
Bởi Akhtar Faruqui
Ngày xuất bản: 23 Feb 2026 | Ngày chỉnh sửa: 23 Feb 2026


BÀI VIẾT PHỔ BIẾN

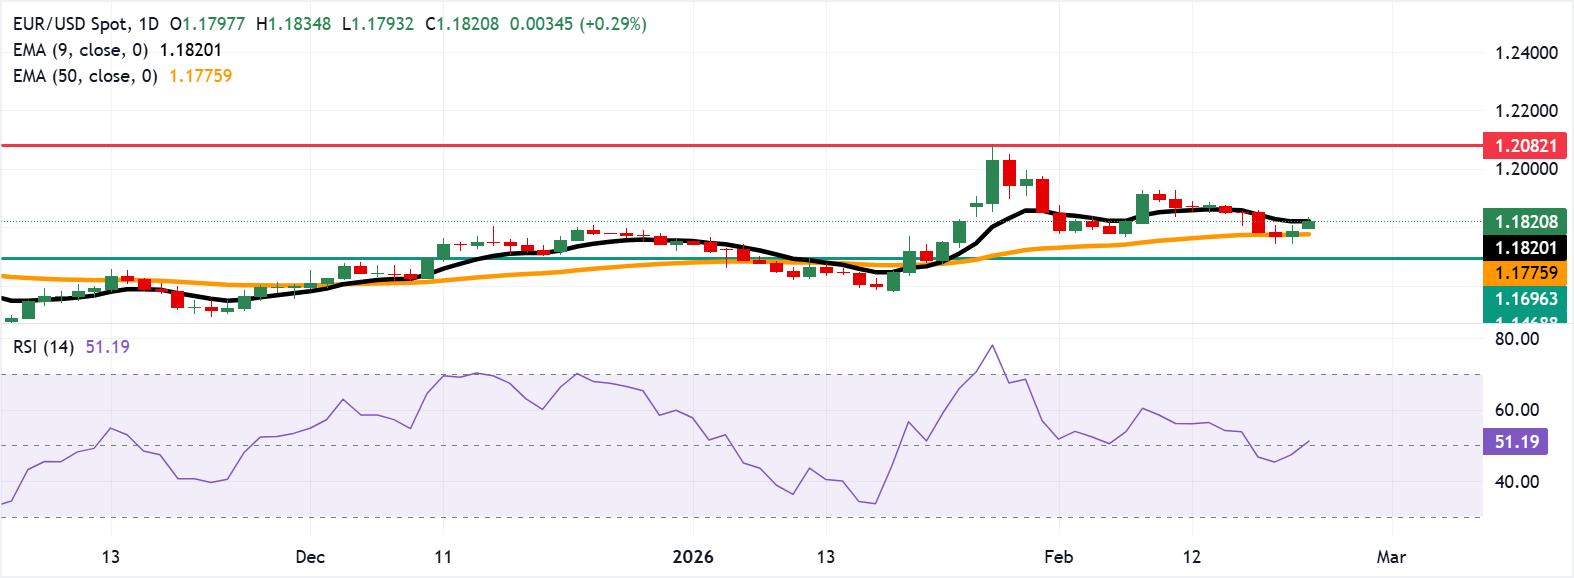
EUR/USD gains ground for the second successive session, trading around 1.1820 during the Asian hours on Monday. The 14-day Relative Strength Index (RSI) momentum indicator stands at 51 (neutral) after recovering above the midline, indicating stabilizing momentum.
- EUR/USD trades near the nine-day EMA at 1.1820.
- The 14-day Relative Strength Index at 51 signals neutral, stabilizing momentum.
- A drop below the nine-day EMA would target the 50-day EMA at 1.1775.
EUR/USD gains ground for the second successive session, trading around 1.1820 during the Asian hours on Monday. The 14-day Relative Strength Index (RSI) momentum indicator stands at 51 (neutral) after recovering above the midline, indicating stabilizing momentum. A push in RSI above the low-50s would aid an upside extension, while a drop below 50 would tilt the risk toward support.
The technical analysis of the daily chart shows that the EUR/USD pair holds above the 50-day Exponential Moving Average (EMA), keeping the broader bias supported. The nine-day EMA has flattened near the spot, tempering immediate follow-through.
The EUR/USD pair is hovering around the nine-day EMA at 1.1820. A daily close above the short-term average would cause the emergence of the bullish bias and support the pair to explore the region around 1.2082, the highest level since June 2021.
A close back under the nine-day EMA would expose the 50-day EMA at 1.1775. A drop back under the medium-term average would strengthen the bearish bias and expose the two-month low at 1.1578, recorded on January 19.
(The technical analysis of this story was written with the help of an AI tool.)
Euro Price Today
The table below shows the percentage change of Euro (EUR) against listed major currencies today. Euro was the strongest against the Australian Dollar.
| USD | EUR | GBP | JPY | CAD | AUD | NZD | CHF | |
|---|---|---|---|---|---|---|---|---|
| USD | -0.28% | -0.20% | -0.45% | -0.09% | 0.21% | -0.09% | -0.33% | |
| EUR | 0.28% | 0.08% | -0.18% | 0.20% | 0.49% | 0.22% | -0.06% | |
| GBP | 0.20% | -0.08% | -0.25% | 0.10% | 0.40% | 0.10% | -0.14% | |
| JPY | 0.45% | 0.18% | 0.25% | 0.37% | 0.66% | 0.36% | 0.13% | |
| CAD | 0.09% | -0.20% | -0.10% | -0.37% | 0.29% | -0.01% | -0.25% | |
| AUD | -0.21% | -0.49% | -0.40% | -0.66% | -0.29% | -0.30% | -0.54% | |
| NZD | 0.09% | -0.22% | -0.10% | -0.36% | 0.00% | 0.30% | -0.25% | |
| CHF | 0.33% | 0.06% | 0.14% | -0.13% | 0.25% | 0.54% | 0.25% |
The heat map shows percentage changes of major currencies against each other. The base currency is picked from the left column, while the quote currency is picked from the top row. For example, if you pick the Euro from the left column and move along the horizontal line to the US Dollar, the percentage change displayed in the box will represent EUR (base)/USD (quote).

Acuity Trading là công ty fintech có trụ sở tại London, thành lập năm 2013, chuyên về dữ liệu thay thế và phân tích cảm xúc dựa trên AI cho giao dịch và đầu tư. Họ đã cách mạng hóa trải nghiệm giao dịch trực tuyến với các công cụ tin tức và cảm xúc trực quan, và hiện tiếp tục dẫn đầu thị trường với dữ liệu thay thế tạo alpha và các công cụ giao dịch tương tác cao dựa trên nghiên cứu AI mới nhất.
Đọc thêm


