
EUR/USD Price Forecast: Tests nine-day support near 1.1700
Bởi Akhtar Faruqui
Ngày xuất bản: 19 Dec 2025 | Ngày chỉnh sửa: 19 Dec 2025


BÀI VIẾT PHỔ BIẾN

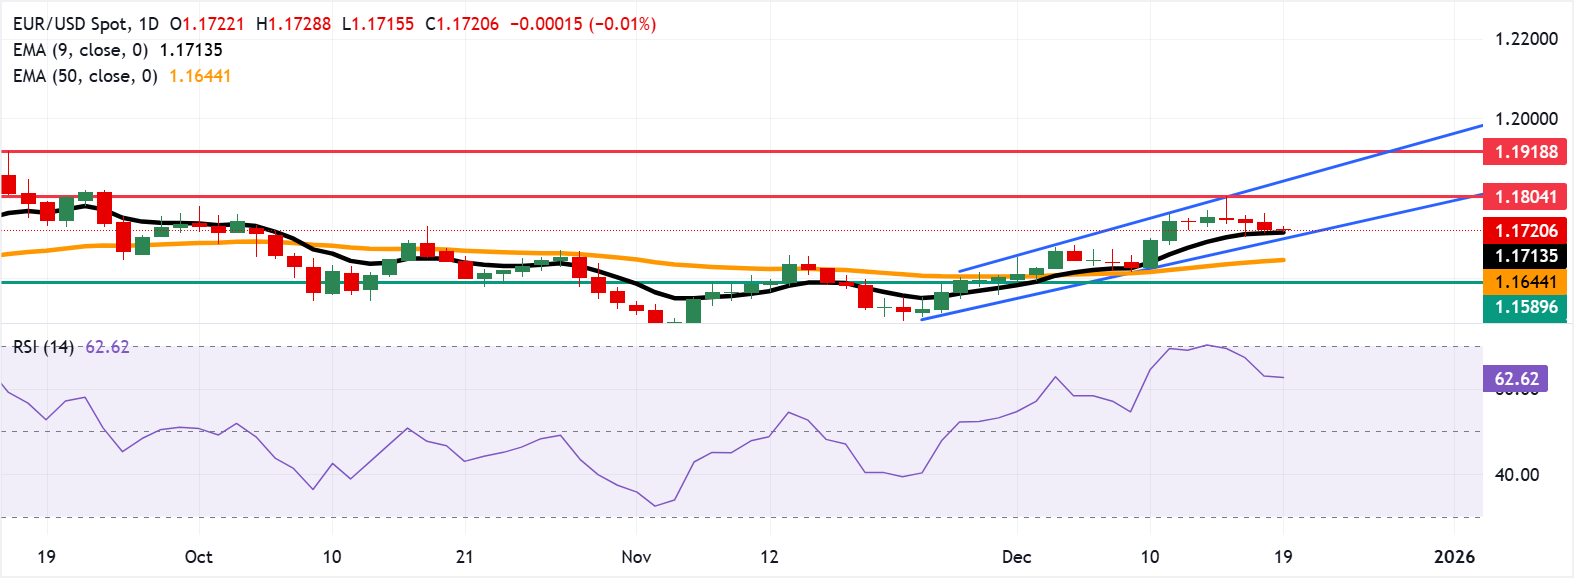
EUR/USD remains weaker for the fourth consecutive session, trading around 1.1720 during the Asian hours on Friday. On the daily chart, technical analysis indicates a prevailing bullish bias, as the pair remains within the ascending channel pattern.
- EUR/USD may rise toward a two-month high of 1.1804 amid prevailing bullish bias.
- The 14-day Relative Strength Index at 62.11 signals strong bullish momentum without overbought conditions.
- The pair tests immediate support at the nine-day EMA of 1.1713.
EUR/USD remains weaker for the fourth consecutive session, trading around 1.1720 during the Asian hours on Friday. On the daily chart, technical analysis indicates a prevailing bullish bias, as the pair remains within the ascending channel pattern. Additionally, the 14-day Relative Strength Index (RSI) stands at 62.11, signaling firm positive momentum without overbought pressure.
The EUR/USD pair holds above the ascending nine- and 50-day Exponential Moving Averages (EMAs), maintaining a bullish bias. Upside prospects stay intact as long as price holds above the EMAs. The short-term average remains above the medium-term gauge, underscoring trend strength.
The EUR/USD pair may rebound toward the two-month high of 1.1804, reached on December 16. A daily close above the primary barrier could extend gains toward the upper boundary of the ascending channel around 1.1850. A break above the channel would support the pair to explore the region around 1.1918, the highest since June 2021.
Further declines could be contained toward the nine-day EMA at 1.1713, followed by the lower ascending channel boundary around 1.1700. A break below this support area would weaken the short-term price momentum and put downward pressure on the EUR/USD pair to test the 50-day EMA at 1.1644, followed by the three-week low of 1.1589, which was recorded on December 1.
Euro Price Today
The table below shows the percentage change of Euro (EUR) against listed major currencies today. Euro was the weakest against the US Dollar.
| USD | EUR | GBP | JPY | CAD | AUD | NZD | CHF | |
|---|---|---|---|---|---|---|---|---|
| USD | 0.01% | 0.00% | 0.25% | 0.06% | 0.06% | 0.18% | 0.12% | |
| EUR | -0.01% | 0.00% | 0.26% | 0.05% | 0.05% | 0.18% | 0.10% | |
| GBP | -0.01% | -0.00% | 0.25% | 0.05% | 0.05% | 0.18% | 0.10% | |
| JPY | -0.25% | -0.26% | -0.25% | -0.18% | -0.19% | -0.07% | -0.14% | |
| CAD | -0.06% | -0.05% | -0.05% | 0.18% | -0.01% | 0.11% | 0.05% | |
| AUD | -0.06% | -0.05% | -0.05% | 0.19% | 0.00% | 0.13% | 0.05% | |
| NZD | -0.18% | -0.18% | -0.18% | 0.07% | -0.11% | -0.13% | -0.08% | |
| CHF | -0.12% | -0.10% | -0.10% | 0.14% | -0.05% | -0.05% | 0.08% |
The heat map shows percentage changes of major currencies against each other. The base currency is picked from the left column, while the quote currency is picked from the top row. For example, if you pick the Euro from the left column and move along the horizontal line to the US Dollar, the percentage change displayed in the box will represent EUR (base)/USD (quote).
(The technical analysis of this story was written with the help of an AI tool.)

Acuity Trading là công ty fintech có trụ sở tại London, thành lập năm 2013, chuyên về dữ liệu thay thế và phân tích cảm xúc dựa trên AI cho giao dịch và đầu tư. Họ đã cách mạng hóa trải nghiệm giao dịch trực tuyến với các công cụ tin tức và cảm xúc trực quan, và hiện tiếp tục dẫn đầu thị trường với dữ liệu thay thế tạo alpha và các công cụ giao dịch tương tác cao dựa trên nghiên cứu AI mới nhất.
Đọc thêm


