
GBP/JPY Price Analysis: Hits fresh highs above 209.00 due to persistent bullish bias
Bởi Akhtar Faruqui
Ngày xuất bản: 19 Dec 2025 | Ngày chỉnh sửa: 19 Dec 2025


BÀI VIẾT PHỔ BIẾN

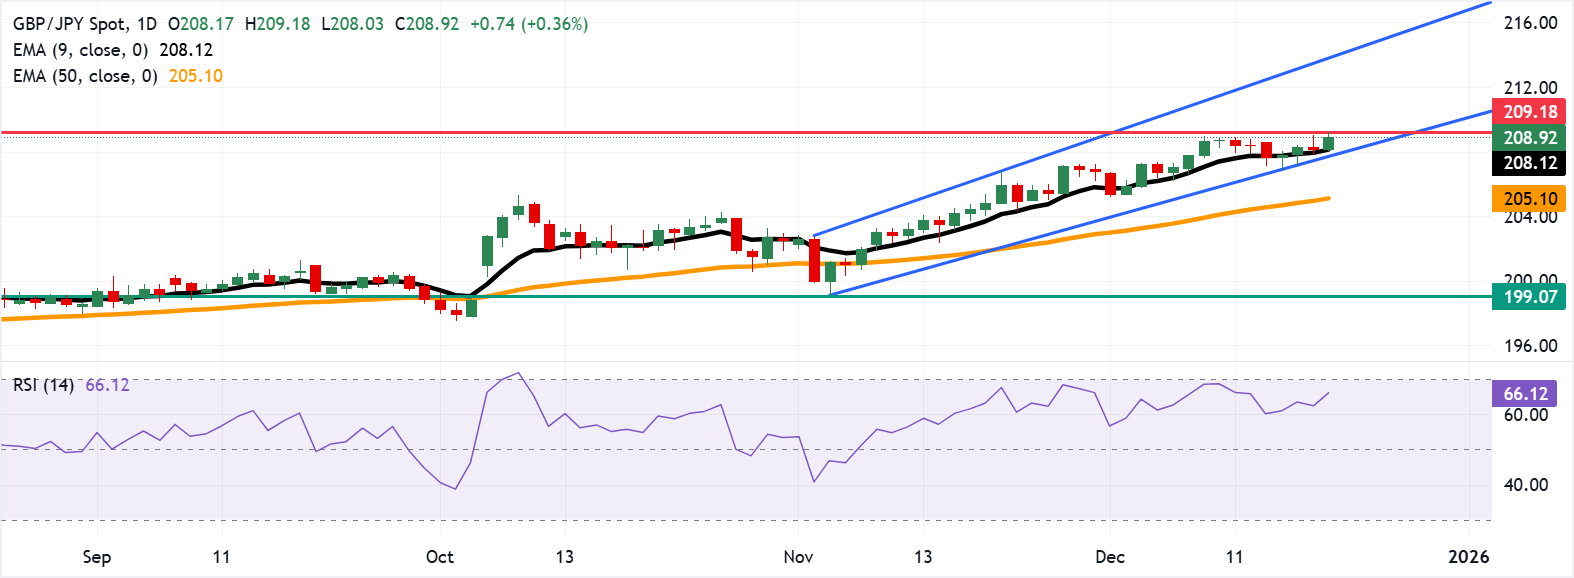
GBP/JPY reaches fresh record highs after registering little losses in the previous session, trading at 209.18 during the early European hours on Friday. A look at the daily chart shows the currency cross is moving upwards within an ascending channel pattern, indicating a persistent bullish bias.
- GBP/JPY hits a fresh all-time high at 209.18 on Friday.
- The 14-day Relative Strength Index at 66.90 stays bullish, but below overbought levels.
- The primary support lies at the nine-day EMA of 208.10.
GBP/JPY reaches fresh record highs after registering little losses in the previous session, trading at 209.18 during the early European hours on Friday. A look at the daily chart shows the currency cross is moving upwards within an ascending channel pattern, indicating a persistent bullish bias.
The nine-day Exponential Moving Average (EMA) rises above the 50-day EMA, reinforcing the upside. The GBP/JPY cross holds above both averages, confirming trend strength. Additionally, the 14-day Relative Strength Index (RSI), a key momentum gauge, at 66.90 remains bullish, shy of overbought. RSI has improved in recent sessions, supporting continuation.
The GBP/JPY cross may further hit fresh highs near 210.00. A break above this psychological level could extend the advance toward the upper boundary of the ascending channel around 213.10. Short-term momentum stays firm as ascending averages help contain pullbacks and preserve the upward bias.
On the downside, the GBP/JPY cross may find its primary support at the nine-day EMA of 208.10, followed by the lower ascending channel boundary around 207.50. Further declines below the channel would weaken the bullish bias and put downward pressure on the currency cross to test the 50-day EMA at 205.10.
Japanese Yen Price Today
The table below shows the percentage change of Japanese Yen (JPY) against listed major currencies today. Japanese Yen was the weakest against the British Pound.
| USD | EUR | GBP | JPY | CAD | AUD | NZD | CHF | |
|---|---|---|---|---|---|---|---|---|
| USD | 0.07% | -0.01% | 0.37% | 0.06% | 0.07% | 0.22% | 0.15% | |
| EUR | -0.07% | -0.08% | 0.33% | -0.00% | -0.00% | 0.16% | 0.08% | |
| GBP | 0.01% | 0.08% | 0.42% | 0.08% | 0.07% | 0.23% | 0.16% | |
| JPY | -0.37% | -0.33% | -0.42% | -0.32% | -0.32% | -0.18% | -0.24% | |
| CAD | -0.06% | 0.00% | -0.08% | 0.32% | -0.01% | 0.14% | 0.08% | |
| AUD | -0.07% | 0.00% | -0.07% | 0.32% | 0.00% | 0.15% | 0.08% | |
| NZD | -0.22% | -0.16% | -0.23% | 0.18% | -0.14% | -0.15% | -0.07% | |
| CHF | -0.15% | -0.08% | -0.16% | 0.24% | -0.08% | -0.08% | 0.07% |
The heat map shows percentage changes of major currencies against each other. The base currency is picked from the left column, while the quote currency is picked from the top row. For example, if you pick the Japanese Yen from the left column and move along the horizontal line to the US Dollar, the percentage change displayed in the box will represent JPY (base)/USD (quote).
(The technical analysis of this story was written with the help of an AI tool.)

Acuity Trading là công ty fintech có trụ sở tại London, thành lập năm 2013, chuyên về dữ liệu thay thế và phân tích cảm xúc dựa trên AI cho giao dịch và đầu tư. Họ đã cách mạng hóa trải nghiệm giao dịch trực tuyến với các công cụ tin tức và cảm xúc trực quan, và hiện tiếp tục dẫn đầu thị trường với dữ liệu thay thế tạo alpha và các công cụ giao dịch tương tác cao dựa trên nghiên cứu AI mới nhất.
Đọc thêm


