
Trade The World
Pepe Price Forecast: PEPE rebounds as interest in meme coins returns
Bởi John Isige
Ngày xuất bản: 9 Sep 2025 | Ngày chỉnh sửa: 9 Sep 2025


POPULAR ARTICLES

Pepe (PEPE) price is rising alongside Bitcoin (BTC) and other meme coins, such as Dogecoin (DOGE), on Tuesday. The bullish outlook, which has steadied since late week, has seen Pepe rise to exchange hands slightly above the critical $0.00001000 at the time of writing.
- Pepe extends recovery above $0.00001, mirroring risk-on sentiment in the meme coin sector.
- The MACD indicator’s buy signal and an increasing RSI support Pepe’s bullish outlook.
- Retail interest in Pepe rises in tandem with the futures Open Interest, which increases to $609 million.
Pepe (PEPE) price is rising alongside Bitcoin (BTC) and other meme coins, such as Dogecoin (DOGE), on Tuesday. The bullish outlook, which has steadied since late week, has seen Pepe rise to exchange hands slightly above the critical $0.00001000 at the time of writing.
Pepe rises amid steady retail interest
Pepe price has sustained a decline over the past few weeks, after reaching a local top near $0.00001470 in July. An attempt to recoup the losses could not go beyond resistance at $0.00001268 on August 10.
A significant decline in the futures Open Interest (OI) coincided with the subsequent correction, which tested support at $0.00000913 on September 1 before bulls regained control.
OI, representing the notional value of outstanding futures contracts, averages at $609 million, up from $531 million recorded on Friday. If retail interest in Pepe stabilizes in the coming days, OI is expected to surge toward the $1 billion mark, indicating that investors have a strong conviction in the recovery.
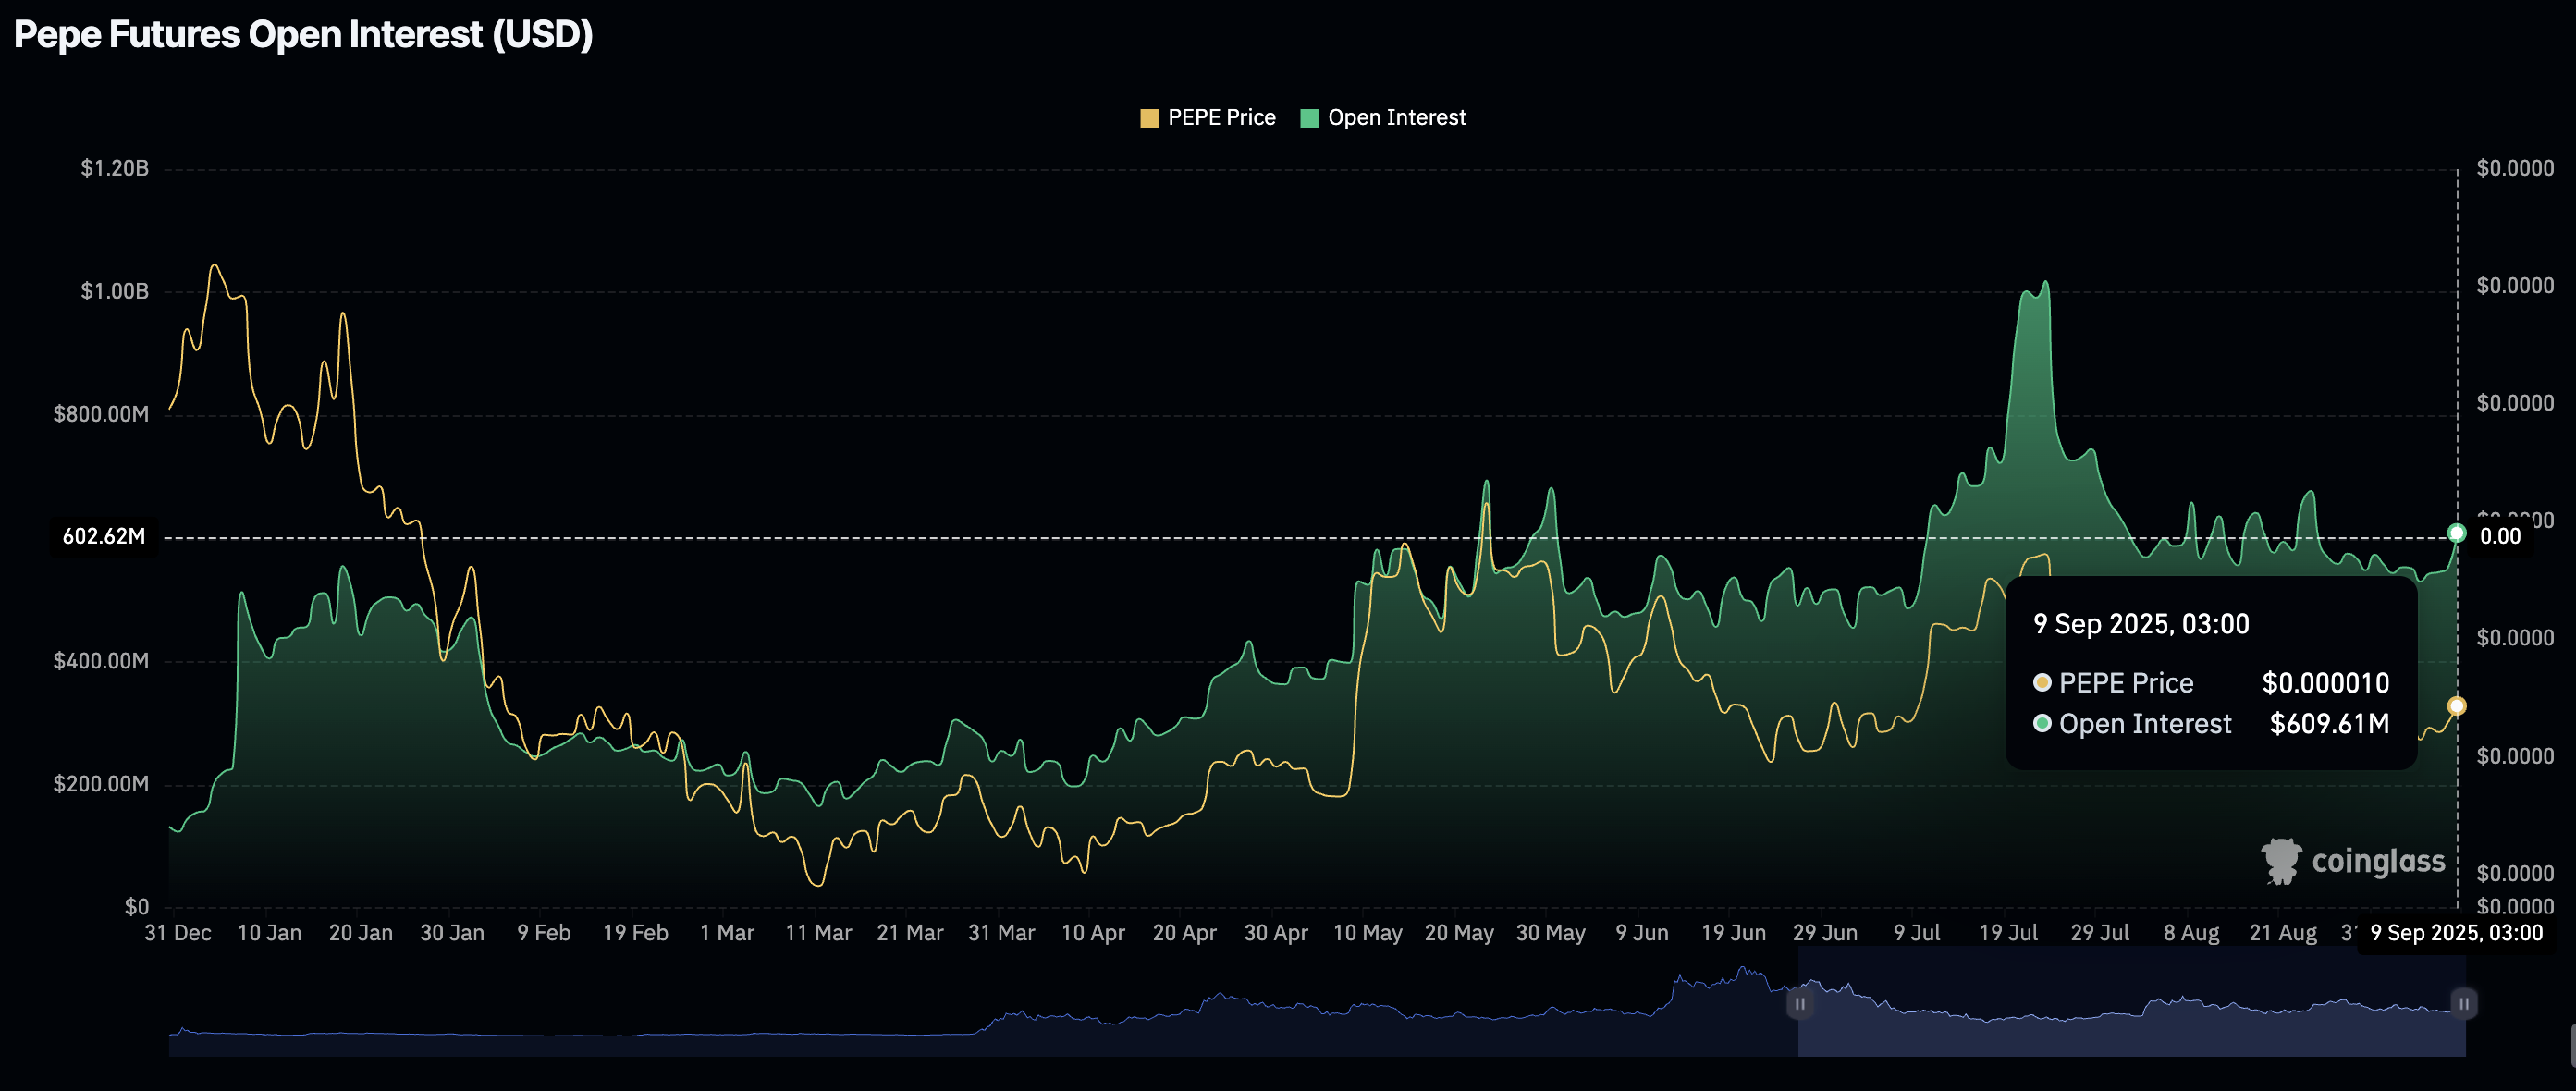
Pepe Futures OI | Source: CoinGlass
At the same time, the Pepe futures weighted funding rate, which has been stable at around 0.0113%, backs the prevailing bullish outlook. This indicates that an increasing number of traders are leveraging long positions in Pepe, anticipating a sustainable uptrend.
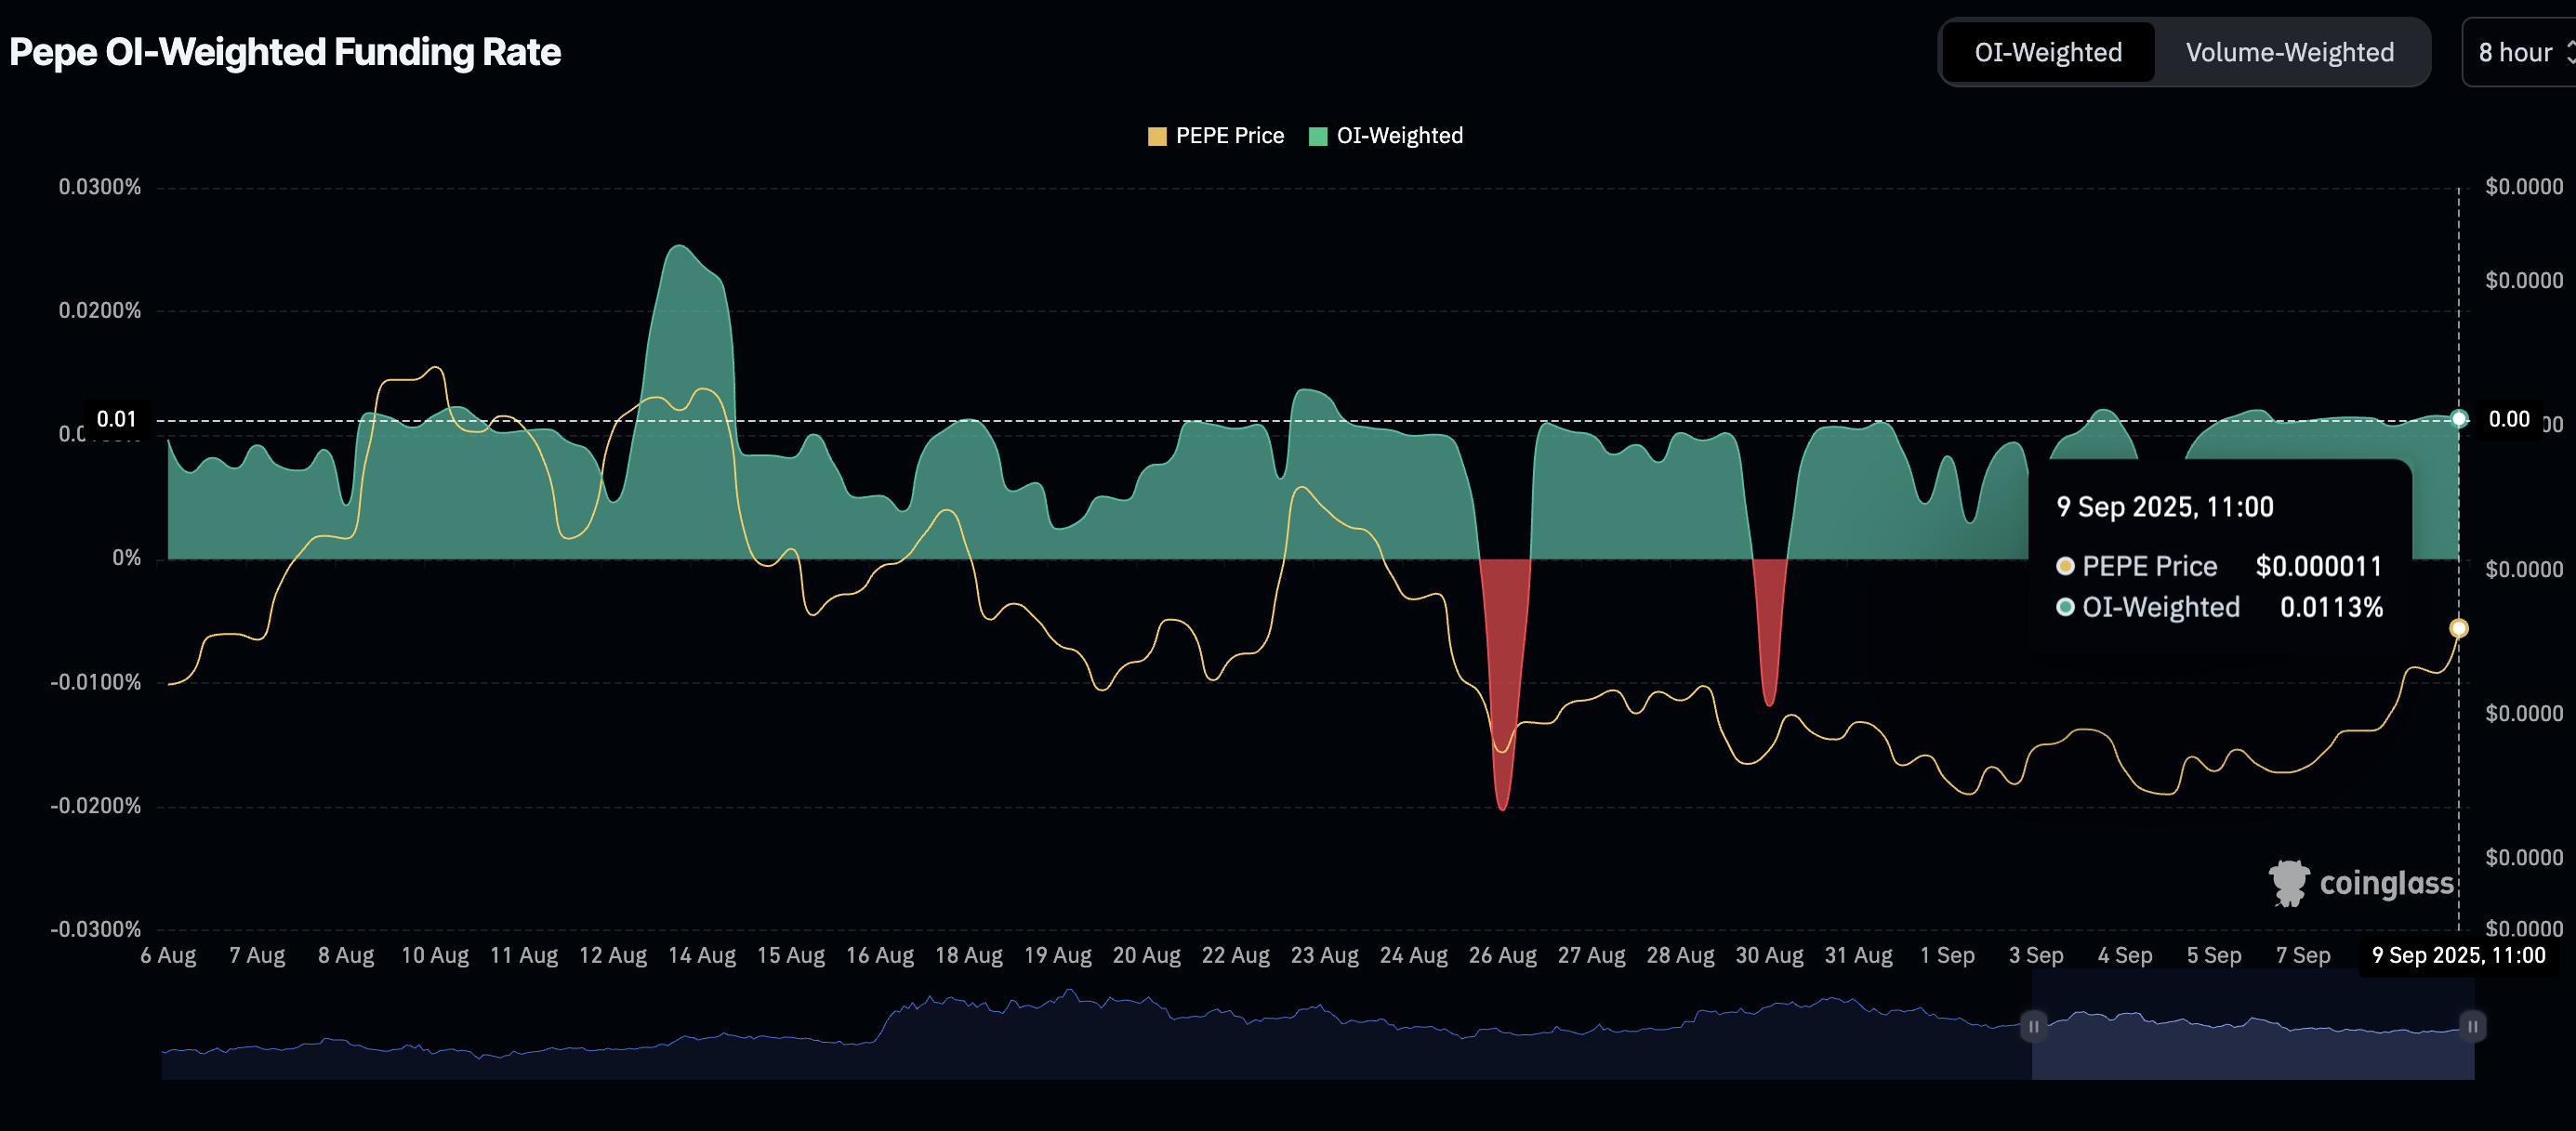
Pepe Futures Weighted Funding Rate | Source: CoinGlass
Technical outlook: Pepe tests key resistance
Pepe price is knocking on the 100-day Exponential Moving Average (EMA) resistance at $0.00001085 after stepping above the 50-day EMA at $0.00001064 at the time of writing on Tuesday.
The path of least resistance is upward, supported by a buy signal, triggered by the Moving Average Convergence Divergence (MACD) indicator on Monday. Traders will look out for a break above the immediate 100-day EMA at $0.00001085 and the 200-day at $0.00001099 to ascertain Pepe’s recovery potential before going all-in on PEPE.
In the short term, the Relative Strength Index (RSI) at 54 reinforces the bullish grip. Bullish momentum will intensify as the RSI approaches overbought territory.
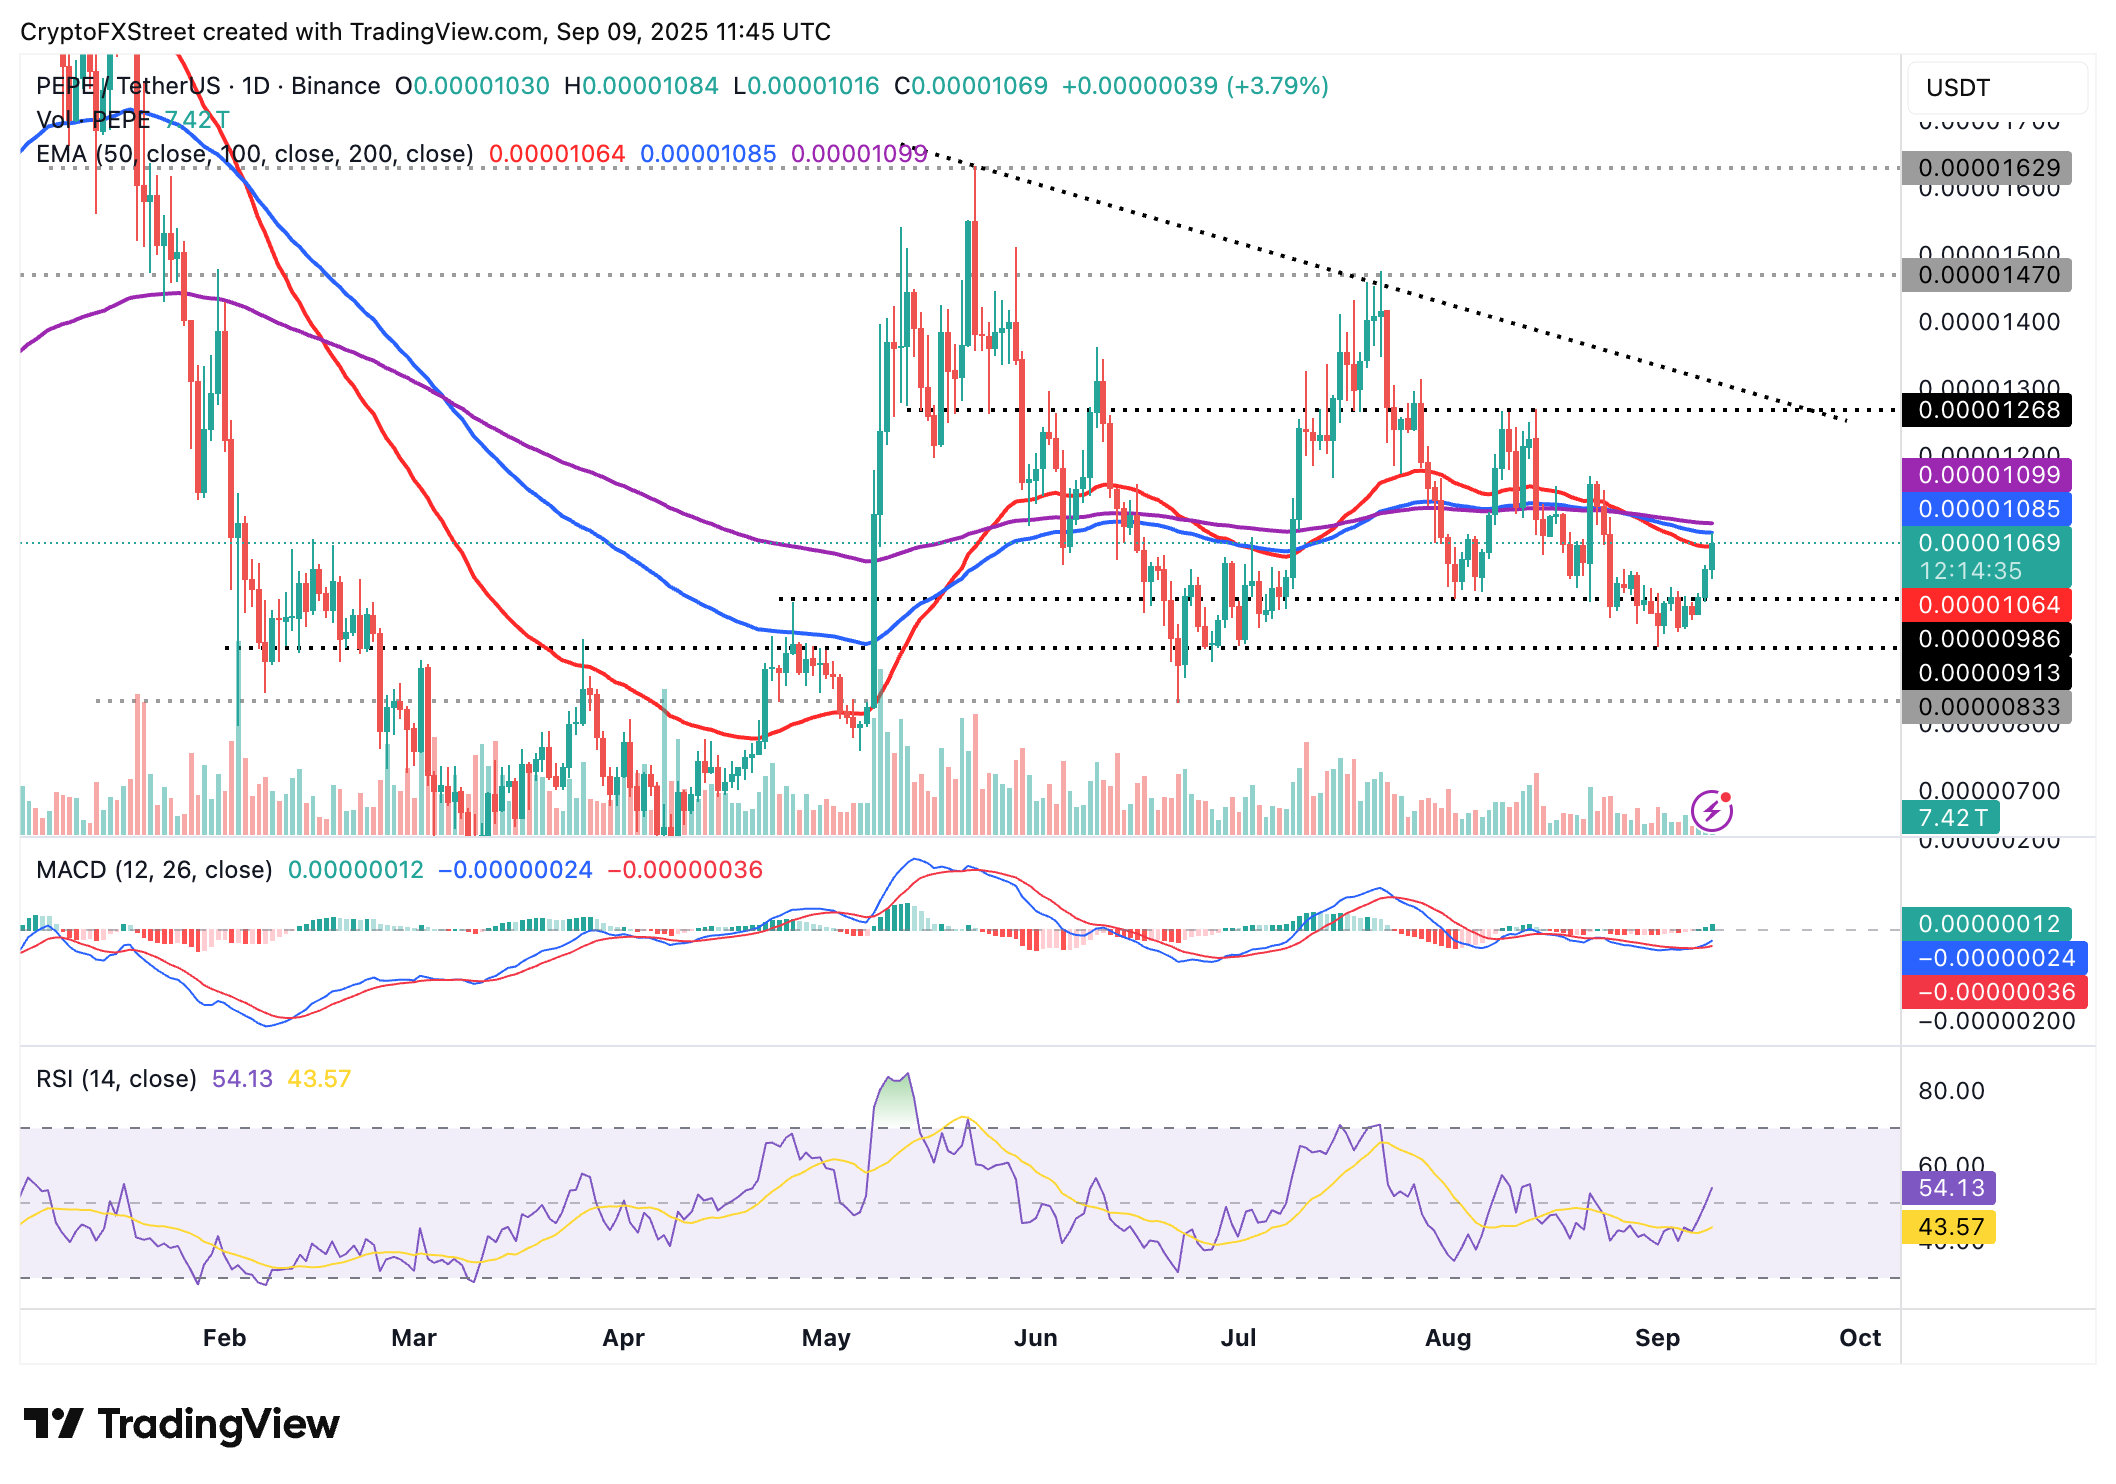
PEPE/USDT daily chart
Key areas of interest to traders are the medium-term resistance at $0.00001268, which was tested on August 10; Pepe’s July local top of $0.00001470; and the supply zone at $0.00001629, previously tested in May.
If early profit booking builds selling pressure and overwhelms bullish momentum, a reversal below the 50-day EMA at $0.00001064 could occur, possibly culminating in a decline toward the demand zone at $0.00000913, last tested on Monday.
Open Interest, funding rate FAQs
Higher Open Interest is associated with higher liquidity and new capital inflow to the market. This is considered the equivalent of increase in efficiency and the ongoing trend continues. When Open Interest decreases, it is considered a sign of liquidation in the market, investors are leaving and the overall demand for an asset is on a decline, fueling a bearish sentiment among investors.
Funding fees bridge the difference between spot prices and prices of futures contracts of an asset by increasing liquidation risks faced by traders. A consistently high and positive funding rate implies there is a bullish sentiment among market participants and there is an expectation of a price hike. A consistently negative funding rate for an asset implies a bearish sentiment, indicating that traders expect the cryptocurrency’s price to fall and a bearish trend reversal is likely to occur.

Acuity Trading
Acuity Trading là công ty fintech có trụ sở tại London, thành lập năm 2013, chuyên về dữ liệu thay thế và phân tích cảm xúc dựa trên AI cho giao dịch và đầu tư. Họ đã cách mạng hóa trải nghiệm giao dịch trực tuyến với các công cụ tin tức và cảm xúc trực quan, và hiện tiếp tục dẫn đầu thị trường với dữ liệu thay thế tạo alpha và các công cụ giao dịch tương tác cao dựa trên nghiên cứu AI mới nhất.
Read More


