
Pippin Price Forecast: PIPPIN rallies over 14%, aiming for record highs
Bởi John Isige
Ngày xuất bản: 23 Feb 2026 | Ngày chỉnh sửa: 23 Feb 2026


BÀI VIẾT PHỔ BIẾN

Pippin (PIPPIN) is rising above $0.70, aiming for the record high of $0.77 at the time of writing on Monday.
- Pippin rebounds above $0.71, defying the broader crypto market's doldrums.
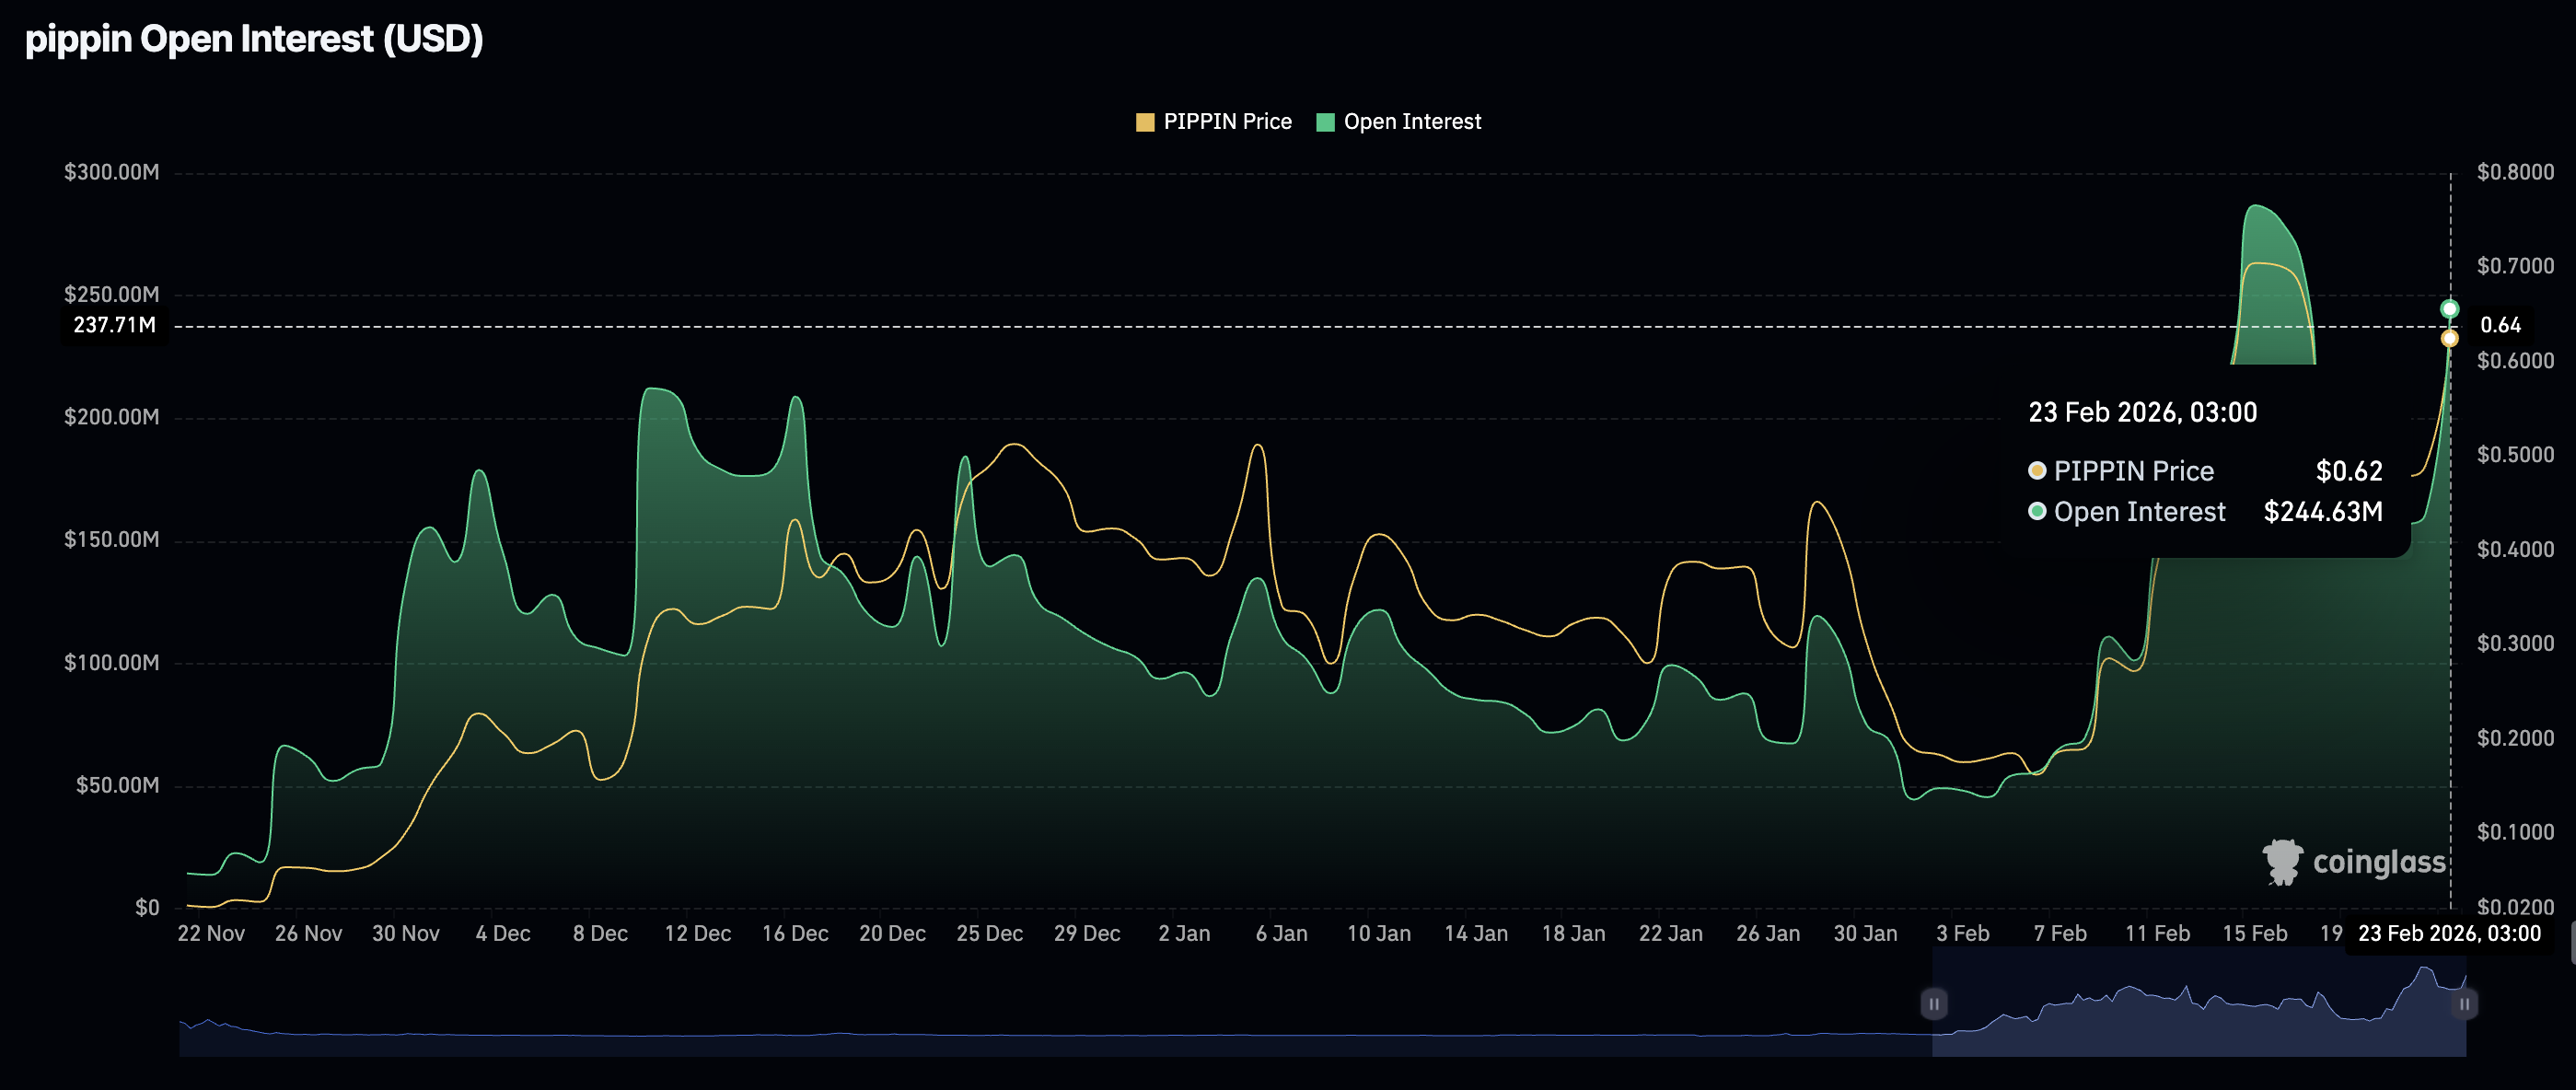
- Retail interest in the AI crypto token returns with futures Open Interest expanding to $245 million on Monday.
- Robust technical indicators, including the MACD and the RSI, support Pippin’s bullish outlook.
Pippin (PIPPIN) is rising above $0.70, aiming for the record high of $0.77 at the time of writing on Monday. The Artificial Intelligence (AI) crypto token appears to defy headwinds in the broader cryptocurrency market, rallying over 14% intraday, 176% in a fortnight and approximately 91% in 30 days, according to CoinGecko.
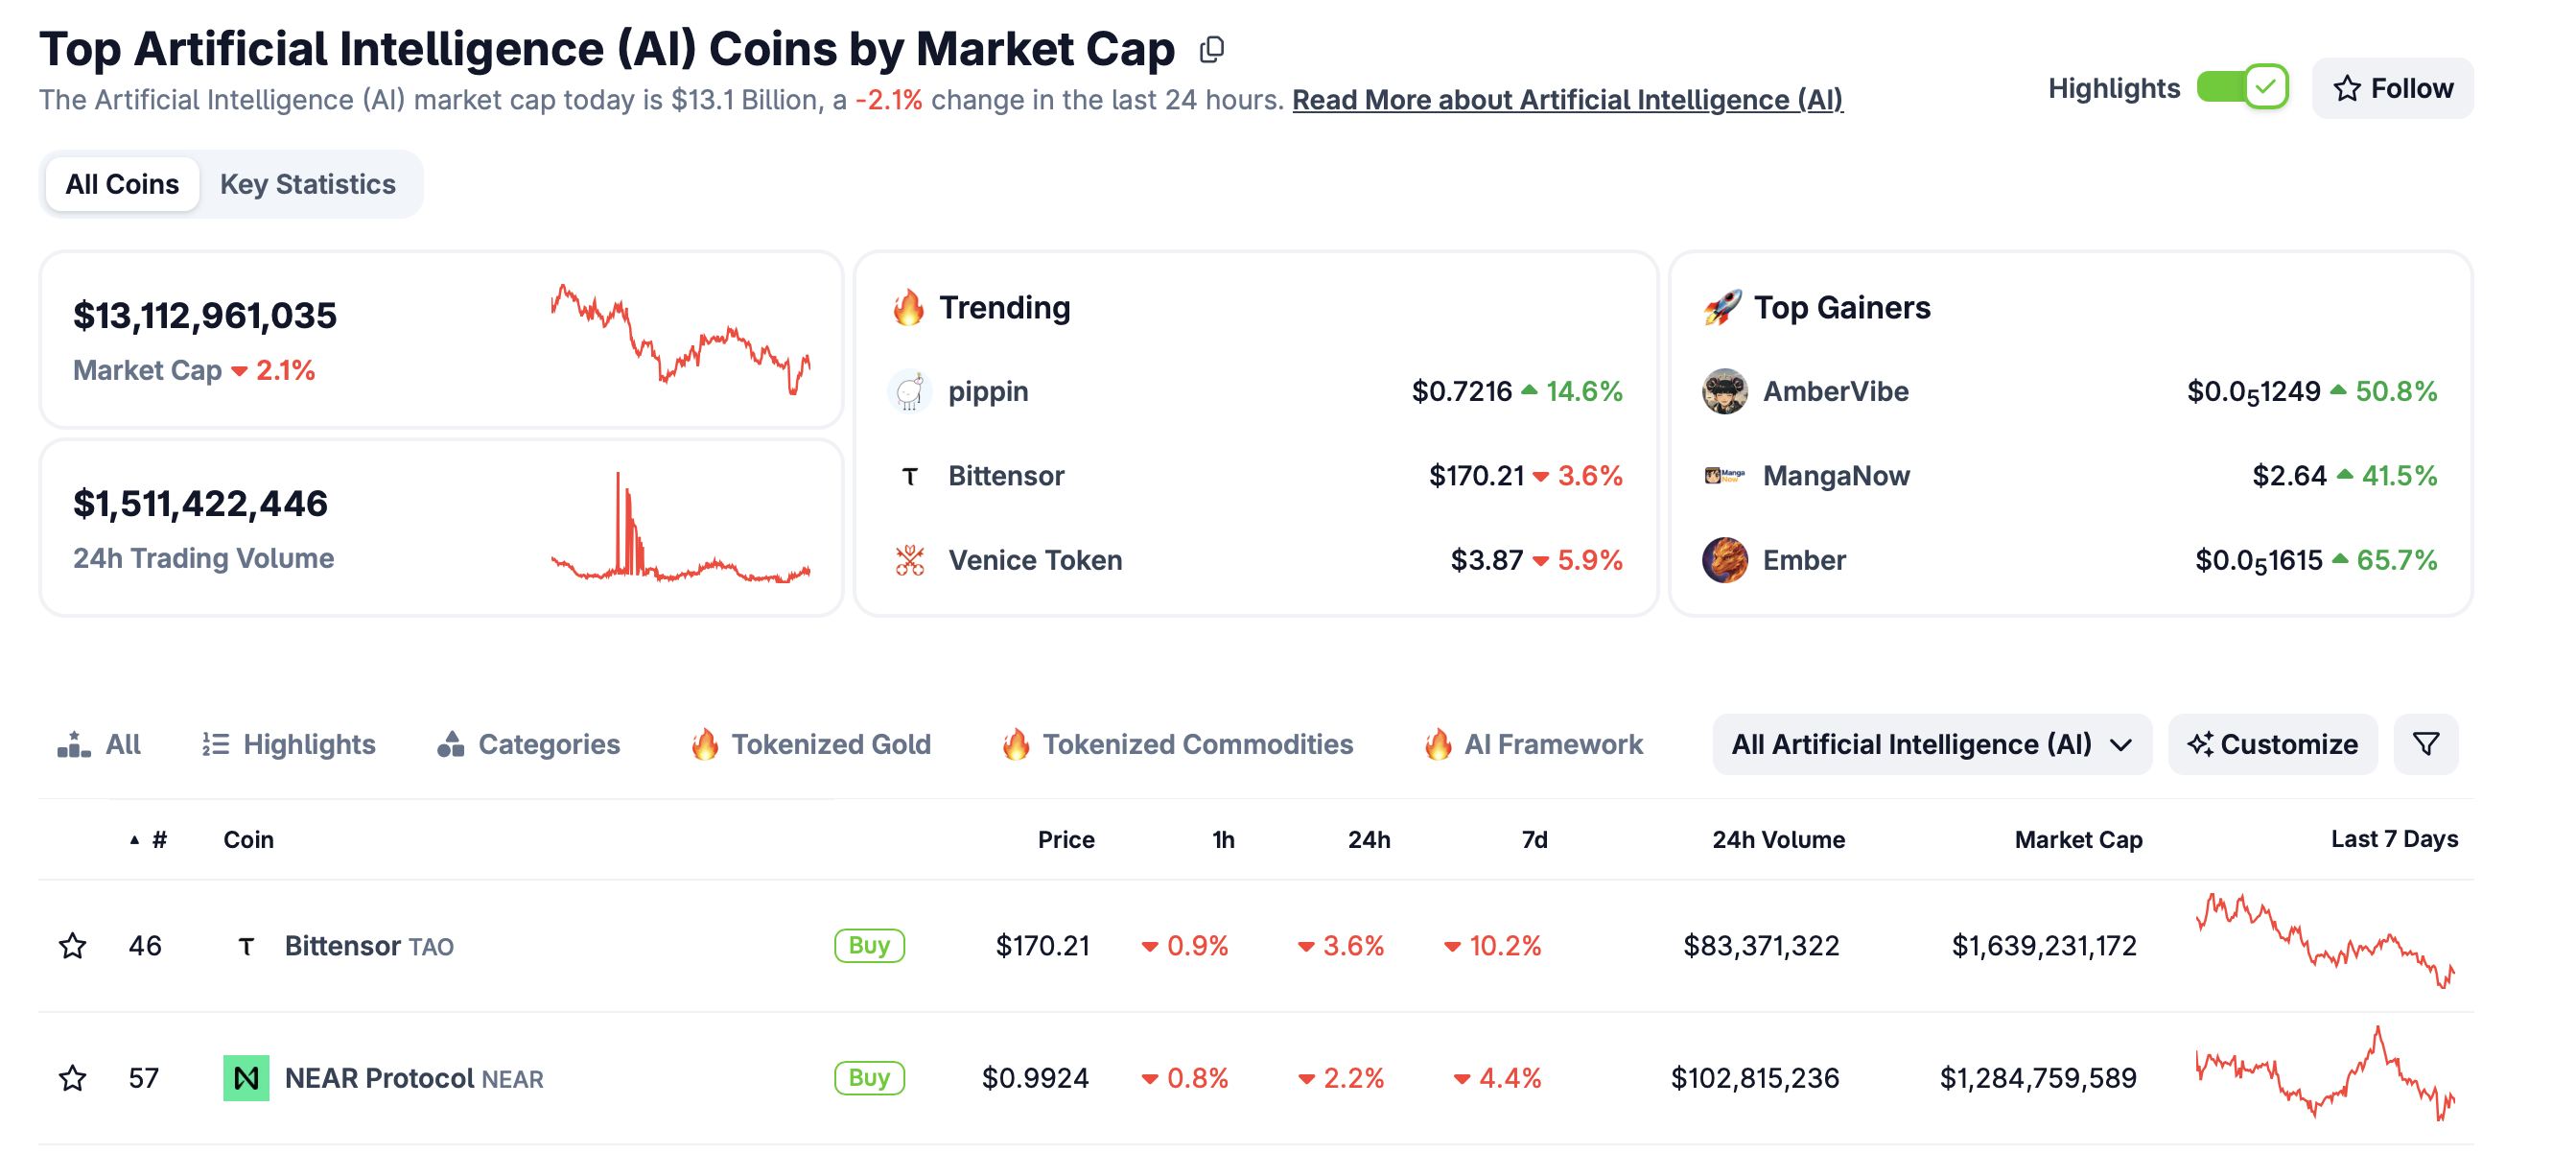
Tokens in the AI crypto segment mirror the overall bearish trend of the larger crypto market. Bittensor (TAO) hovers at $176, down 2.5% over the past 24 hours, while Near Protocol (NEAR) has lost 1.5% in the same period. The sector's total market capitalisation averages $13 billion, down 2% over 24 hours.
Retail demand soars as Pippin explodes
Pippin’s impressive performance is supported by a robust derivatives market, rejecting a significant increase in futures Open Interest (OI) to $245 million on Monday, from $161 million the previous day.
The surge in futures OI suggests that Pippin has the potential to sustain its rally, supported by growing retail confidence, as traders lean into risk.
Technical outlook: Pippin rally in focus
Pippin is holding above $0.70, sitting well above the 50-day Exponential Moving Average (EMA) at $0.41, the 100-day EMA at $0.33 and the 200-day EMA at $0.23. All three moving averages are edging higher, upholding Pippin’s steady price increase.
The Moving Average Convergence Divergence (MACD) indicator remains above its signal line on the daily chart, suggesting that bullish momentum is intact. Green histogram bars expand, calling on traders to increase their exposure.
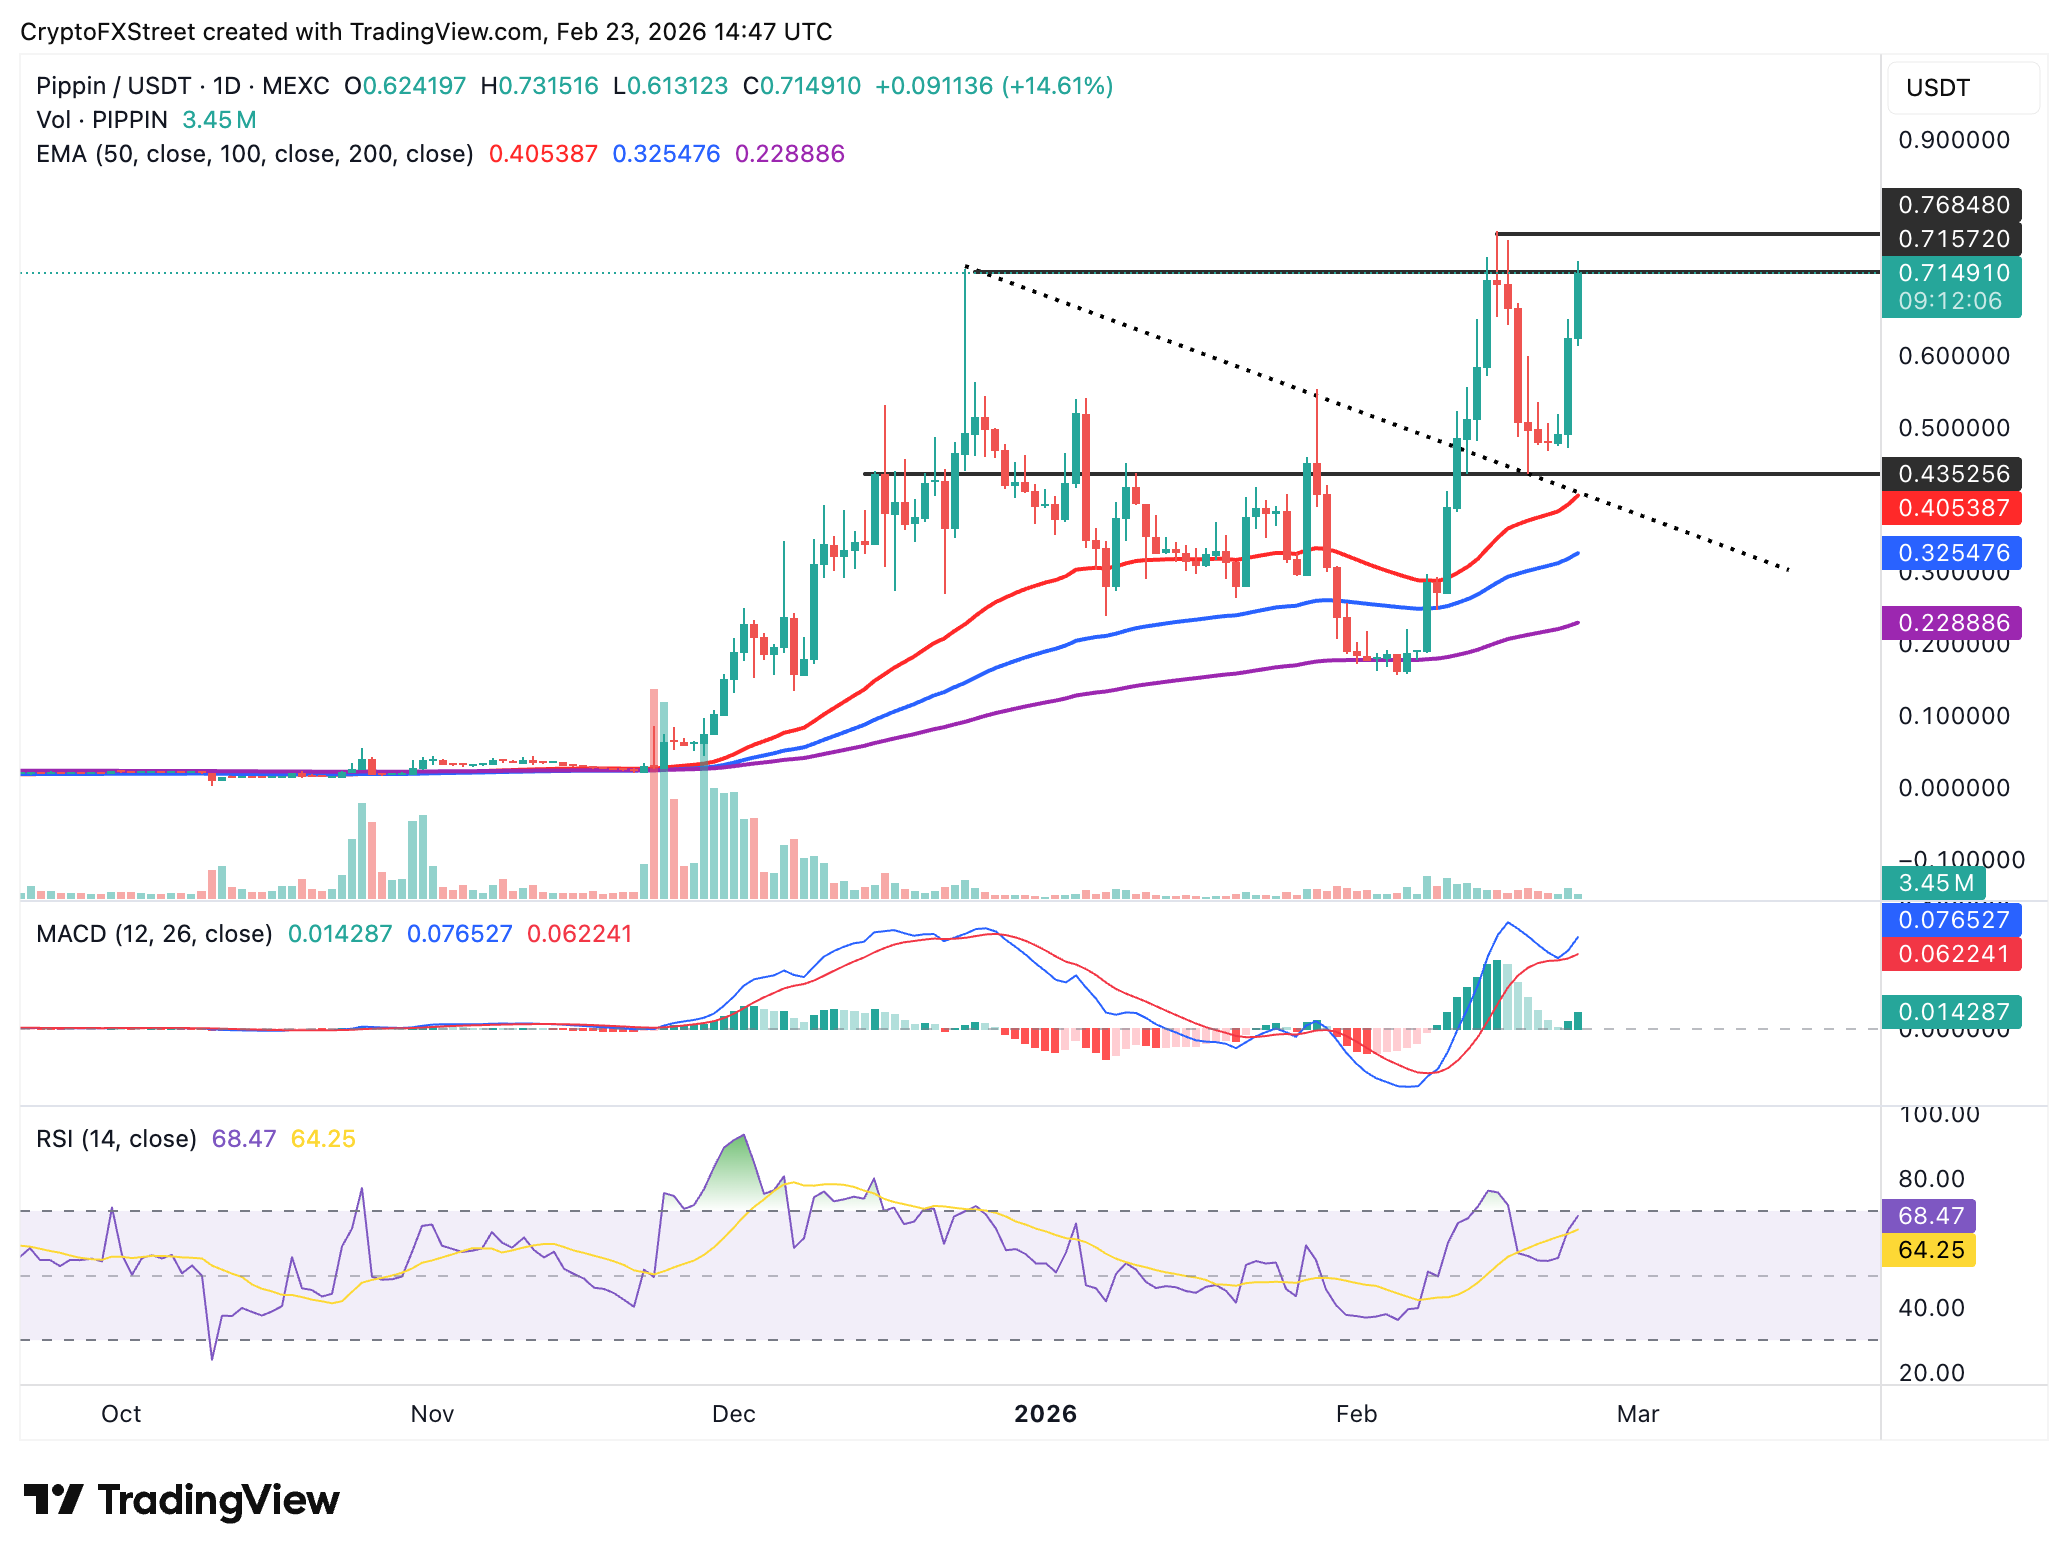
Meanwhile, the Relative Strength Index (RS) at 68 is near overbought territory, which, on one hand, suggests that bullish momentum is at peak levels, but on the other, it cautions that traders should temper their expectations as a correction could be in the offing. A reversal in the RSI toward neutral would trigger profit-taking and contribute to selling pressure. Below the immediate support at $0.70, Pippin may correct to test the January 28 high of $0.55.
Open Interest, funding rate FAQs
Higher Open Interest is associated with higher liquidity and new capital inflow to the market. This is considered the equivalent of increase in efficiency and the ongoing trend continues. When Open Interest decreases, it is considered a sign of liquidation in the market, investors are leaving and the overall demand for an asset is on a decline, fueling a bearish sentiment among investors.
Funding fees bridge the difference between spot prices and prices of futures contracts of an asset by increasing liquidation risks faced by traders. A consistently high and positive funding rate implies there is a bullish sentiment among market participants and there is an expectation of a price hike. A consistently negative funding rate for an asset implies a bearish sentiment, indicating that traders expect the cryptocurrency’s price to fall and a bearish trend reversal is likely to occur.

Acuity Trading là công ty fintech có trụ sở tại London, thành lập năm 2013, chuyên về dữ liệu thay thế và phân tích cảm xúc dựa trên AI cho giao dịch và đầu tư. Họ đã cách mạng hóa trải nghiệm giao dịch trực tuyến với các công cụ tin tức và cảm xúc trực quan, và hiện tiếp tục dẫn đầu thị trường với dữ liệu thay thế tạo alpha và các công cụ giao dịch tương tác cao dựa trên nghiên cứu AI mới nhất.
Đọc thêm


