
XRP declines persist as ETFs show limited impact
Bởi John Isige
Ngày xuất bản: 16 Jan 2026 | Ngày chỉnh sửa: 16 Jan 2026


BÀI VIẾT PHỔ BIẾN

Ripple (XRP) is edging lower toward the pivotal $2.00 level at the time of writing on Friday, marking three consecutive days of declines. The sell-off extends across the crypto market, with Bitcoin (BTC) falling toward $95,000 and Ethereum (ETH) pressing down on support at $3,300.
- XRP extends losses below the 50-day EMA amid a potential return to risk-off sentiment in the broader crypto market.
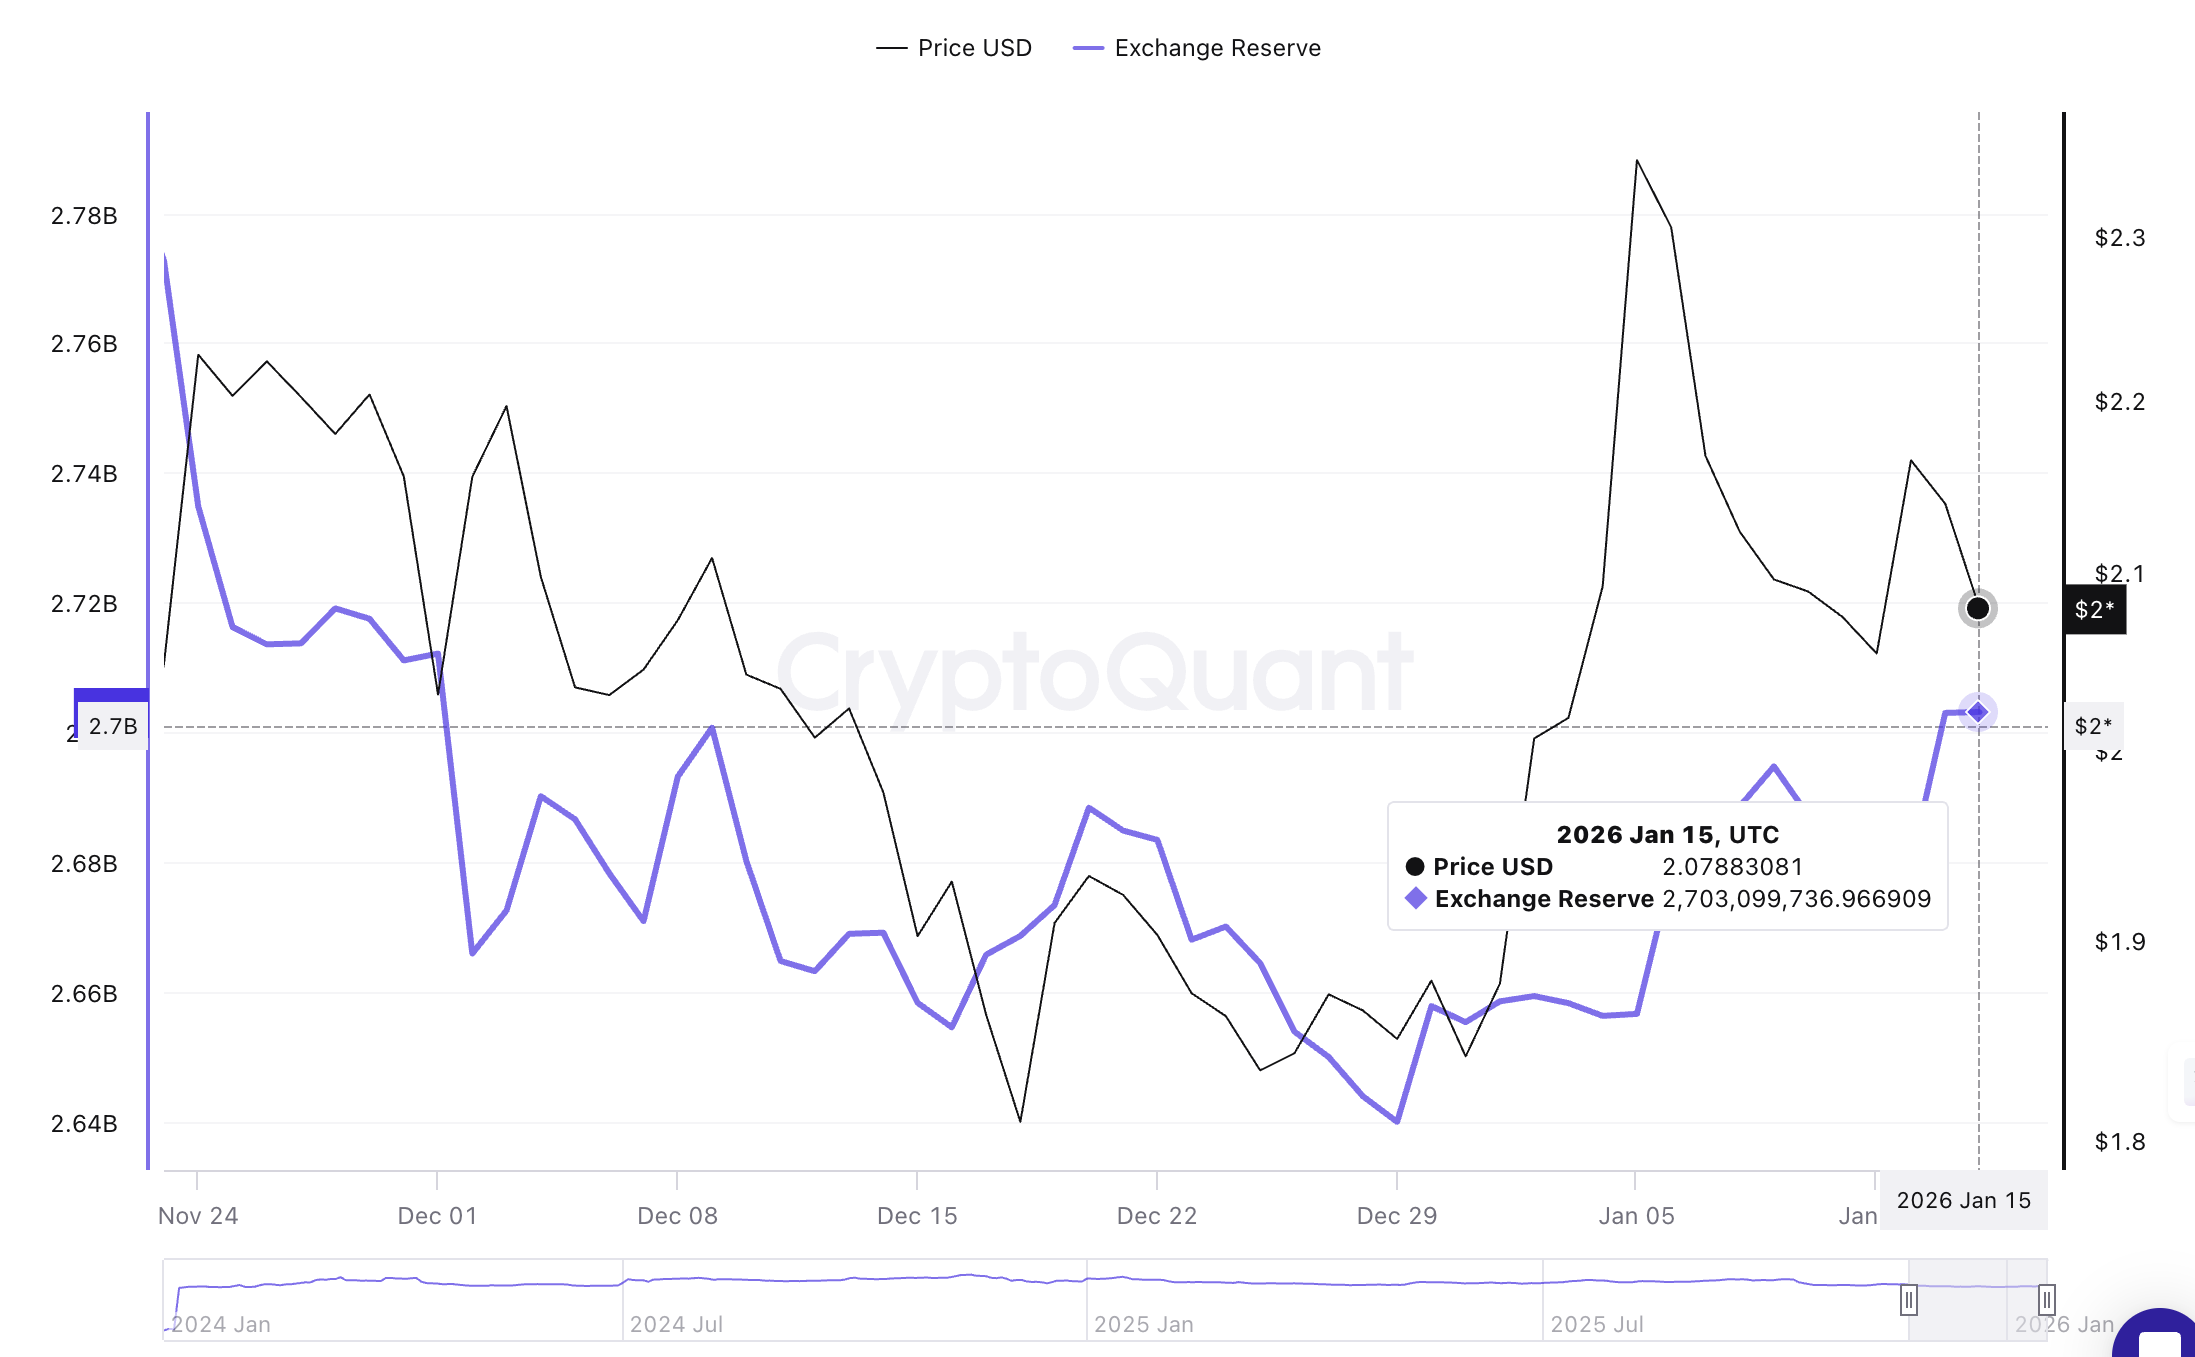
- XRP exchange reserves have grown to 2.7 billion tokens, indicating increased selling pressure.
- Steady demand for spot XRP ETFs fails to strengthen the short-term recovery outlook.
Ripple (XRP) is edging lower toward the pivotal $2.00 level at the time of writing on Friday, marking three consecutive days of declines. The sell-off extends across the crypto market, with Bitcoin (BTC) falling toward $95,000 and Ethereum (ETH) pressing down on support at $3,300.
XRP under pressure as exchange reserves surge
The number of XRP coins held across exchanges has increased to 2.7 billion as of Thursday, from 2.67 billion on Monday. Looking back, XRP exchange reserves stood at 2.64 billion on December 29, suggesting holders are transferring the tokens with the intention of selling when the price rises.
According to CryptoQuant, rising exchange reserves indicate higher selling pressure, which could pose an increased risk to price recovery.
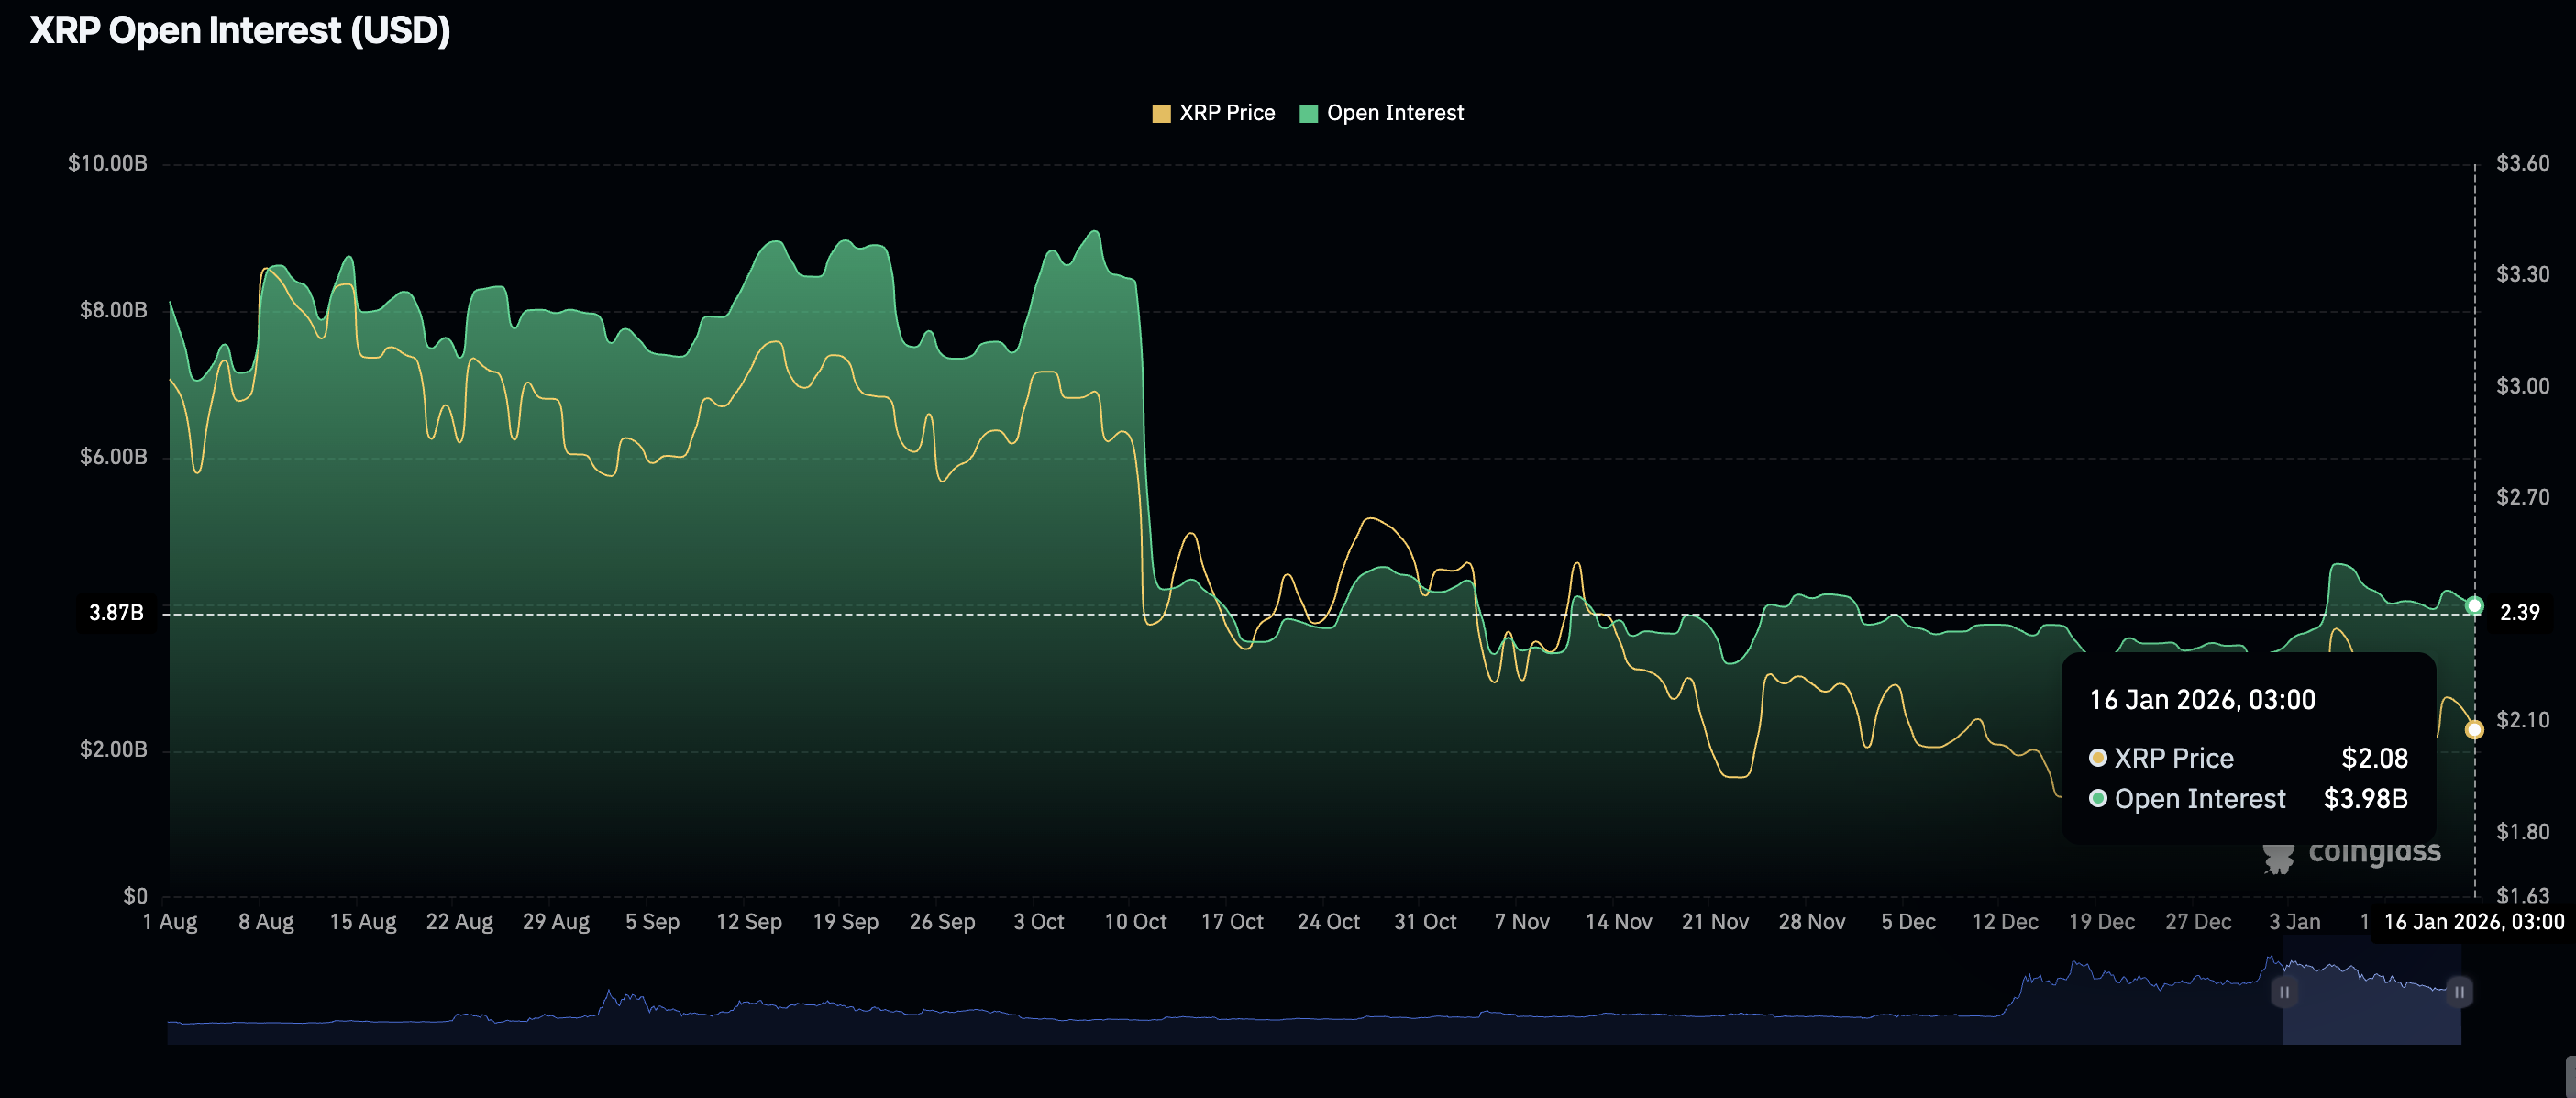
Meanwhile, demand for XRP derivatives has remained weak, falling to $3.98 billion on Friday from $4.08 billion the previous day. The OI peaked at a yearly high of $4.55 billion on January 8, a move that happened a couple of days after XRP rose to $2.42. Further decline in the OI could drive the prices lower.
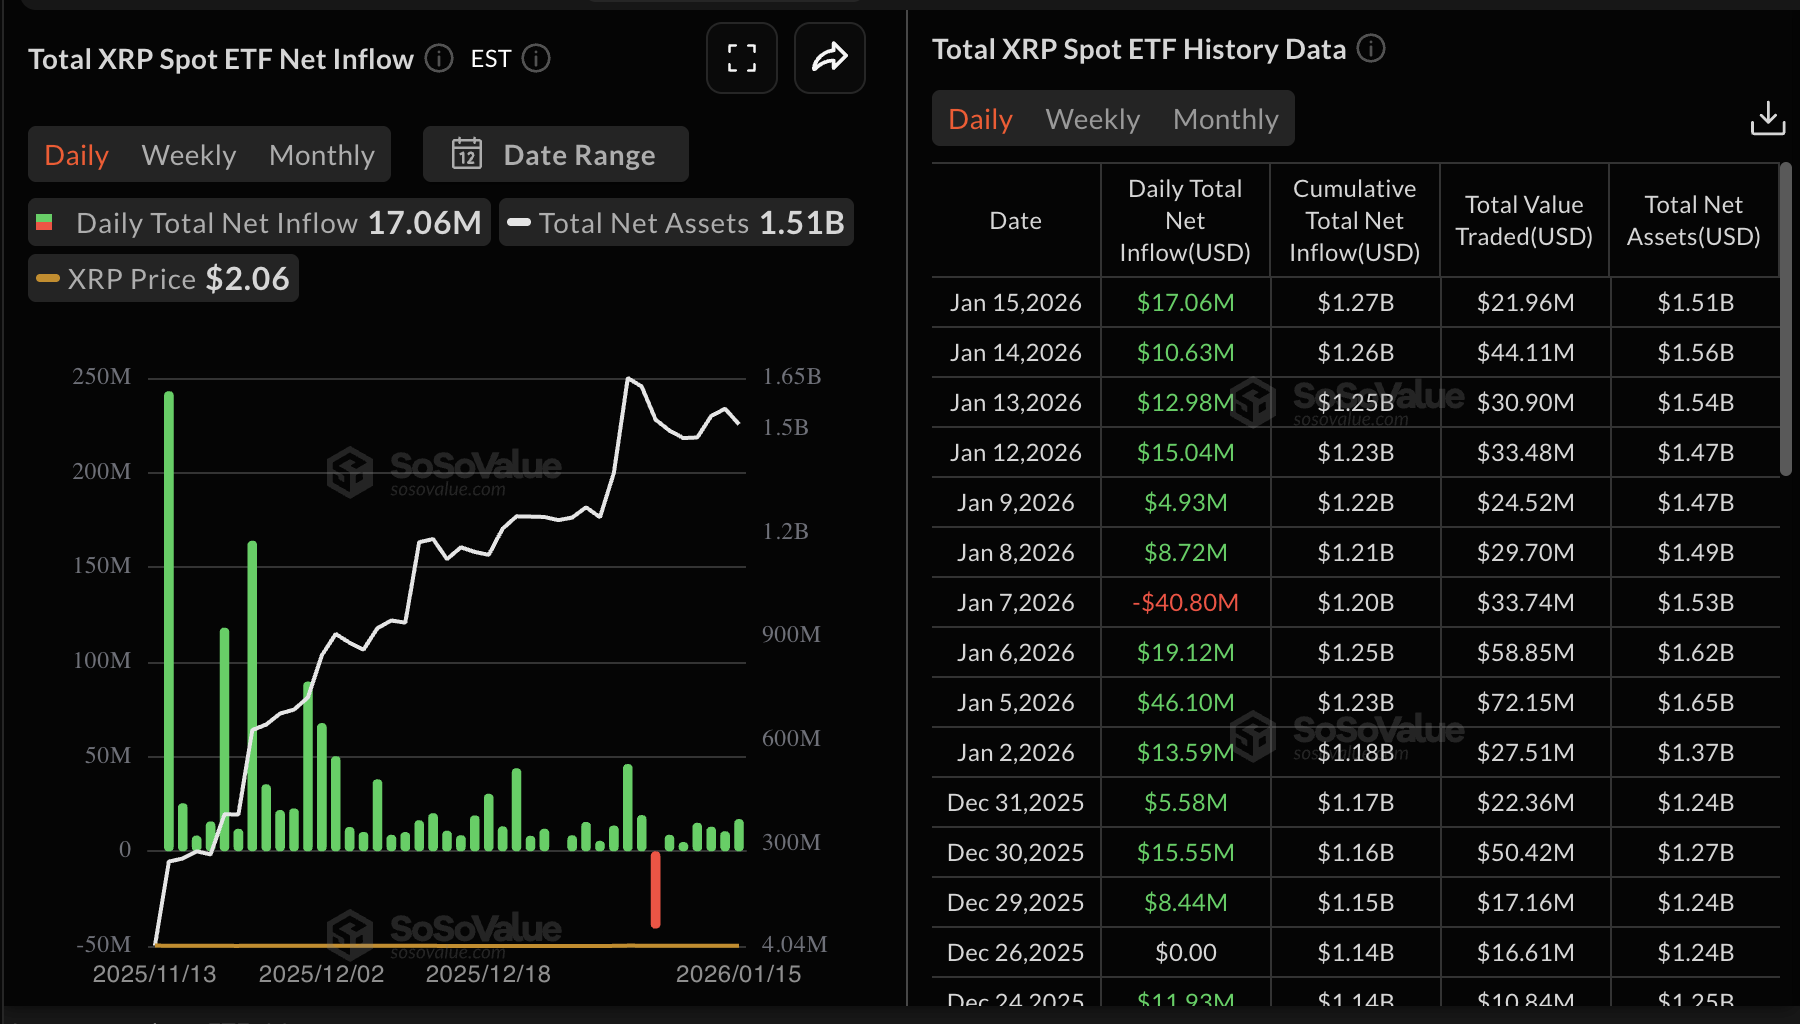
Despite the three-day price correction, institutional sentiment remains relatively positive, as reflected in steady inflows into XRP spot Exchange Traded Funds (ETFs).
US-listed XRP ETFs recorded approximately almost $17 million in inflows on Thursday, up from almost $11 million on Wednesday, according to SoSoValue data. The cumulative inflow stands at $1.27 billion, and the net assets at $1.51 billion, indicating steady investor confidence.
Technical outlook: XRP decline persists as $2.00 support holds
XRP is trading at $2.06 at the time of writing on Friday, as headwinds weigh on the cross-border money remittance token. The 50-day Exponential Moving Average (EMA) at $2.08 caps the immediate upside, preserving the bearish bias.
The Moving Average Convergence Divergence (MACD) has crossed below the signal line on the daily chart, while the histogram bars have turned negative, suggesting downward pressure is building. Bearish influence is poised to increase if the Relative Strength Index (RSI) at 50 on the same chart extends its decline below the midline.
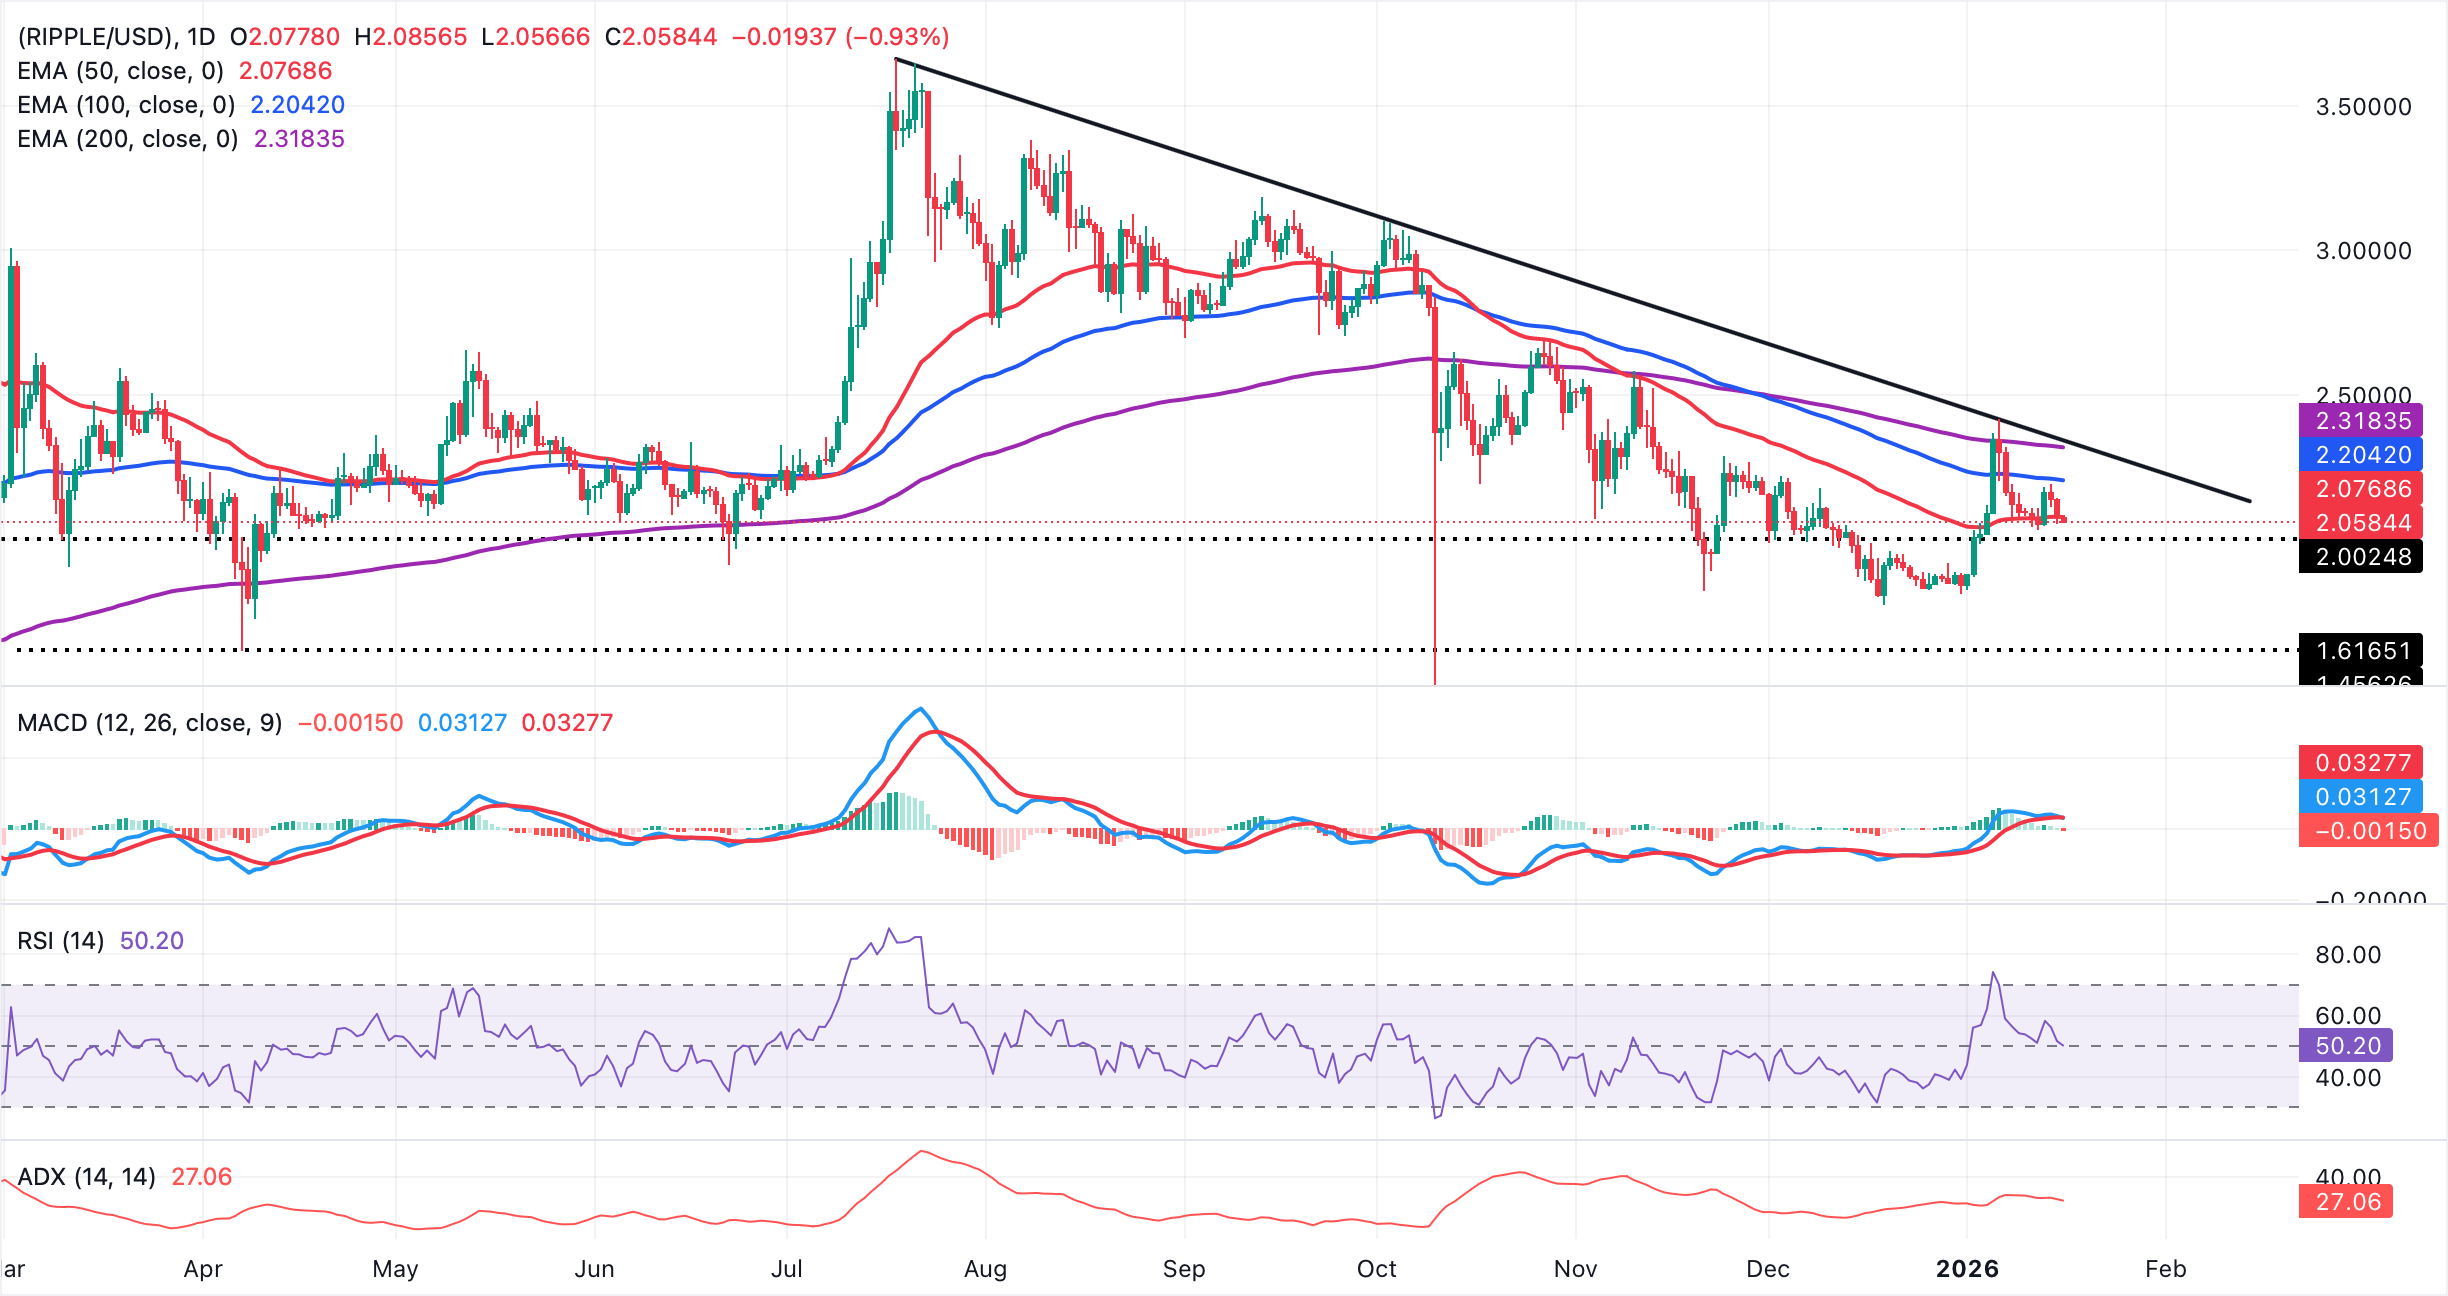
However, closing above the 50-day EMA at $2.08 would ease immediate pressure and open room toward the 100-day EMA at $2.20 and the 200-day EMA at $2.32. Failure to reclaim these barriers keeps the path of least resistance downward.
Open Interest, funding rate FAQs
Higher Open Interest is associated with higher liquidity and new capital inflow to the market. This is considered the equivalent of increase in efficiency and the ongoing trend continues. When Open Interest decreases, it is considered a sign of liquidation in the market, investors are leaving and the overall demand for an asset is on a decline, fueling a bearish sentiment among investors.
Funding fees bridge the difference between spot prices and prices of futures contracts of an asset by increasing liquidation risks faced by traders. A consistently high and positive funding rate implies there is a bullish sentiment among market participants and there is an expectation of a price hike. A consistently negative funding rate for an asset implies a bearish sentiment, indicating that traders expect the cryptocurrency’s price to fall and a bearish trend reversal is likely to occur.
(The technical analysis of this story was written with the help of an AI tool.)

Acuity Trading là công ty fintech có trụ sở tại London, thành lập năm 2013, chuyên về dữ liệu thay thế và phân tích cảm xúc dựa trên AI cho giao dịch và đầu tư. Họ đã cách mạng hóa trải nghiệm giao dịch trực tuyến với các công cụ tin tức và cảm xúc trực quan, và hiện tiếp tục dẫn đầu thị trường với dữ liệu thay thế tạo alpha và các công cụ giao dịch tương tác cao dựa trên nghiên cứu AI mới nhất.
Đọc thêm


