
XRP price analysis: Holds above support as profit supply shrinks
Bởi John Isige
Ngày xuất bản: 9 Dec 2025 | Ngày chỉnh sửa: 9 Dec 2025


BÀI VIẾT PHỔ BIẾN

Ripple (XRP) is extending its consolidation above a key $2.00 support level at the time of writing on Tuesday, as the broader cryptocurrency market struggles with increasing macroeconomic uncertainty.
- XRP remains above short-term support at $2.00, with the 50, 100, and 200-day EMAs capping potential rebounds.
- Supply in profit drops to 42 billion XRP, matching levels last seen in November 2024.
- XRP SOPR resets toward the mean line, hinting at a potential price rebound despite persistent risk-off sentiment.
Ripple (XRP) is extending its consolidation above a key $2.00 support level at the time of writing on Tuesday, as the broader cryptocurrency market struggles with increasing macroeconomic uncertainty.
The Federal Reserve (Fed) is expected to release its monetary policy decision on Wednesday. According to the CME FedWatch Tool, approximately 87% of interest rate traders are expecting a 25-basis-point cut. It would be positive for riskier assets like XRP, Bitcoin (BTC) and Ethereum (ETH) if the Fed lowers interest rates.
However, leaving the rates unchanged may hurt the crypto market as a whole, which could explain the persistent macroeconomic uncertainty.

Can XRP rebound as supply in profit shrinks?
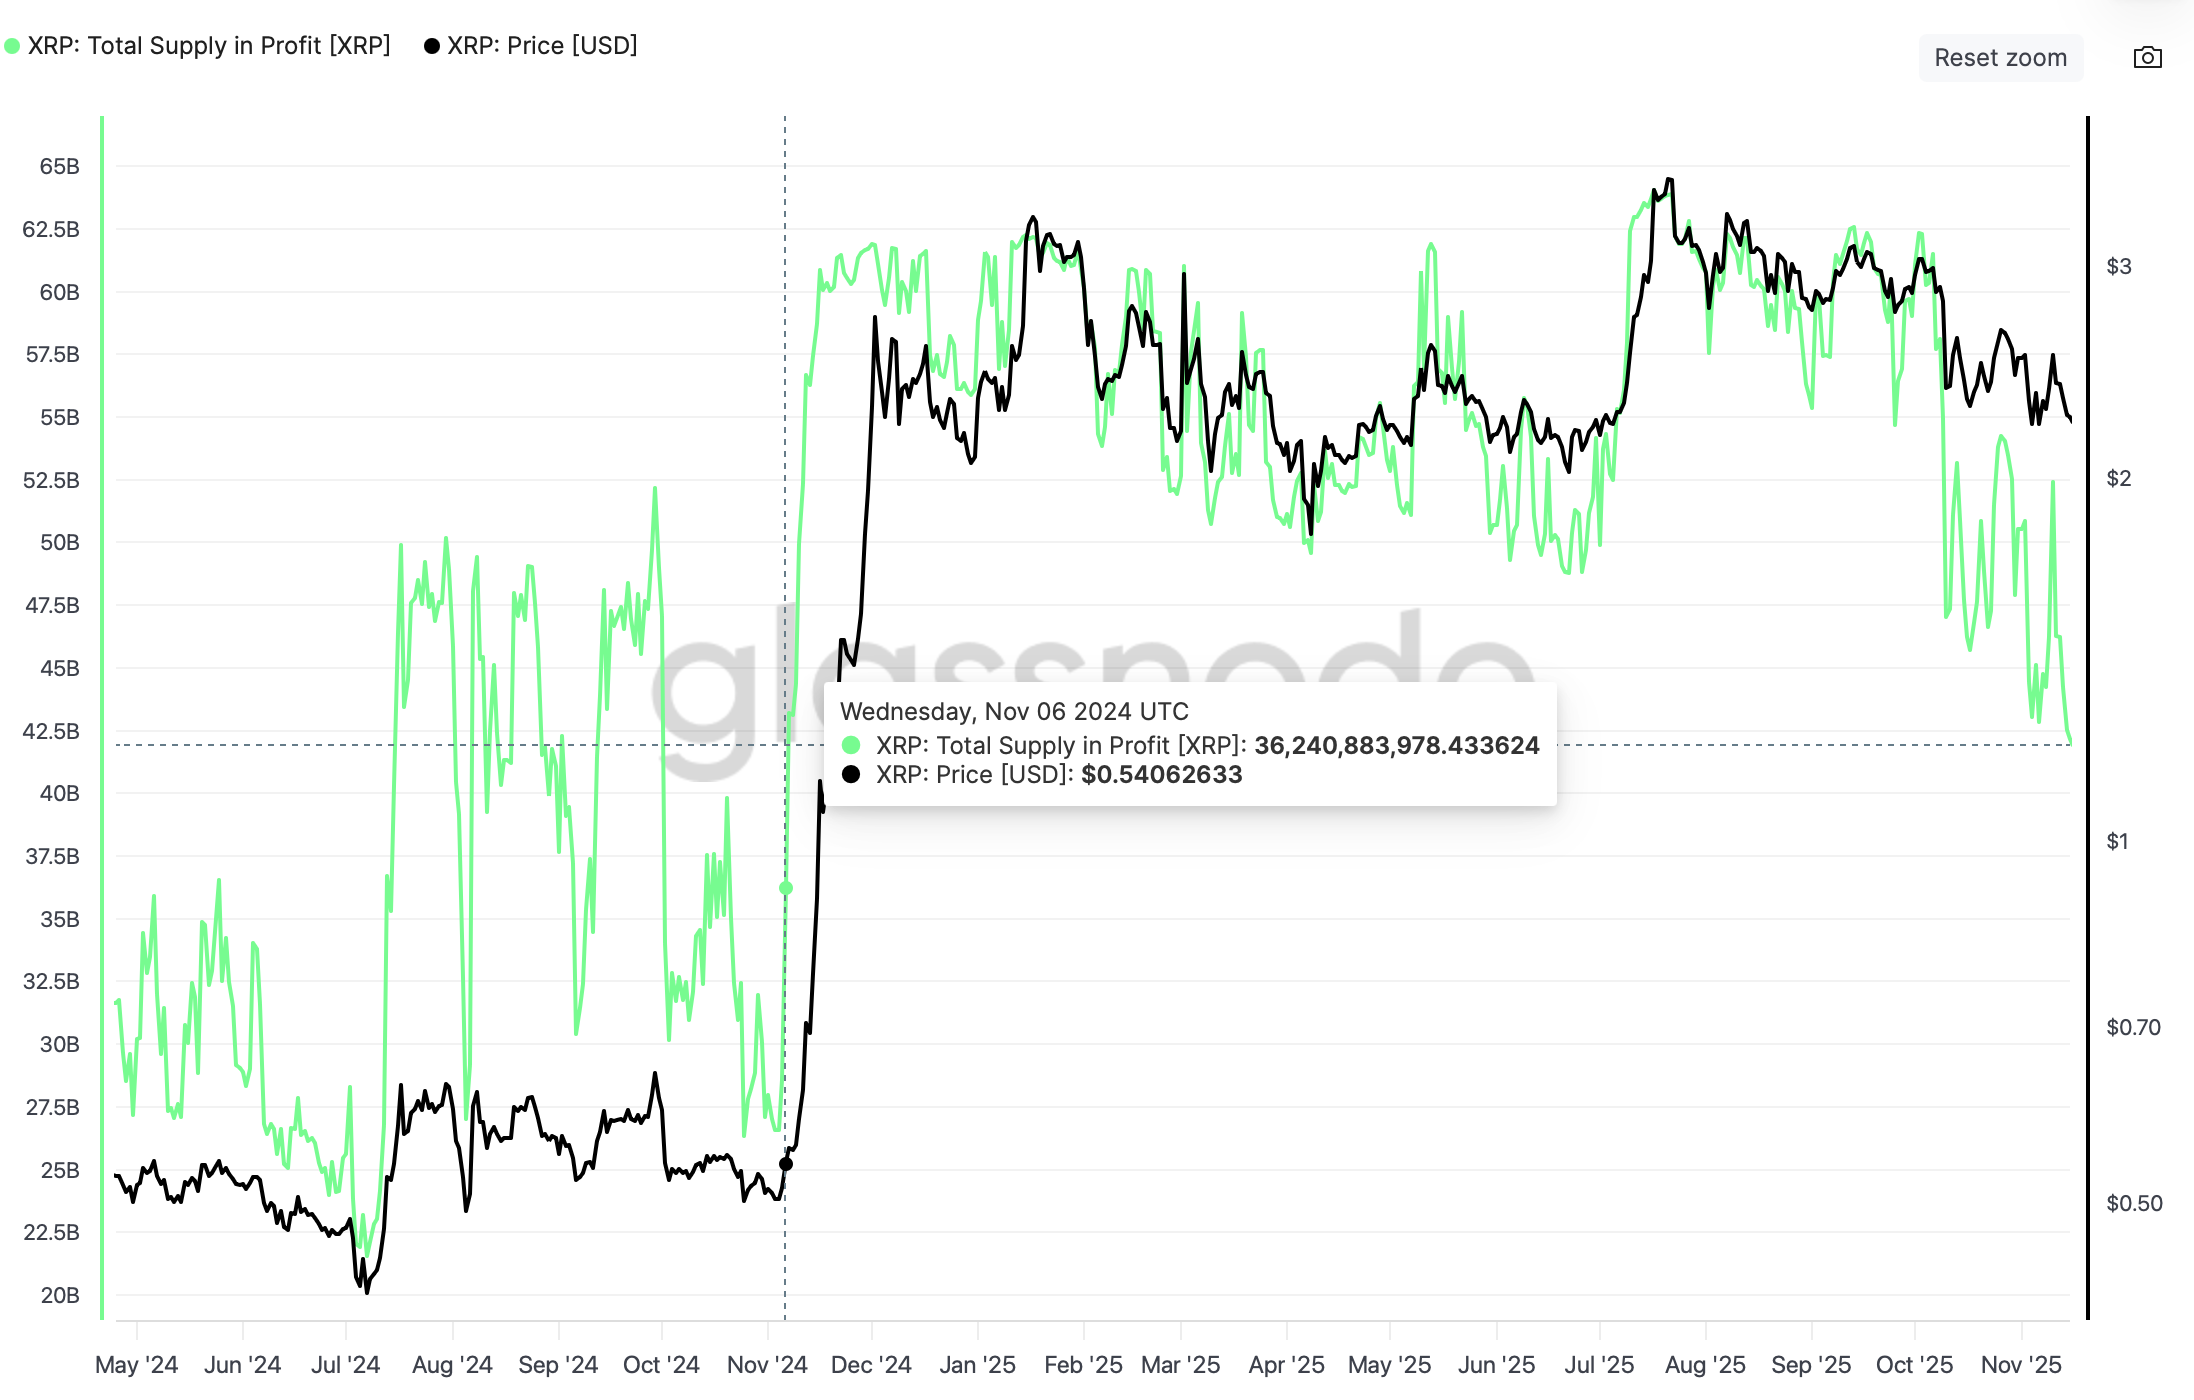
The supply in profit on the XRP Ledger (XRPL) has significantly decreased to 42 billion XRP, from a record high of 68 billion in July. The approximately 38% decline holds near levels last seen in November 2024, suggesting that investors have been taking profit.
,Aggressive selling for profit reduces potential selling pressure, which could pave the way for a rebound in XRP's price. In other words, as supply in profit shrinks, it also narrows the supply available for sale. Traders are unlikely to sell if they are facing unrealized losses.
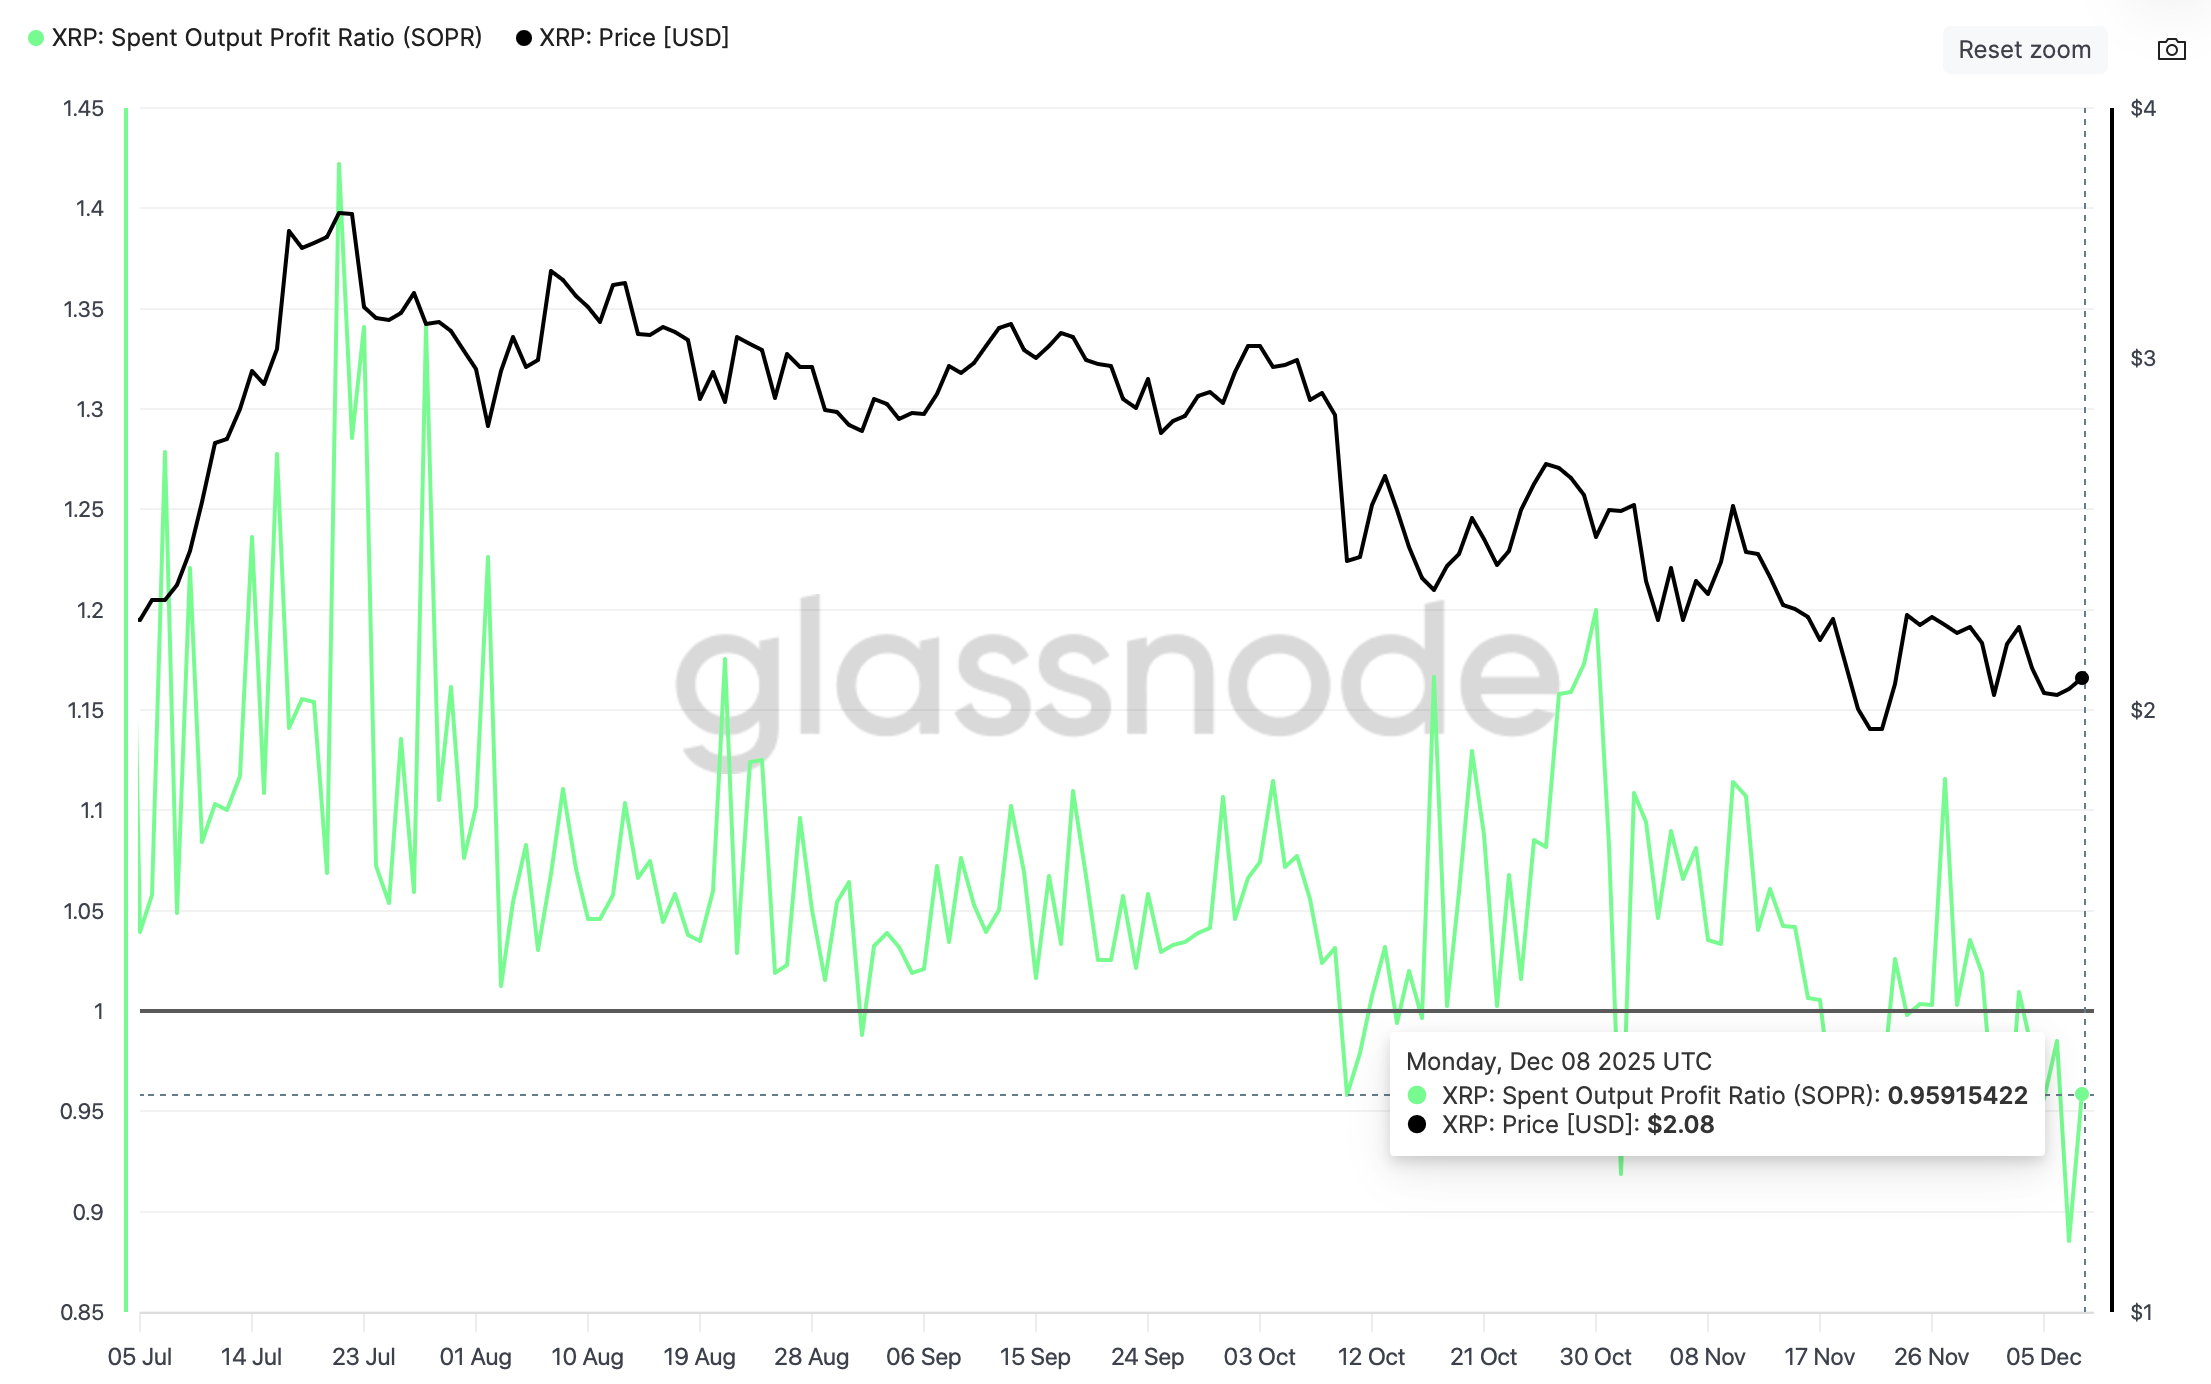
Still on supply dynamics, the Spent Output Profit Ratio (SOPR) is computed by dividing the price at which tokens were sold by the price paid per token. An SOPR value above 1 indicates that investors are facing unrealized gains and are likely to sell. The higher the value is above the mean line, the higher the risk of a correction.
On the other hand, an SOPR value below 1 indicates that investors are facing unrealized losses. With the current SOPR at 0.9591 and rising, XRP could rebound in the short term.
Technical outlook: XRP extends sideways trading
XRP is trading above its $2.00 short-term support, while the 50-day Exponential Moving Average (EMA) at $2.27, 100-day EMA at $2.43 and 200-day EMA at $2.47 slope lower, affirming an overall bearish outlook. The SuperTrend indicator on the daily chart sits at $2.39, reinforcing overhead resistance and keeping rallies capped.
The Relative Strength Index at 45 (neutral) on the same chart shows only modest improvement. A move above 50 could tilt momentum to the upside. Still, the descending trend line from the $3.66 record high limits gains, with resistance seen near $2.60.
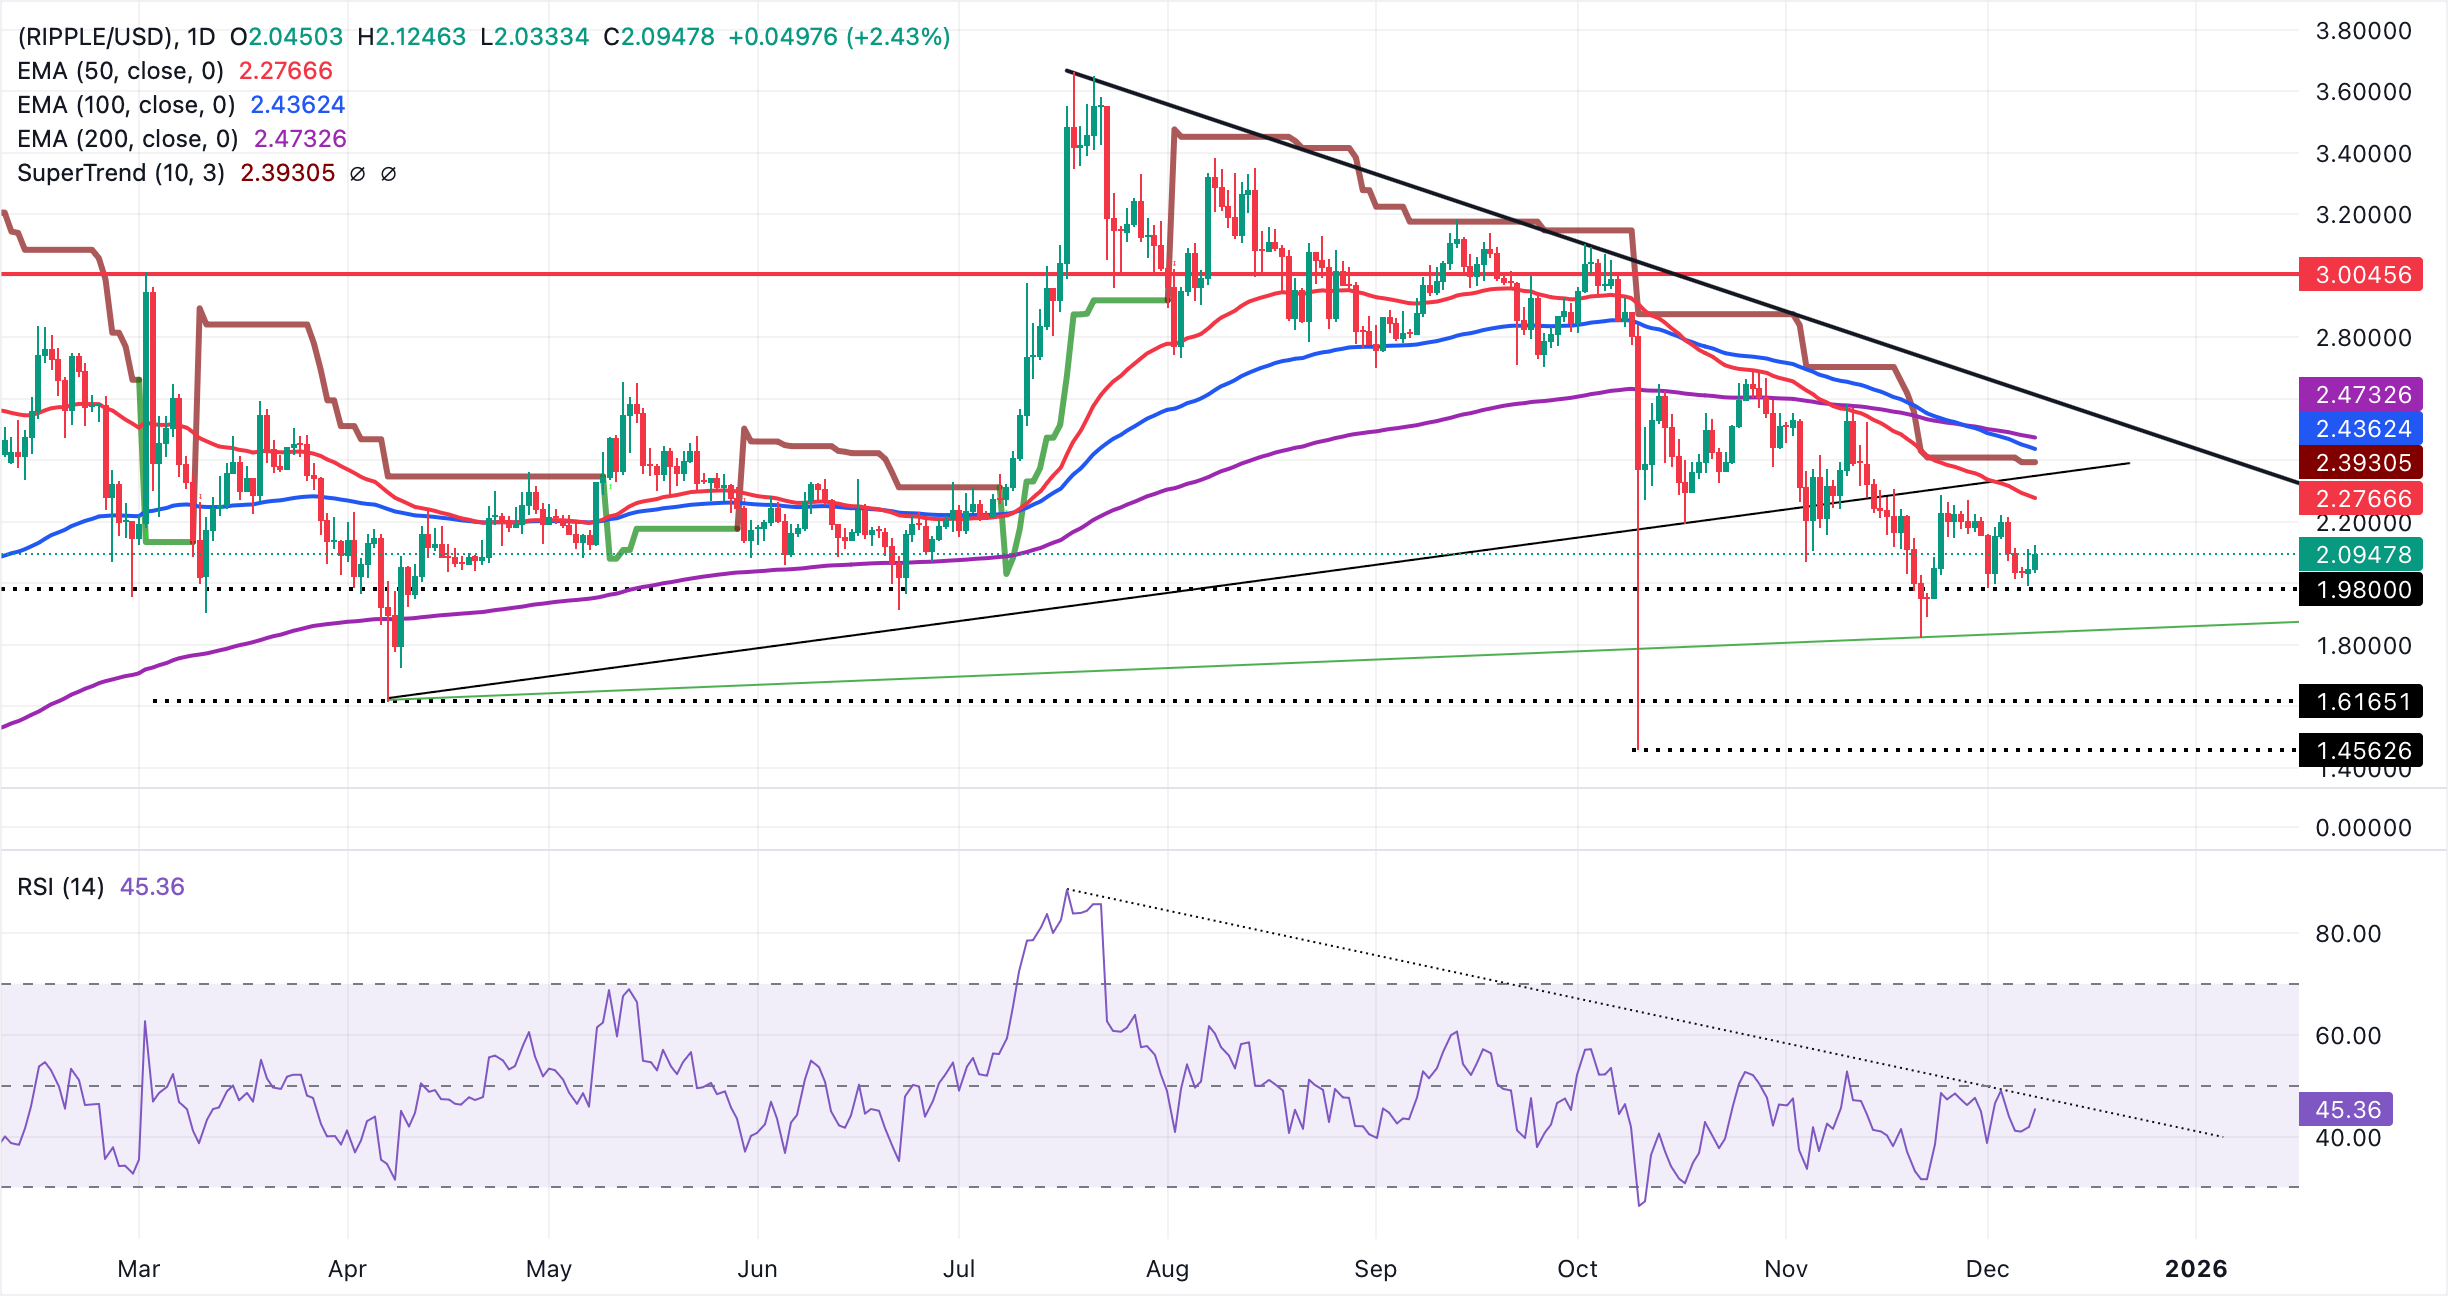
Initial resistance is concentrated between the 50-day and 100-day EMAs at $2.27–$2.43, with $2.60 as a higher barrier on a break of the descending line. On the downside, the rising trend line from $1.62 offers support near $1.82. Reclaiming the 50-day EMA at $2.27 would ease downward pressure and open room for an extended push upward.
Cryptocurrency prices FAQs
Token launches influence demand and adoption among market participants. Listings on crypto exchanges deepen the liquidity for an asset and add new participants to an asset’s network. This is typically bullish for a digital asset.
A hack is an event in which an attacker captures a large volume of the asset from a DeFi bridge or hot wallet of an exchange or any other crypto platform via exploits, bugs or other methods. The exploiter then transfers these tokens out of the exchange platforms to ultimately sell or swap the assets for other cryptocurrencies or stablecoins. Such events often involve an en masse panic triggering a sell-off in the affected assets.
Macroeconomic events like the US Federal Reserve’s decision on interest rates influence crypto assets mainly through the direct impact they have on the US Dollar. An increase in interest rate typically negatively influences Bitcoin and altcoin prices, and vice versa. If the US Dollar index declines, risk assets and associated leverage for trading gets cheaper, in turn driving crypto prices higher.
Halvings are typically considered bullish events as they slash the block reward in half for miners, constricting the supply of the asset. At consistent demand if the supply reduces, the asset’s price climbs.
(The technical analysis of this story was written with the help of an AI tool)

Acuity Trading là công ty fintech có trụ sở tại London, thành lập năm 2013, chuyên về dữ liệu thay thế và phân tích cảm xúc dựa trên AI cho giao dịch và đầu tư. Họ đã cách mạng hóa trải nghiệm giao dịch trực tuyến với các công cụ tin tức và cảm xúc trực quan, và hiện tiếp tục dẫn đầu thị trường với dữ liệu thay thế tạo alpha và các công cụ giao dịch tương tác cao dựa trên nghiên cứu AI mới nhất.
Đọc thêm


