
Trade The World
Silver Price Forecast: XAG/USD tests $41.50 barrier near 14-year highs
Bởi Akhtar Faruqui
Ngày xuất bản: 9 Sep 2025 | Ngày chỉnh sửa: 9 Sep 2025


POPULAR ARTICLES

Silver price (XAG/USD) remains steady after two days of gains, trading around $41.40 per troy ounce during the early European hours on Tuesday.
- Silver price may approach the 14-year high at $41.67, reached on Monday.
- The 14-day Relative Strength Index suggests Silver is overbought, but the trend stays strong.
- The nine-day EMA of $40.62 may act as the initial support.
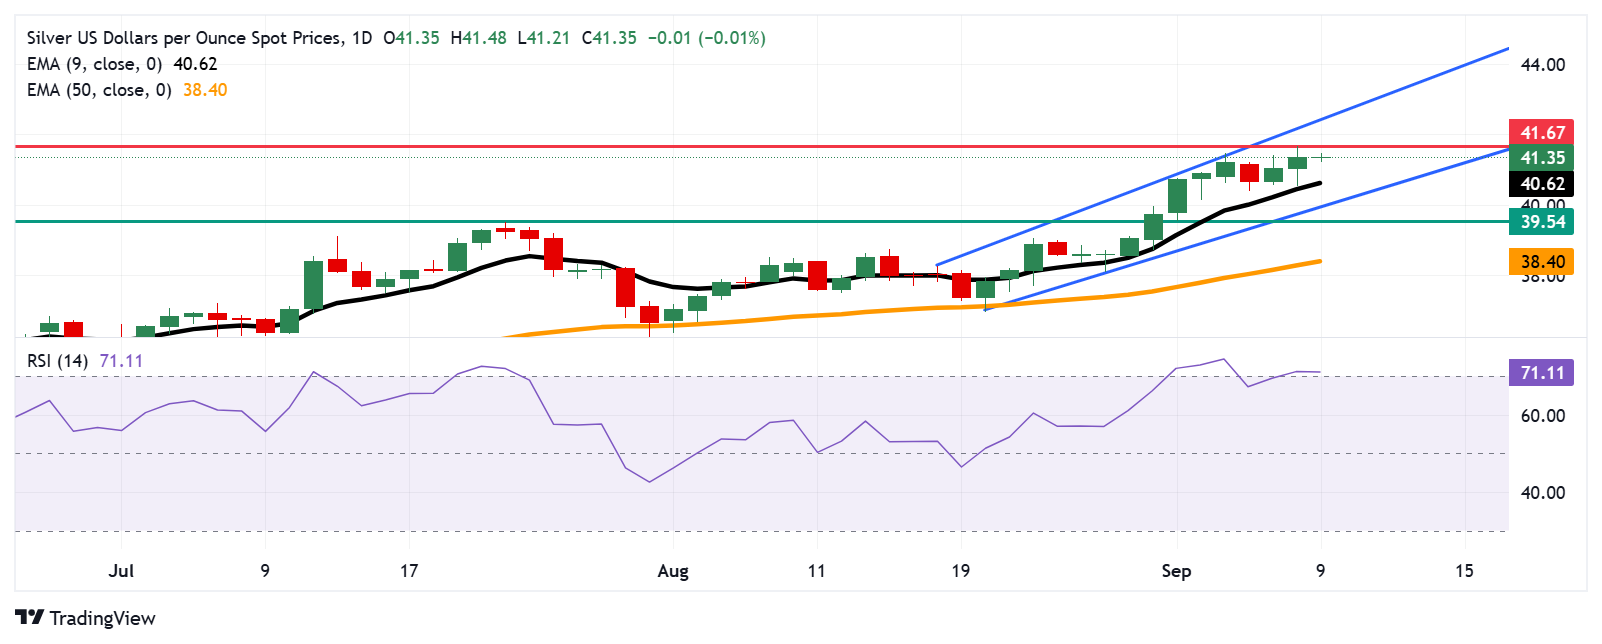
Silver price (XAG/USD) remains steady after two days of gains, trading around $41.40 per troy ounce during the early European hours on Tuesday. The technical analysis of the daily chart suggests the price of the precious metal moves upwards within an ascending channel pattern, indicating the market bias is bullish.
The 14-day Relative Strength Index (RSI) is positioned slightly above the 70 level, suggesting that the Silver price is trading in overbought territory and a possible downward correction any time soon. However, the prevailing uptrend remains strong with buyers maintaining control. Additionally, the XAG/USD pair is trading above the nine-day Exponential Moving Average (EMA), indicating that short-term price momentum is stronger.
On the upside, the XAG/USD pair is testing a crucial barrier at $41.50, followed by the $41.67, the highest since September 2011, reached on September 8, followed by the upper boundary of the ascending channel around the psychological level of $42.50. A decisive break above the channel would strengthen the bullish bias and pave the way for the metal to approach the crucial level of $43.00.
The XAG/USD pair may find its initial support at the nine-day EMA of $40.62, followed by the ascending channel’s lower boundary around $40.10, followed by the psychological level of $40.00 and the monthly low of $39.54, which was recorded on September 1. Further declines below this crucial support zone would dampen the bullish bias and put downward pressure on the Silver price to reach the 50-day EMA of $38.40.
XAG/USD: Daily Chart
Silver FAQs
Silver is a precious metal highly traded among investors. It has been historically used as a store of value and a medium of exchange. Although less popular than Gold, traders may turn to Silver to diversify their investment portfolio, for its intrinsic value or as a potential hedge during high-inflation periods. Investors can buy physical Silver, in coins or in bars, or trade it through vehicles such as Exchange Traded Funds, which track its price on international markets.
Silver prices can move due to a wide range of factors. Geopolitical instability or fears of a deep recession can make Silver price escalate due to its safe-haven status, although to a lesser extent than Gold's. As a yieldless asset, Silver tends to rise with lower interest rates. Its moves also depend on how the US Dollar (USD) behaves as the asset is priced in dollars (XAG/USD). A strong Dollar tends to keep the price of Silver at bay, whereas a weaker Dollar is likely to propel prices up. Other factors such as investment demand, mining supply – Silver is much more abundant than Gold – and recycling rates can also affect prices.
Silver is widely used in industry, particularly in sectors such as electronics or solar energy, as it has one of the highest electric conductivity of all metals – more than Copper and Gold. A surge in demand can increase prices, while a decline tends to lower them. Dynamics in the US, Chinese and Indian economies can also contribute to price swings: for the US and particularly China, their big industrial sectors use Silver in various processes; in India, consumers’ demand for the precious metal for jewellery also plays a key role in setting prices.
Silver prices tend to follow Gold's moves. When Gold prices rise, Silver typically follows suit, as their status as safe-haven assets is similar. The Gold/Silver ratio, which shows the number of ounces of Silver needed to equal the value of one ounce of Gold, may help to determine the relative valuation between both metals. Some investors may consider a high ratio as an indicator that Silver is undervalued, or Gold is overvalued. On the contrary, a low ratio might suggest that Gold is undervalued relative to Silver.

Acuity Trading
Acuity Trading là công ty fintech có trụ sở tại London, thành lập năm 2013, chuyên về dữ liệu thay thế và phân tích cảm xúc dựa trên AI cho giao dịch và đầu tư. Họ đã cách mạng hóa trải nghiệm giao dịch trực tuyến với các công cụ tin tức và cảm xúc trực quan, và hiện tiếp tục dẫn đầu thị trường với dữ liệu thay thế tạo alpha và các công cụ giao dịch tương tác cao dựa trên nghiên cứu AI mới nhất.
Read More


