
Solana Price Forecast: SOL rises despite mixed ETF, derivatives activity
Bởi Vishal Dixit
Ngày xuất bản: 9 Mar 2026 | Ngày chỉnh sửa: 9 Mar 2026


BÀI VIẾT PHỔ BIẾN

Solana (SOL) is up nearly 2% at press time on Monday, staging a minor recovery after four consecutive days of losses. Institutional confidence in Solana is mixed, as two consecutive daily outflows last week capped weekly net inflow at $24 million.
- Solana extends gains on Monday after four consecutive days of losses.
- Solana ETFs recorded $24 million in net inflows last week, but outflows in the last two trading sessions signal short-term weakness.
- Derivatives market shows a rise in bullish activity despite intense long liquidations in the last 24 hours.
Solana (SOL) is up nearly 2% at press time on Monday, staging a minor recovery after four consecutive days of losses. Institutional confidence in Solana is mixed, as two consecutive daily outflows last week capped weekly net inflow at $24 million. Derivatives data shows retail demand resurfacing in the short term despite liquidations totaling roughly $20 million over the last 24 hours.
Technically, Solana remains trapped in a consolidation range, but the declining buying pressure skews the bias bearish.
Could institutions rebalance their SOL holdings?
The US spot Solana Exchange Traded Funds (ETFs) hold roughly $800 million in SOL as of Friday. The confidence of institutional investors sustained the wipeout of more than 65% of Solana's market capitalization over the last six months as ETFs recorded just two weekly net outflows, totaling roughly $11 million. This keeps the cumulative net inflow at $957 million on Friday, projecting no major restructuring during the correction period.
However, the two consecutive outflows at the end of last week were $5.23 million and $8.23 million, capping the weekly inflow to $24.05 million. These outflows are consistent with rising downside pressure on the broader cryptocurrency market stemming from the US-Iran war and rising oil prices.
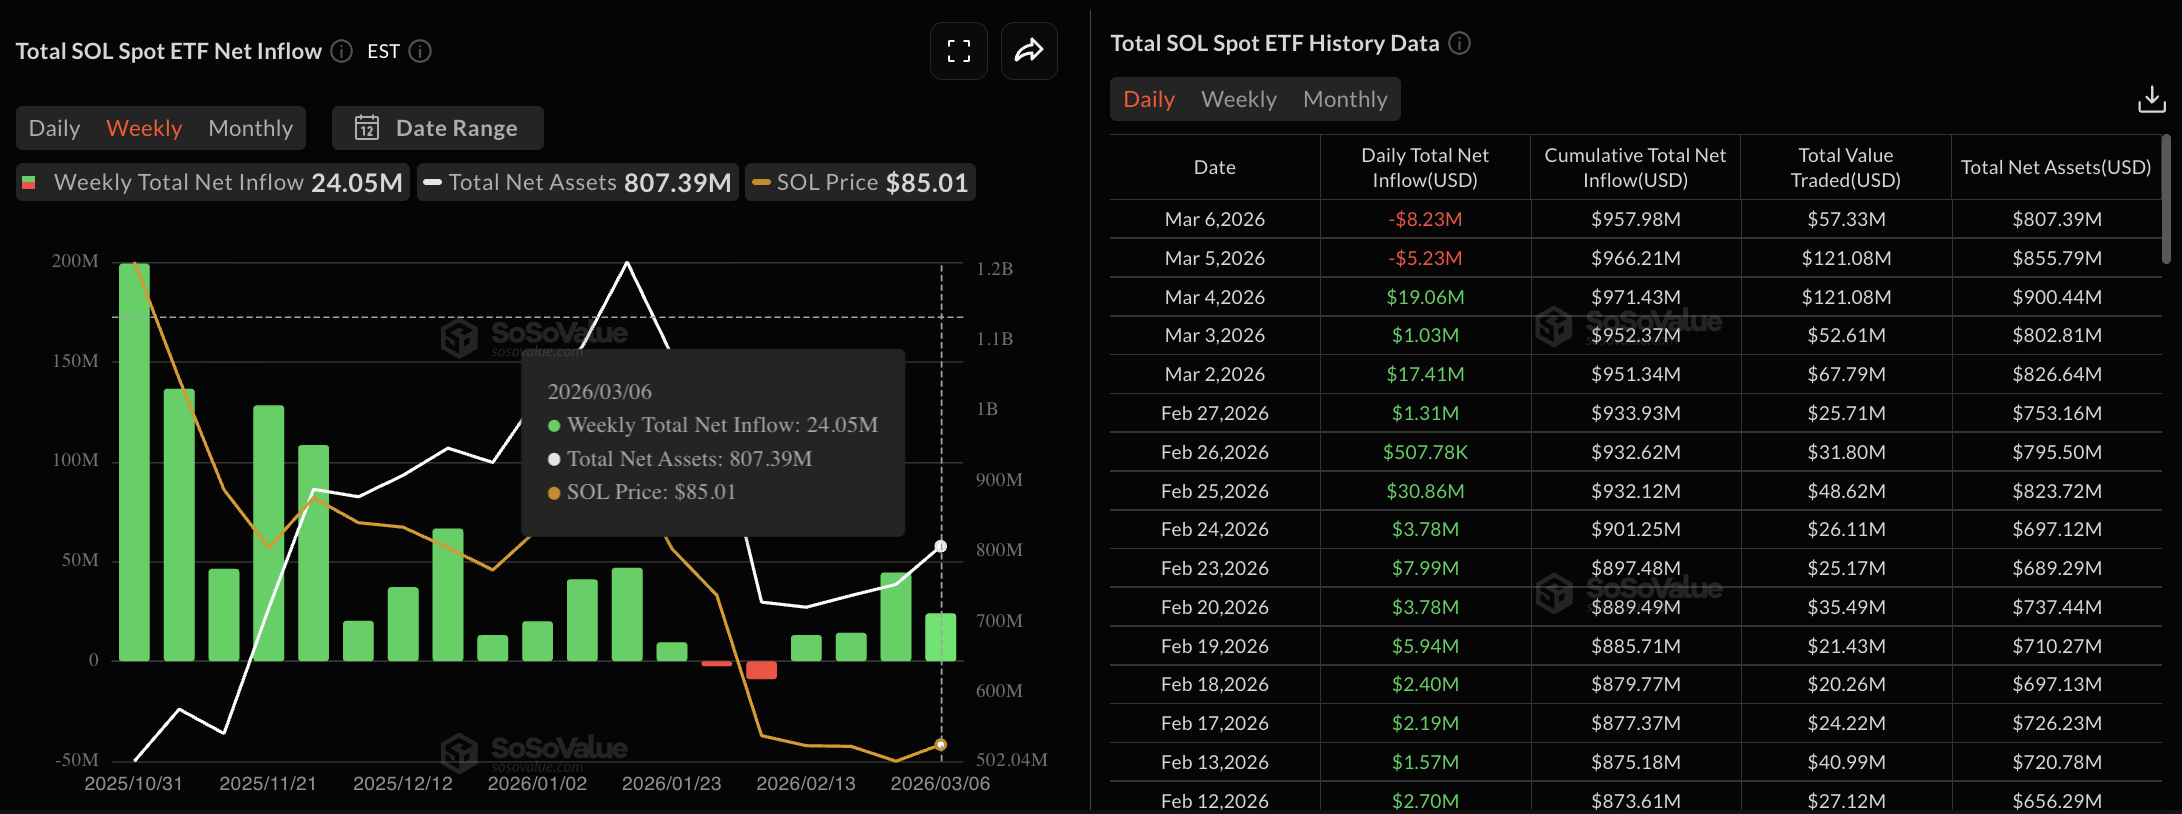
If Solana ETFs record consistent outflows this week, it will confirm a loss of institutional interest and flag significant downside risk.
Derivatives market shows short-term confidence
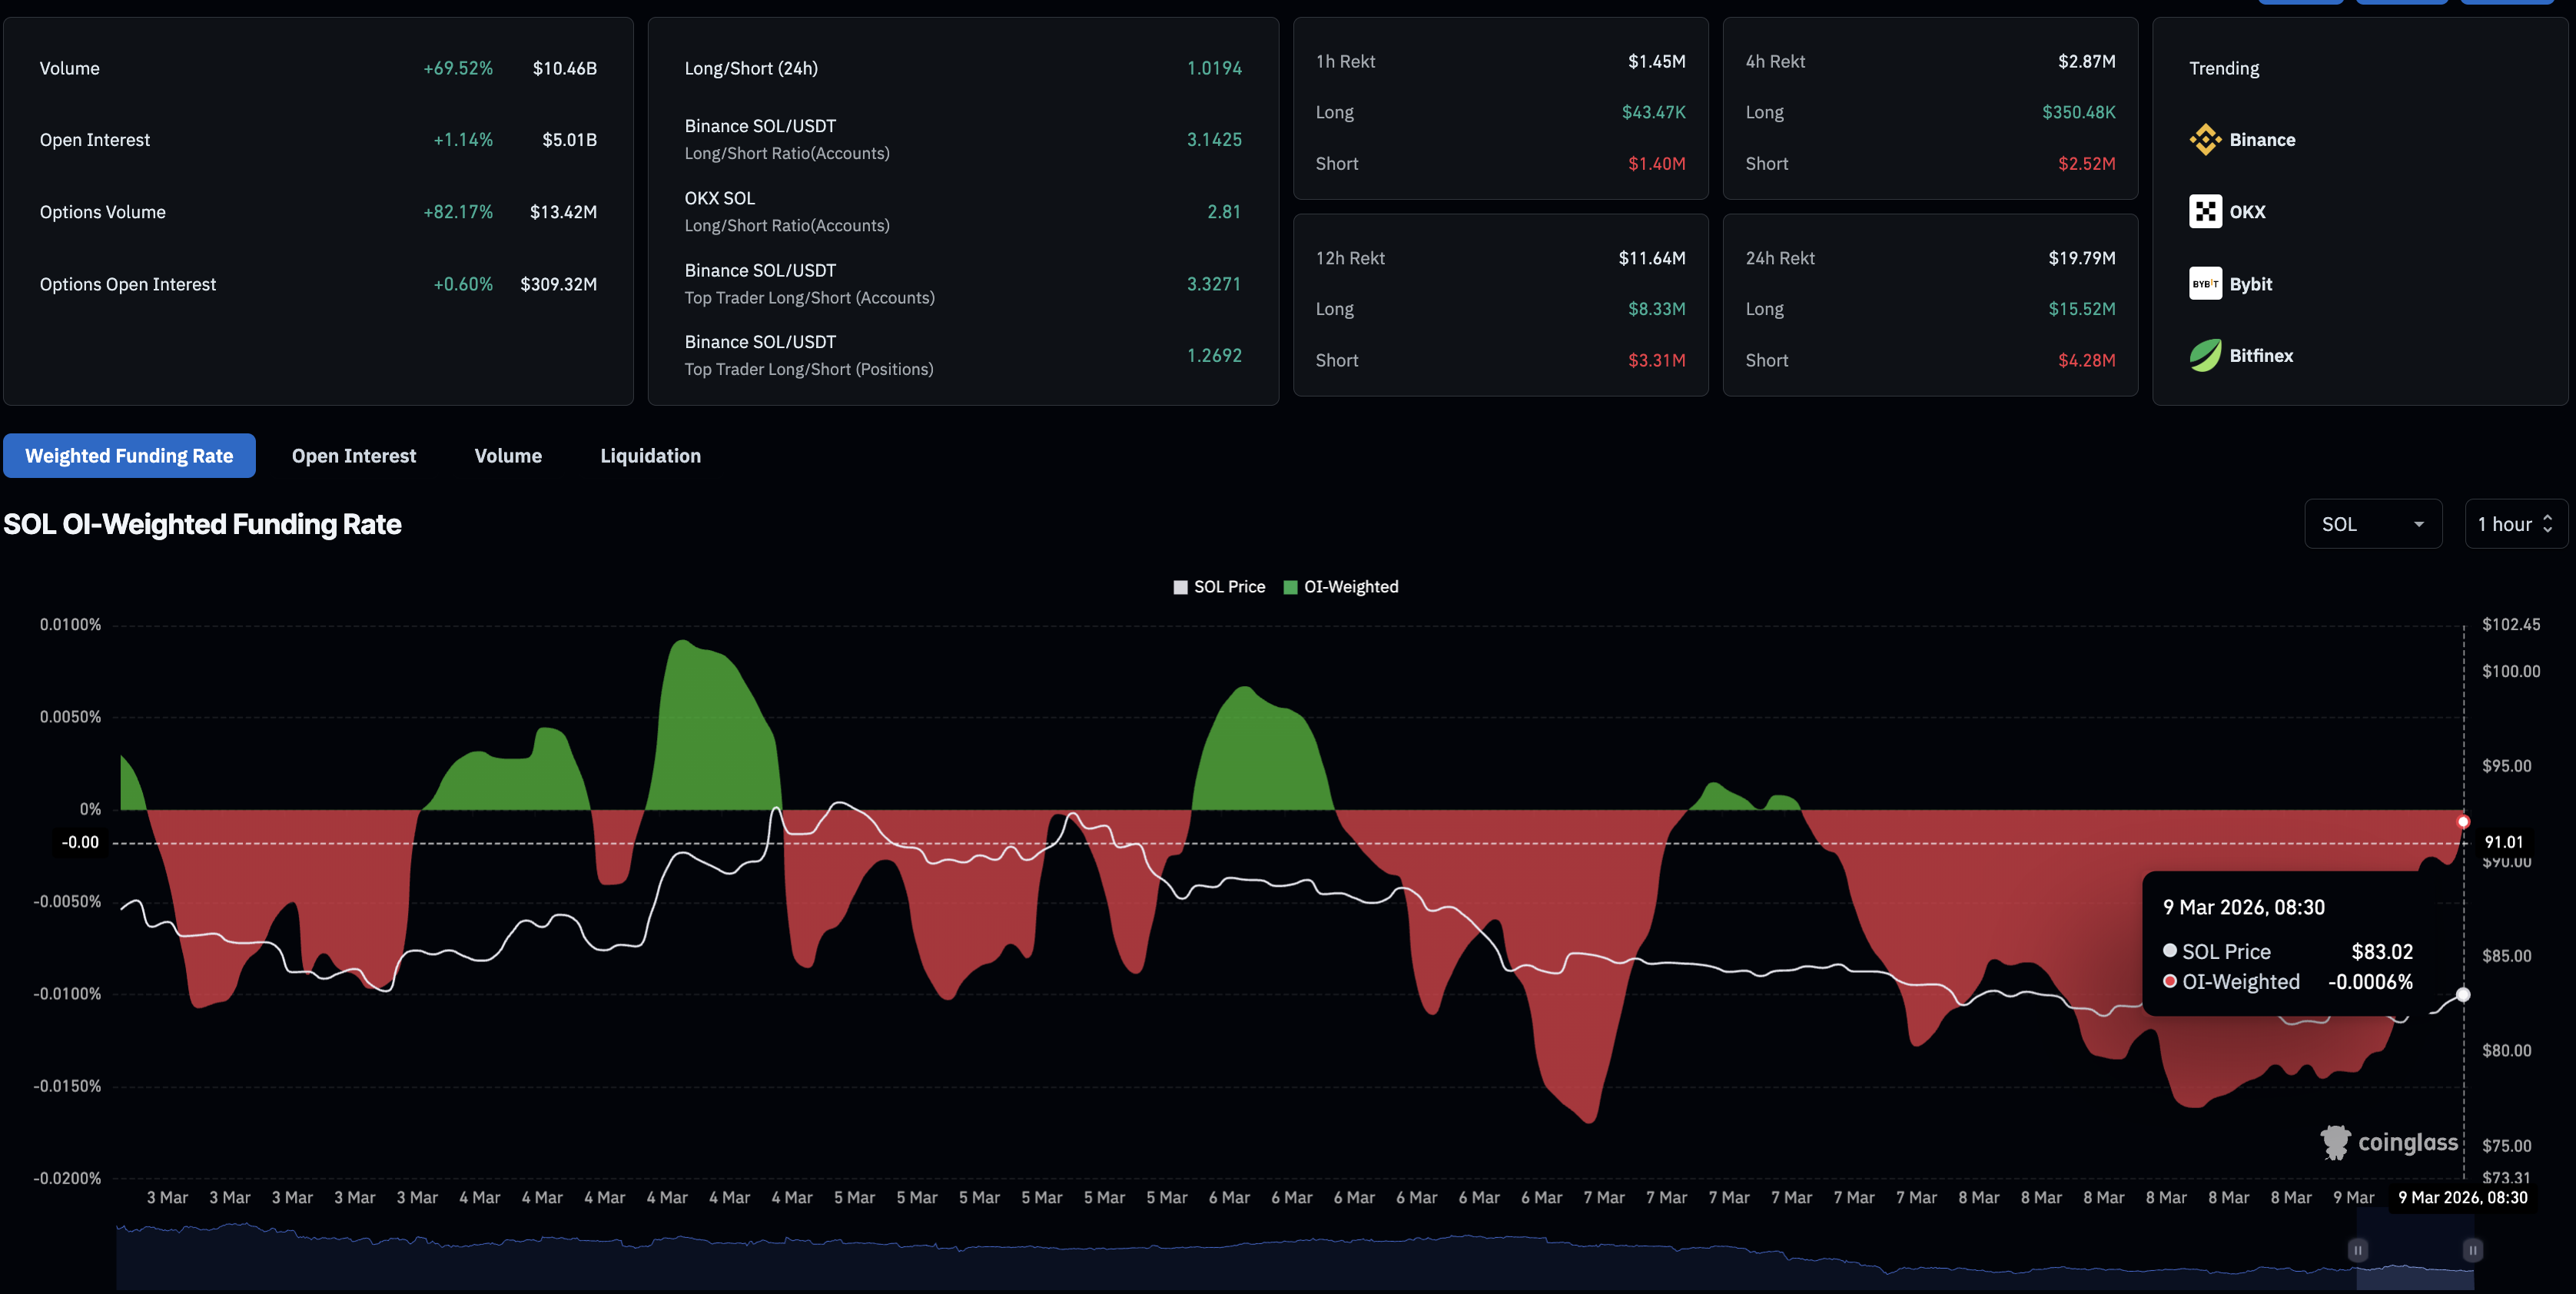
Retail interest in Solana spiked during the short-term recovery at the start of this week. CoinGlass data shows the SOL Open Interest (OI) stands at $5.01 billion, up 1% in the last 24 hours, suggesting positional buildup or increased leverage exposure as risk-on sentiment resurfaces. This capital inflow aligns with the funding rate rising to -0.0006%, from -0.0161% on Sunday, indicating reduced incentive for traders holding bearish positions.
Despite this softened bearish grip on Solana derivatives, liquidation numbers indicate a $19.79 million positional wipeout over the last 24 hours, led by $15.52 million in long positions. This suggests a larger wipeout of bullish positions and renewed bullish activity remains at risk.
Technical outlook: Could Solana rise to $100?
Solana trades in the green by 2% at press time on Monday, after a four-day decline, reflecting a broader bearish bias. SOL remains below the declining 50-, 100-, and 200-day Exponential Moving Averages (EMAs), reaffirming the bearish bias.
The top altcoin remains trapped in a sideways trend, ranging between the daily open and close prices of February 5 of $92.11 and $78.35, respectively. The upside resistance for SOL at $92.11 clusters with the declining 50-day EMA at $95.82.
If SOL clears $95.82, it could extend its recovery above $100, then the 100-day EMA at $112.80.
The technical indicators on the daily chart suggest that buyers are struggling to build upside momentum. The Moving Average Convergence Divergence (MACD) remains above its signal line, but the contracting histograms suggest a loss of bullish momentum in the short term. The Relative Strength Index (RSI) is at 43, reversing from the midline as sellers retain control.
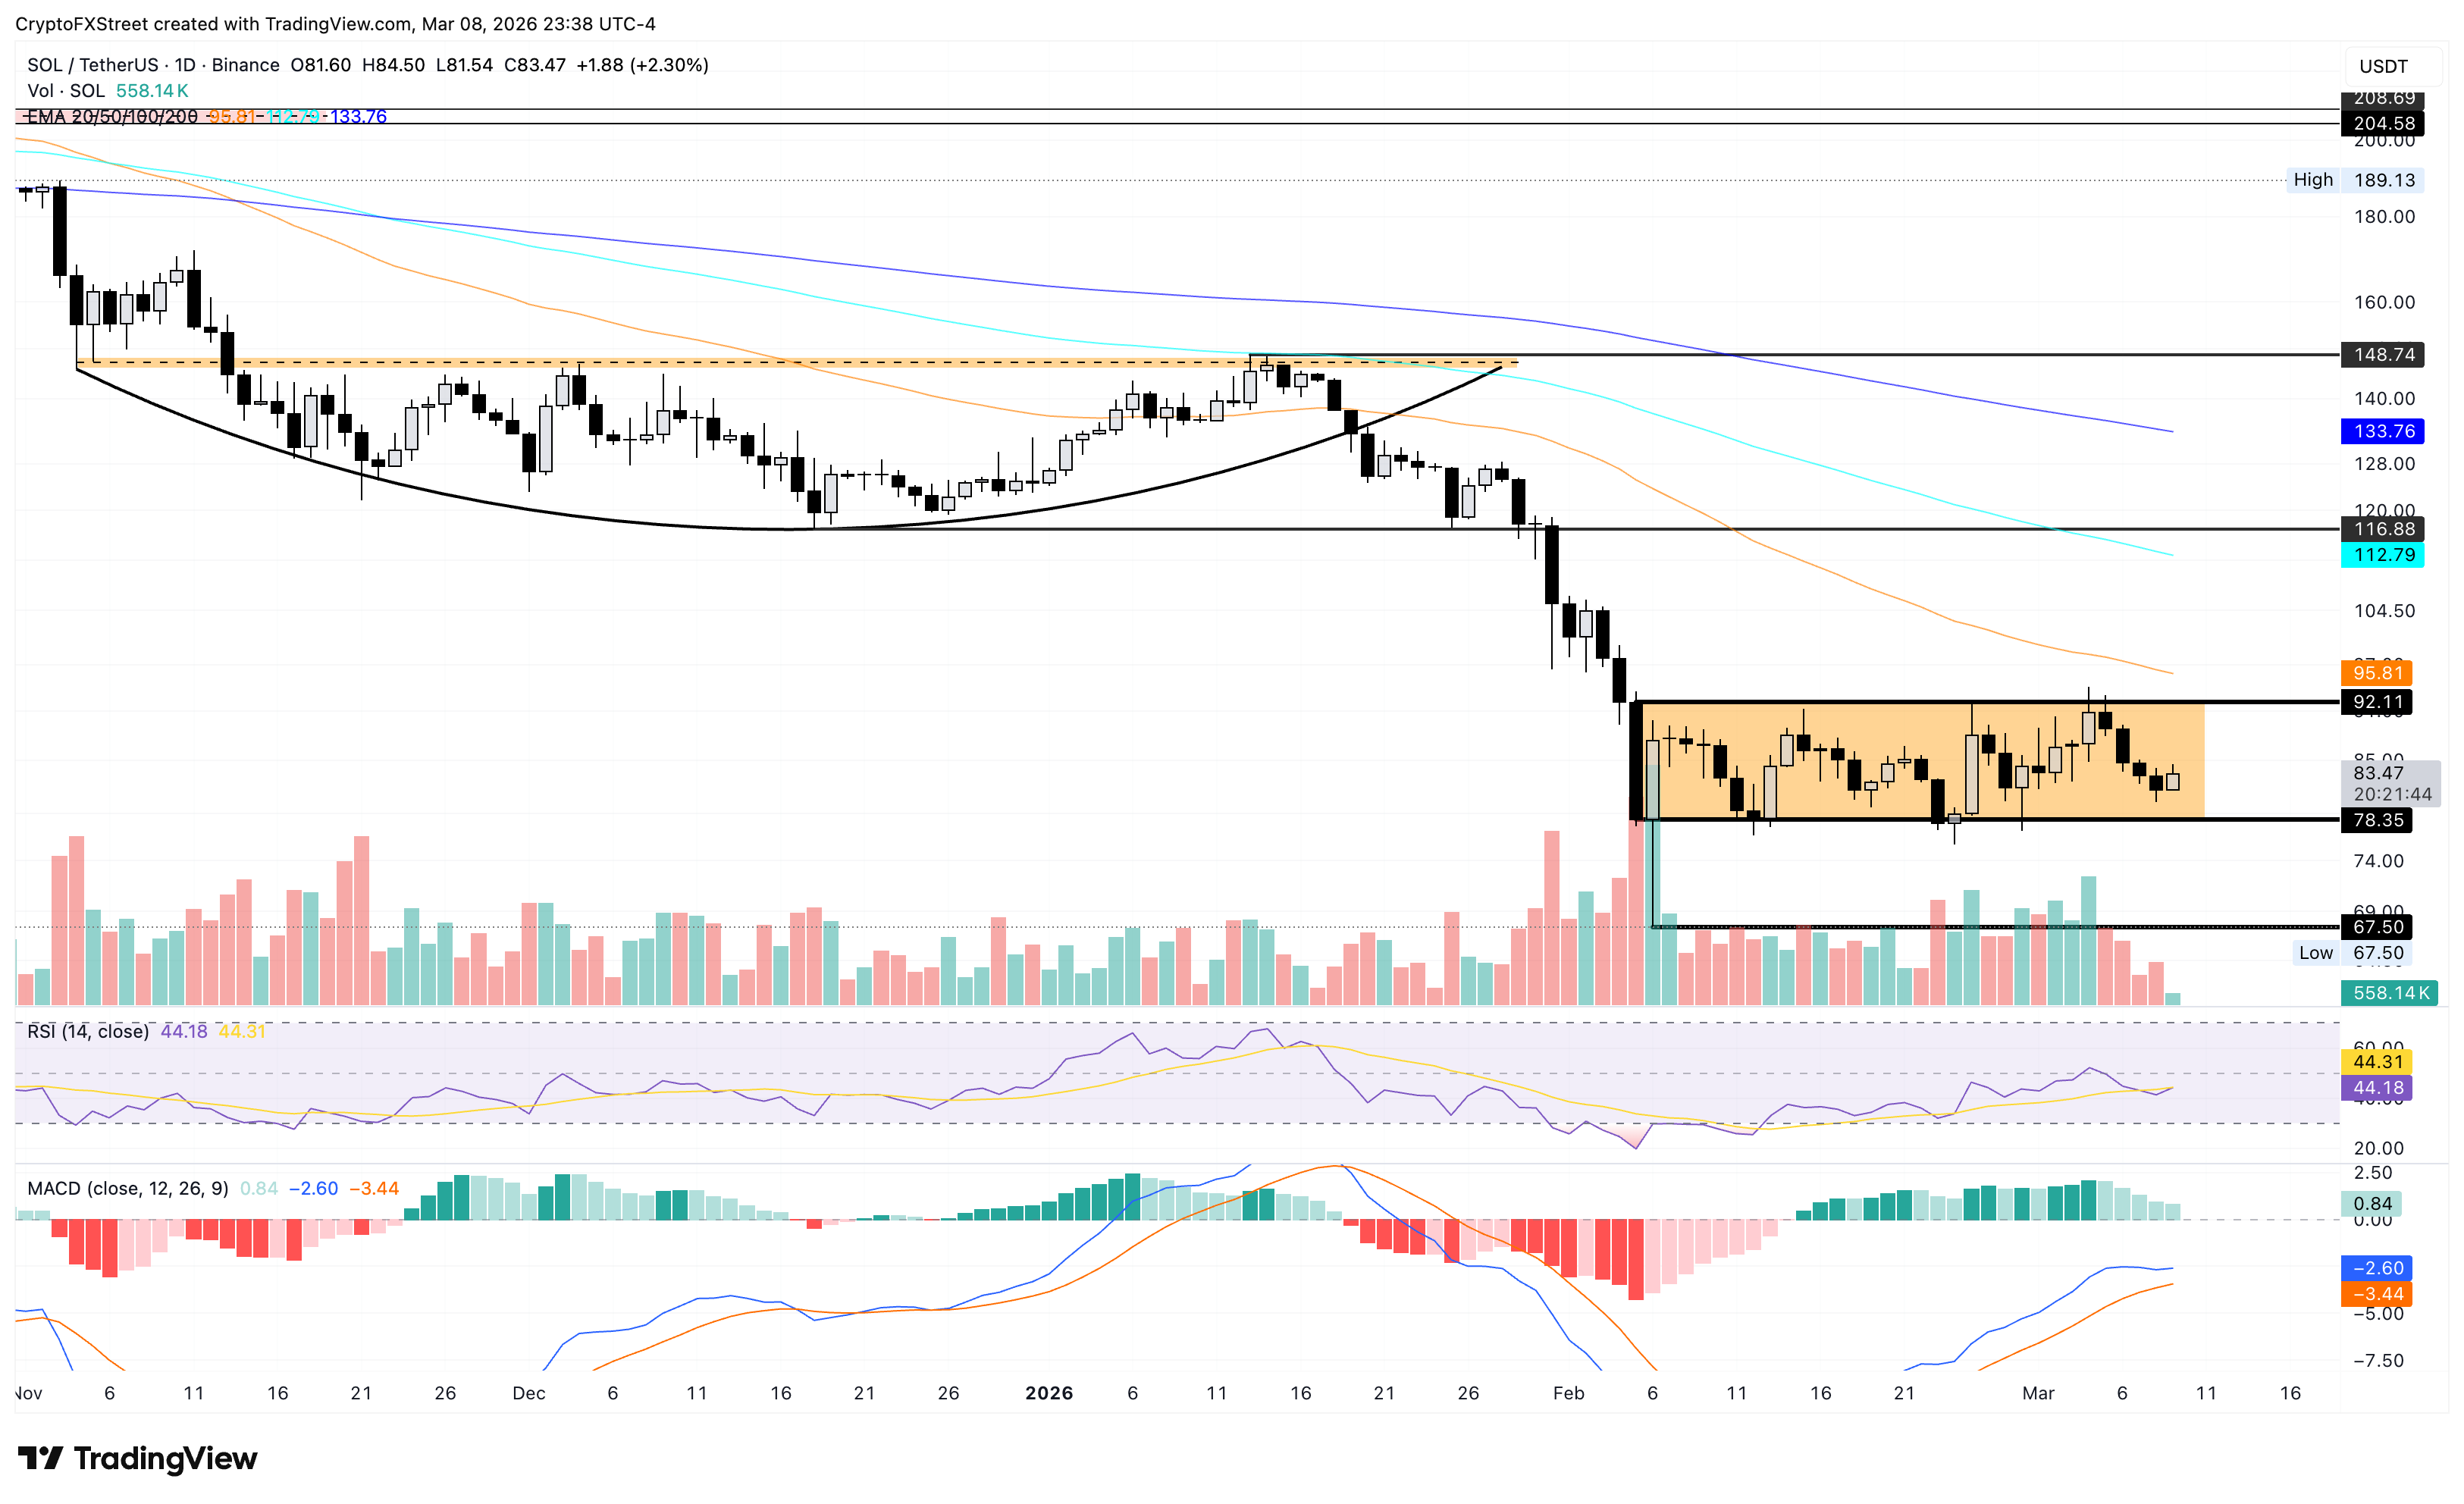
On the downside, initial support remains at $78.35, which remains the last line of defense before the $67.50 support, marked by the February 6 low.
(The technical analysis of this story was written with the help of an AI tool.)

Acuity Trading là công ty fintech có trụ sở tại London, thành lập năm 2013, chuyên về dữ liệu thay thế và phân tích cảm xúc dựa trên AI cho giao dịch và đầu tư. Họ đã cách mạng hóa trải nghiệm giao dịch trực tuyến với các công cụ tin tức và cảm xúc trực quan, và hiện tiếp tục dẫn đầu thị trường với dữ liệu thay thế tạo alpha và các công cụ giao dịch tương tác cao dựa trên nghiên cứu AI mới nhất.
Đọc thêm


