
Top 3 Price Prediction: Bitcoin, Ethereum, Ripple – BTC, ETH and XRP dip amid escalating EU–US trade war fears
Bởi Manish Chhetri
Ngày xuất bản: 19 Jan 2026 | Ngày chỉnh sửa: 19 Jan 2026


BÀI VIẾT PHỔ BIẾN

Bitcoin (BTC), Ethereum (ETH), and Ripple (XRP) prices face a correction on Monday as renewed EU–US trade-war concerns dent risk sentiment across global assets. BTC slipped below $93,000 while ETH and XRP followed BTC’s footsteps and traded lower.
- Bitcoin price slips below $93,000 on Monday, retesting its key 50-day EMA, a firm close below suggests deeper correction.
- Ethereum trades in red around $3,200 after facing rejection at the 200-day EMA, keeping downside risks intact.
- XRP corrects below $1.90 with momentum indicators signaling weakening buying pressure.
Bitcoin (BTC), Ethereum (ETH), and Ripple (XRP) prices face a correction on Monday as renewed EU–US trade-war concerns dent risk sentiment across global assets. BTC slipped below $93,000 while ETH and XRP followed BTC’s footsteps and traded lower. The top three cryptocurrencies are nearing their key support levels; a firm close below these levels could extend a deeper correction.
Bitcoin could extend its correction if it closes below 50-day EMA
Bitcoin price rallied to a nearly two-month high of $97,800 on Wednesday, finding support around the previously broken upper consolidation zone at $90,000. However, BTC failed to sustain its upward momentum and declined by 3.17% over the next four days. As of Monday, BTC is trading down, retesting the 50-day Exponential Moving Average (EMA) at $92,396.
If BTC closes below the 50-day EMA at $92,396 on a daily basis, it could extend the decline toward the next key support at $90,000.
The Relative Strength Index (RSI) on the daily chart reads 52, pointing down toward the neutral level of 50, indicating fading bullish momentum. For the bearish momentum to be sustained, the RSI must move below the neutral level. The Moving Average Convergence Divergence (MACD) indicator lines are converging, indicating indecision among traders. If the MACD flips a bearish crossover, it would further support the bearish view.
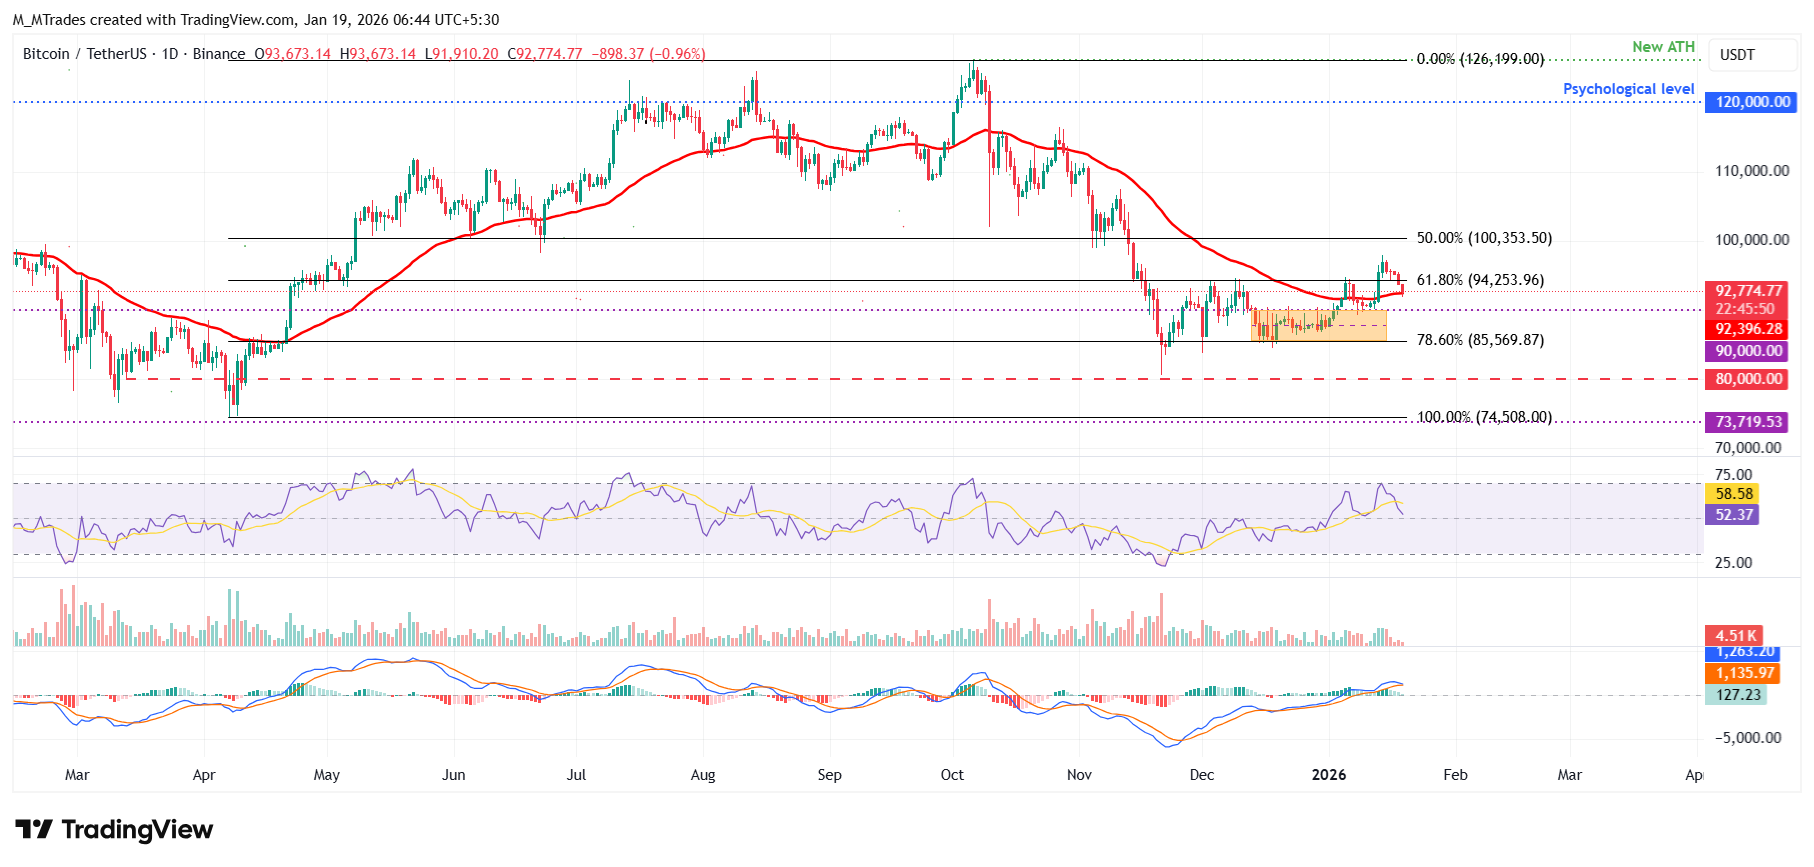
However, if BTC recovers, it could extend its rally toward the $100,000 psychological level.
Ethereum faces rejection from the 200-day EMA
Ethereum price was rejected from the 200-day EMA at $3,336 on Thursday and declined nearly 3% through Sunday. As of Monday, ETH trades down, retesting the 50-day EMA at $3,166.
If ETH closes below the 50-day EMA at $3,166 on a daily basis, it could extend the decline toward the daily support at $3,017.
Like Bitcoin, Ethereum’s RSI and MACD are showing fading bullish momentum.
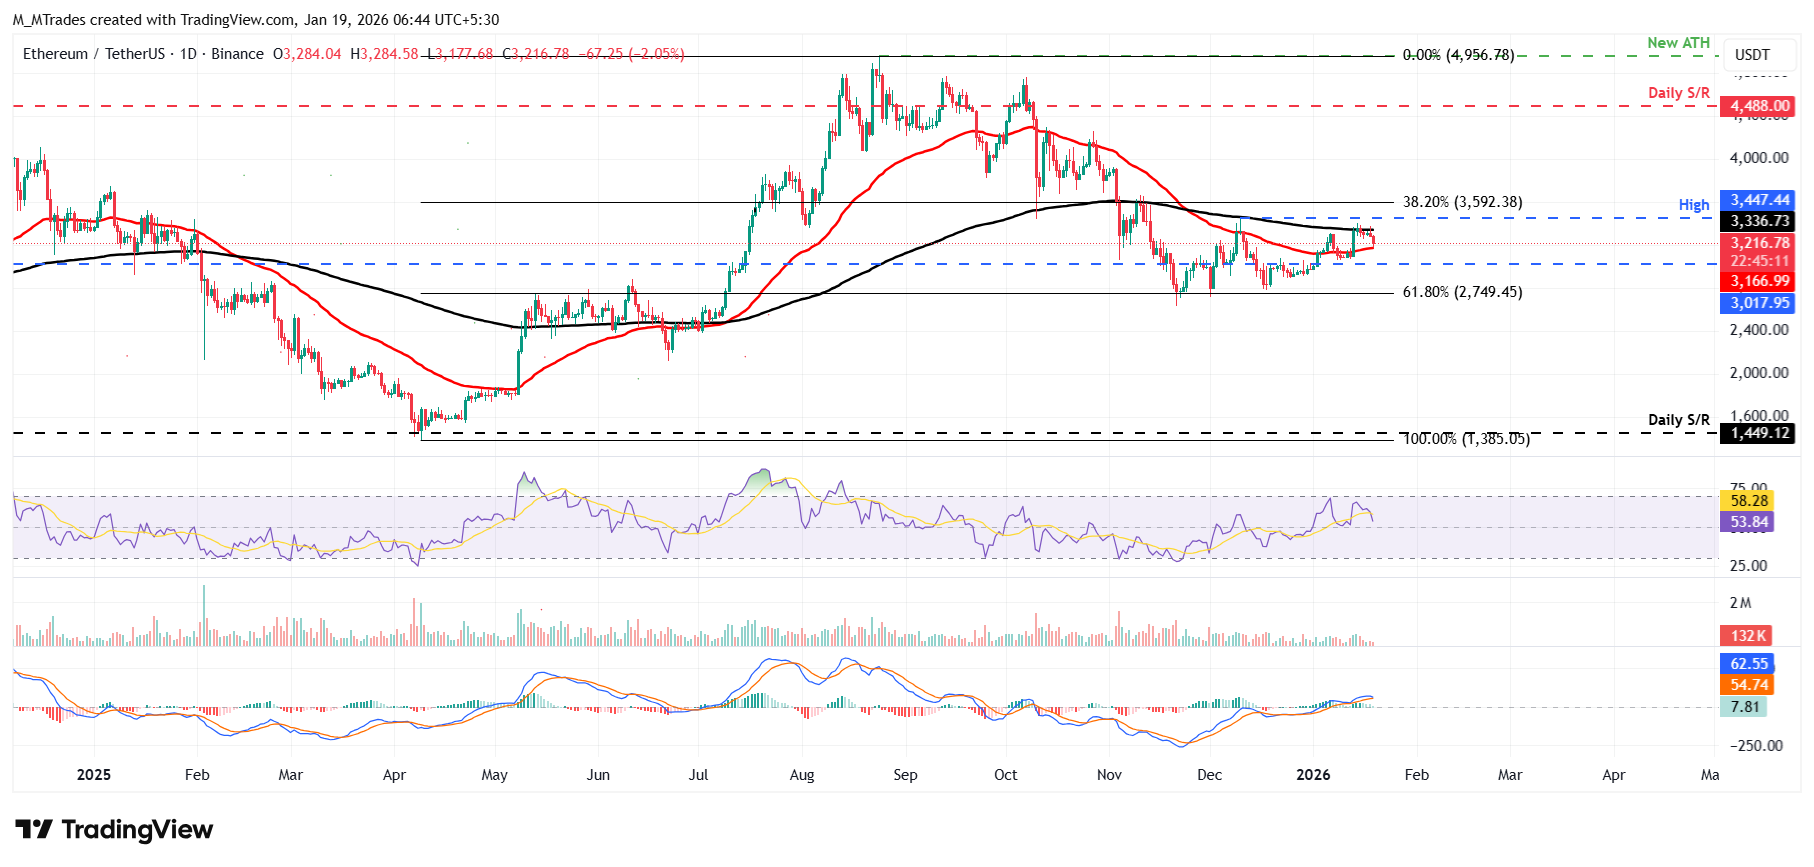
On the other hand, if the 50-day EMA holds as support, ETH could extend the recovery toward the 200-day EMA at $3,336.
XRP momentum indicators show bearish signs
XRP price faced rejection from the 50-day EMA at $2.06 on Friday and declined nearly 5% through Sunday. At the time of writing on Monday, XRP is trading down at $1.95.
If XRP continues its correction and closes below the daily support at $1.96, it could extend the decline toward the December 19 low of $1.77.
The RSI on the daily chart reads 42, below the neutral level of 50, indicating bearish momentum gaining traction. The MACD also showed a bearish crossover on Friday, further supporting the negative outlook.
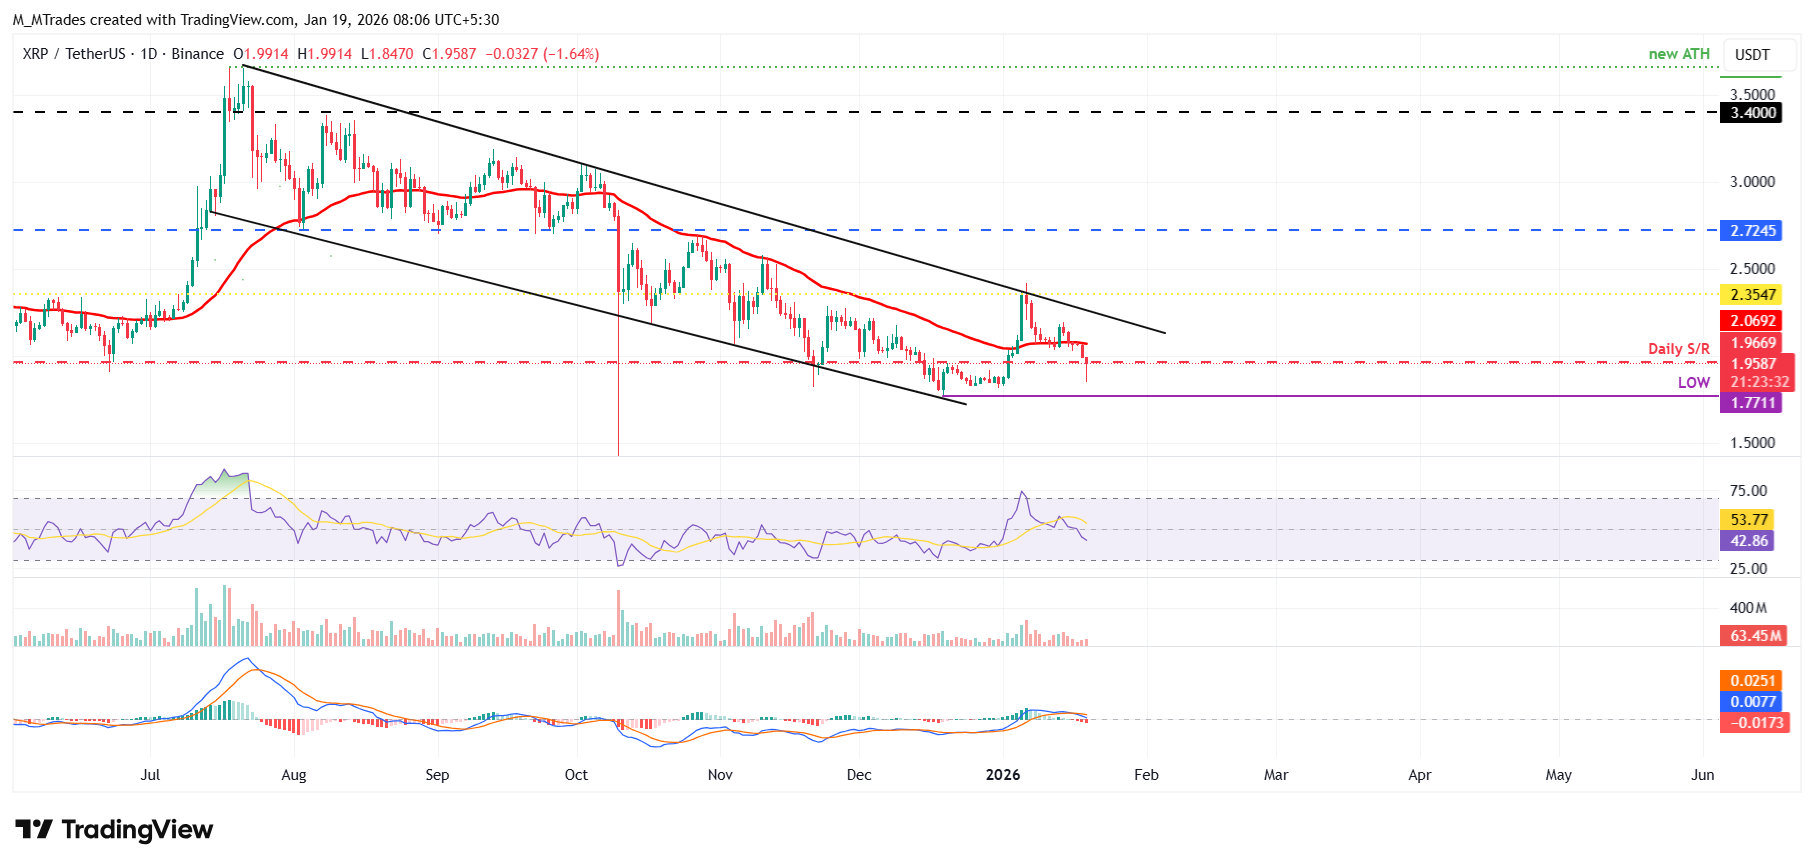
However, if the daily support at $1.96 holds, XRP could extend the recovery toward the 50-day EMA at $2.06.
Cryptocurrency metrics FAQs
The developer or creator of each cryptocurrency decides on the total number of tokens that can be minted or issued. Only a certain number of these assets can be minted by mining, staking or other mechanisms. This is defined by the algorithm of the underlying blockchain technology. On the other hand, circulating supply can also be decreased via actions such as burning tokens, or mistakenly sending assets to addresses of other incompatible blockchains.
Market capitalization is the result of multiplying the circulating supply of a certain asset by the asset’s current market value.
Trading volume refers to the total number of tokens for a specific asset that has been transacted or exchanged between buyers and sellers within set trading hours, for example, 24 hours. It is used to gauge market sentiment, this metric combines all volumes on centralized exchanges and decentralized exchanges. Increasing trading volume often denotes the demand for a certain asset as more people are buying and selling the cryptocurrency.
Funding rates are a concept designed to encourage traders to take positions and ensure perpetual contract prices match spot markets. It defines a mechanism by exchanges to ensure that future prices and index prices periodic payments regularly converge. When the funding rate is positive, the price of the perpetual contract is higher than the mark price. This means traders who are bullish and have opened long positions pay traders who are in short positions. On the other hand, a negative funding rate means perpetual prices are below the mark price, and hence traders with short positions pay traders who have opened long positions.

Acuity Trading là công ty fintech có trụ sở tại London, thành lập năm 2013, chuyên về dữ liệu thay thế và phân tích cảm xúc dựa trên AI cho giao dịch và đầu tư. Họ đã cách mạng hóa trải nghiệm giao dịch trực tuyến với các công cụ tin tức và cảm xúc trực quan, và hiện tiếp tục dẫn đầu thị trường với dữ liệu thay thế tạo alpha và các công cụ giao dịch tương tác cao dựa trên nghiên cứu AI mới nhất.
Đọc thêm


