
Trade The World
USD/CAD Price Forecast: Rises toward 1.4050 due to potential for bullish reversal
Bởi Akhtar Faruqui
Ngày xuất bản: 20 Oct 2025 | Ngày chỉnh sửa: 20 Oct 2025


POPULAR ARTICLES

USD/CAD inches higher after registering losses in the previous session, trading around 1.4030 during the European hours on Monday. The technical analysis of the daily chart suggests a bullish reversal as the pair is attempting a rebound within the ascending channel pattern.
- USD/CAD is trying to rebound within its ascending channel around 1.4030.
- The 14-day Relative Strength Index stays above the 60 mark, reinforcing the bullish outlook.
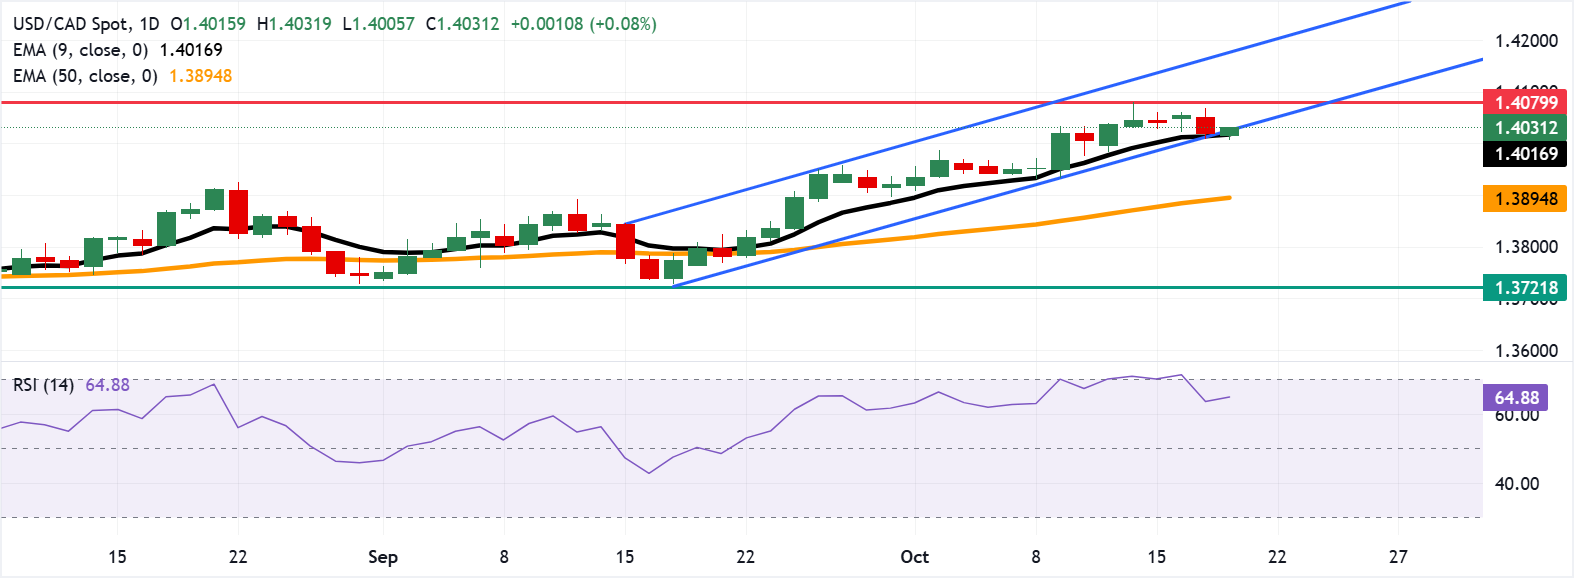
- The primary support lies at the nine-day EMA of 1.4016.
USD/CAD inches higher after registering losses in the previous session, trading around 1.4030 during the European hours on Monday. The technical analysis of the daily chart suggests a bullish reversal as the pair is attempting a rebound within the ascending channel pattern.
The short-term price momentum is stronger as the USD/CAD pair is positioned above the nine-day Exponential Moving Average (EMA). Additionally, the 14-day Relative Strength Index (RSI) remains above the 60 level, supporting the bullish bias to revive.
On the upside, the successful return to the ascending channel would revive the bullish bias and support the USD/CAD pair to test the six-month high of 1.4079, reached on October 14. A break above this level would support the pair to explore the region around the ascending channel’s upper boundary at 1.4170.
The USD/CAD pair may find its immediate support at the nine-day EMA of 1.4016. A break below this level would weaken the short-term price momentum and put downward pressure on the pair to test the 50-day EMA at 1.3894. Further declines would prompt the pair to navigate the region around the three-month low of 1.3721.
USD/CAD: Daily Chart
Canadian Dollar Price Today
The table below shows the percentage change of Canadian Dollar (CAD) against listed major currencies today. Canadian Dollar was the weakest against the New Zealand Dollar.
| USD | EUR | GBP | JPY | CAD | AUD | NZD | CHF | |
|---|---|---|---|---|---|---|---|---|
| USD | -0.07% | 0.08% | 0.09% | 0.07% | 0.01% | -0.10% | -0.05% | |
| EUR | 0.07% | 0.15% | 0.14% | 0.13% | 0.09% | -0.04% | 0.04% | |
| GBP | -0.08% | -0.15% | 0.02% | -0.02% | -0.07% | -0.18% | -0.11% | |
| JPY | -0.09% | -0.14% | -0.02% | -0.01% | -0.06% | -0.25% | -0.14% | |
| CAD | -0.07% | -0.13% | 0.02% | 0.01% | 0.00% | -0.19% | -0.11% | |
| AUD | -0.01% | -0.09% | 0.07% | 0.06% | -0.01% | -0.13% | -0.05% | |
| NZD | 0.10% | 0.04% | 0.18% | 0.25% | 0.19% | 0.13% | 0.07% | |
| CHF | 0.05% | -0.04% | 0.11% | 0.14% | 0.11% | 0.05% | -0.07% |
The heat map shows percentage changes of major currencies against each other. The base currency is picked from the left column, while the quote currency is picked from the top row. For example, if you pick the Canadian Dollar from the left column and move along the horizontal line to the US Dollar, the percentage change displayed in the box will represent CAD (base)/USD (quote).

Acuity Trading
Acuity Trading là công ty fintech có trụ sở tại London, thành lập năm 2013, chuyên về dữ liệu thay thế và phân tích cảm xúc dựa trên AI cho giao dịch và đầu tư. Họ đã cách mạng hóa trải nghiệm giao dịch trực tuyến với các công cụ tin tức và cảm xúc trực quan, và hiện tiếp tục dẫn đầu thị trường với dữ liệu thay thế tạo alpha và các công cụ giao dịch tương tác cao dựa trên nghiên cứu AI mới nhất.
Read More


