
Trade The World
USD/CAD Price Forecast: Tests seven-month highs near 1.4100
Bởi Akhtar Faruqui
Ngày xuất bản: 4 Nov 2025 | Ngày chỉnh sửa: 4 Nov 2025


POPULAR ARTICLES

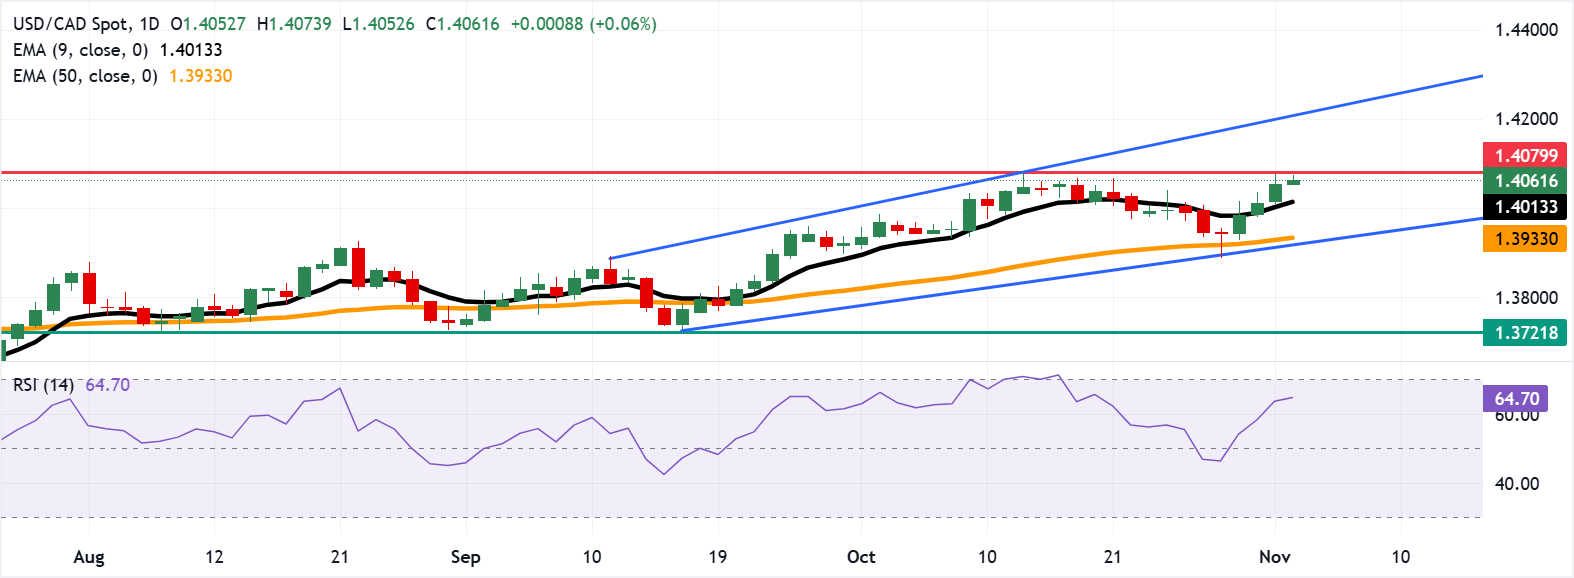
USD/CAD extends its gains for the fourth successive session, trading around 1.4060 during the European hours on Tuesday. The technical analysis of the daily chart indicates a prevailing bullish bias, with the pair moving upwards within the ascending channel pattern.
- USD/CAD targets the seven-month high of 1.4079.
- The 14-day Relative Strength Index rises toward the 70 level, reinforcing bullish bias.
- The pair may find its initial support at the nine-day EMA of 1.4013.
USD/CAD extends its gains for the fourth successive session, trading around 1.4060 during the European hours on Tuesday. The technical analysis of the daily chart indicates a prevailing bullish bias, with the pair moving upwards within the ascending channel pattern.
The short-term price momentum is stronger as the pair rises above the nine-day Exponential Moving Average (EMA). Additionally, the 14-day Relative Strength Index (RSI) is advancing toward the 70 mark, strengthening bullish bias.
The USD/CAD pair is testing the seven-month high of 1.4079, followed by the psychological level of 1.4100. A break above this confluence resistance zone would strengthen the bullish bias and lead the pair to explore the area around the upper boundary of the ascending channel at 1.4210.
On the downside, the primary support lies at the nine-day EMA of 1.4013, followed by the psychological level of 1.4000. Further declines below this crucial support region would weaken the short-term price momentum and prompt the USD/CAD pair to the 50-day EMA at 1.3933, followed by the ascending channel’s lower boundary around 1.3920.
USD/CAD: Daily Chart
Canadian Dollar Price Today
The table below shows the percentage change of Canadian Dollar (CAD) against listed major currencies today. Canadian Dollar was the weakest against the Japanese Yen.
| USD | EUR | GBP | JPY | CAD | AUD | NZD | CHF | |
|---|---|---|---|---|---|---|---|---|
| USD | -0.07% | 0.15% | -0.38% | 0.04% | 0.37% | 0.41% | -0.05% | |
| EUR | 0.07% | 0.22% | -0.34% | 0.10% | 0.44% | 0.47% | 0.02% | |
| GBP | -0.15% | -0.22% | -0.54% | -0.11% | 0.22% | 0.26% | -0.20% | |
| JPY | 0.38% | 0.34% | 0.54% | 0.43% | 0.76% | 0.79% | 0.34% | |
| CAD | -0.04% | -0.10% | 0.11% | -0.43% | 0.34% | 0.37% | -0.08% | |
| AUD | -0.37% | -0.44% | -0.22% | -0.76% | -0.34% | 0.03% | -0.42% | |
| NZD | -0.41% | -0.47% | -0.26% | -0.79% | -0.37% | -0.03% | -0.45% | |
| CHF | 0.05% | -0.02% | 0.20% | -0.34% | 0.08% | 0.42% | 0.45% |
The heat map shows percentage changes of major currencies against each other. The base currency is picked from the left column, while the quote currency is picked from the top row. For example, if you pick the Canadian Dollar from the left column and move along the horizontal line to the US Dollar, the percentage change displayed in the box will represent CAD (base)/USD (quote).

Acuity Trading
Acuity Trading là công ty fintech có trụ sở tại London, thành lập năm 2013, chuyên về dữ liệu thay thế và phân tích cảm xúc dựa trên AI cho giao dịch và đầu tư. Họ đã cách mạng hóa trải nghiệm giao dịch trực tuyến với các công cụ tin tức và cảm xúc trực quan, và hiện tiếp tục dẫn đầu thị trường với dữ liệu thay thế tạo alpha và các công cụ giao dịch tương tác cao dựa trên nghiên cứu AI mới nhất.
Read More


