
Trade The World
Aerodrome Finance Price Forecast: AERO rebounds as Open Interest jumps
Bởi Vishal Dixit
Ngày xuất bản: 5 Sep 2025 | Ngày chỉnh sửa: 5 Sep 2025


POPULAR ARTICLES

Aerodrome Finance (AERO) appreciates over 4% at press time on Friday, bouncing off the 50-day Exponential Moving Average (EMA). The technical and derivative data uphold a bullish outlook, suggesting extended gains ahead.
- Aerodrome Finance rebounds after a retest of the 50-day EMA.
- The AERO Open Interest records a double-digit rise, signaling higher activity among traders.
- The technical outlook holds a bullish bias, suggesting a potential run to $1.48.
Aerodrome Finance (AERO) appreciates over 4% at press time on Friday, bouncing off the 50-day Exponential Moving Average (EMA). The technical and derivative data uphold a bullish outlook, suggesting extended gains ahead.
Optimism sparks in AERO derivatives
CoinGlass data shows that the AERO Open Interest (OI) has increased over 10% in the last 24 hours, reaching $85.92 million. This sudden increase in capital inflow, fueling the active positions of AERO futures and option active contracts, displays a risk-on shift among derivatives traders.
Adding to the increased optimism, the OI-weighted funding rate has flipped positive to 0.0116%, up from -0.0026% earlier on the day. This implies a buy-side dominance as bulls pay the premium to align swap and spot prices.
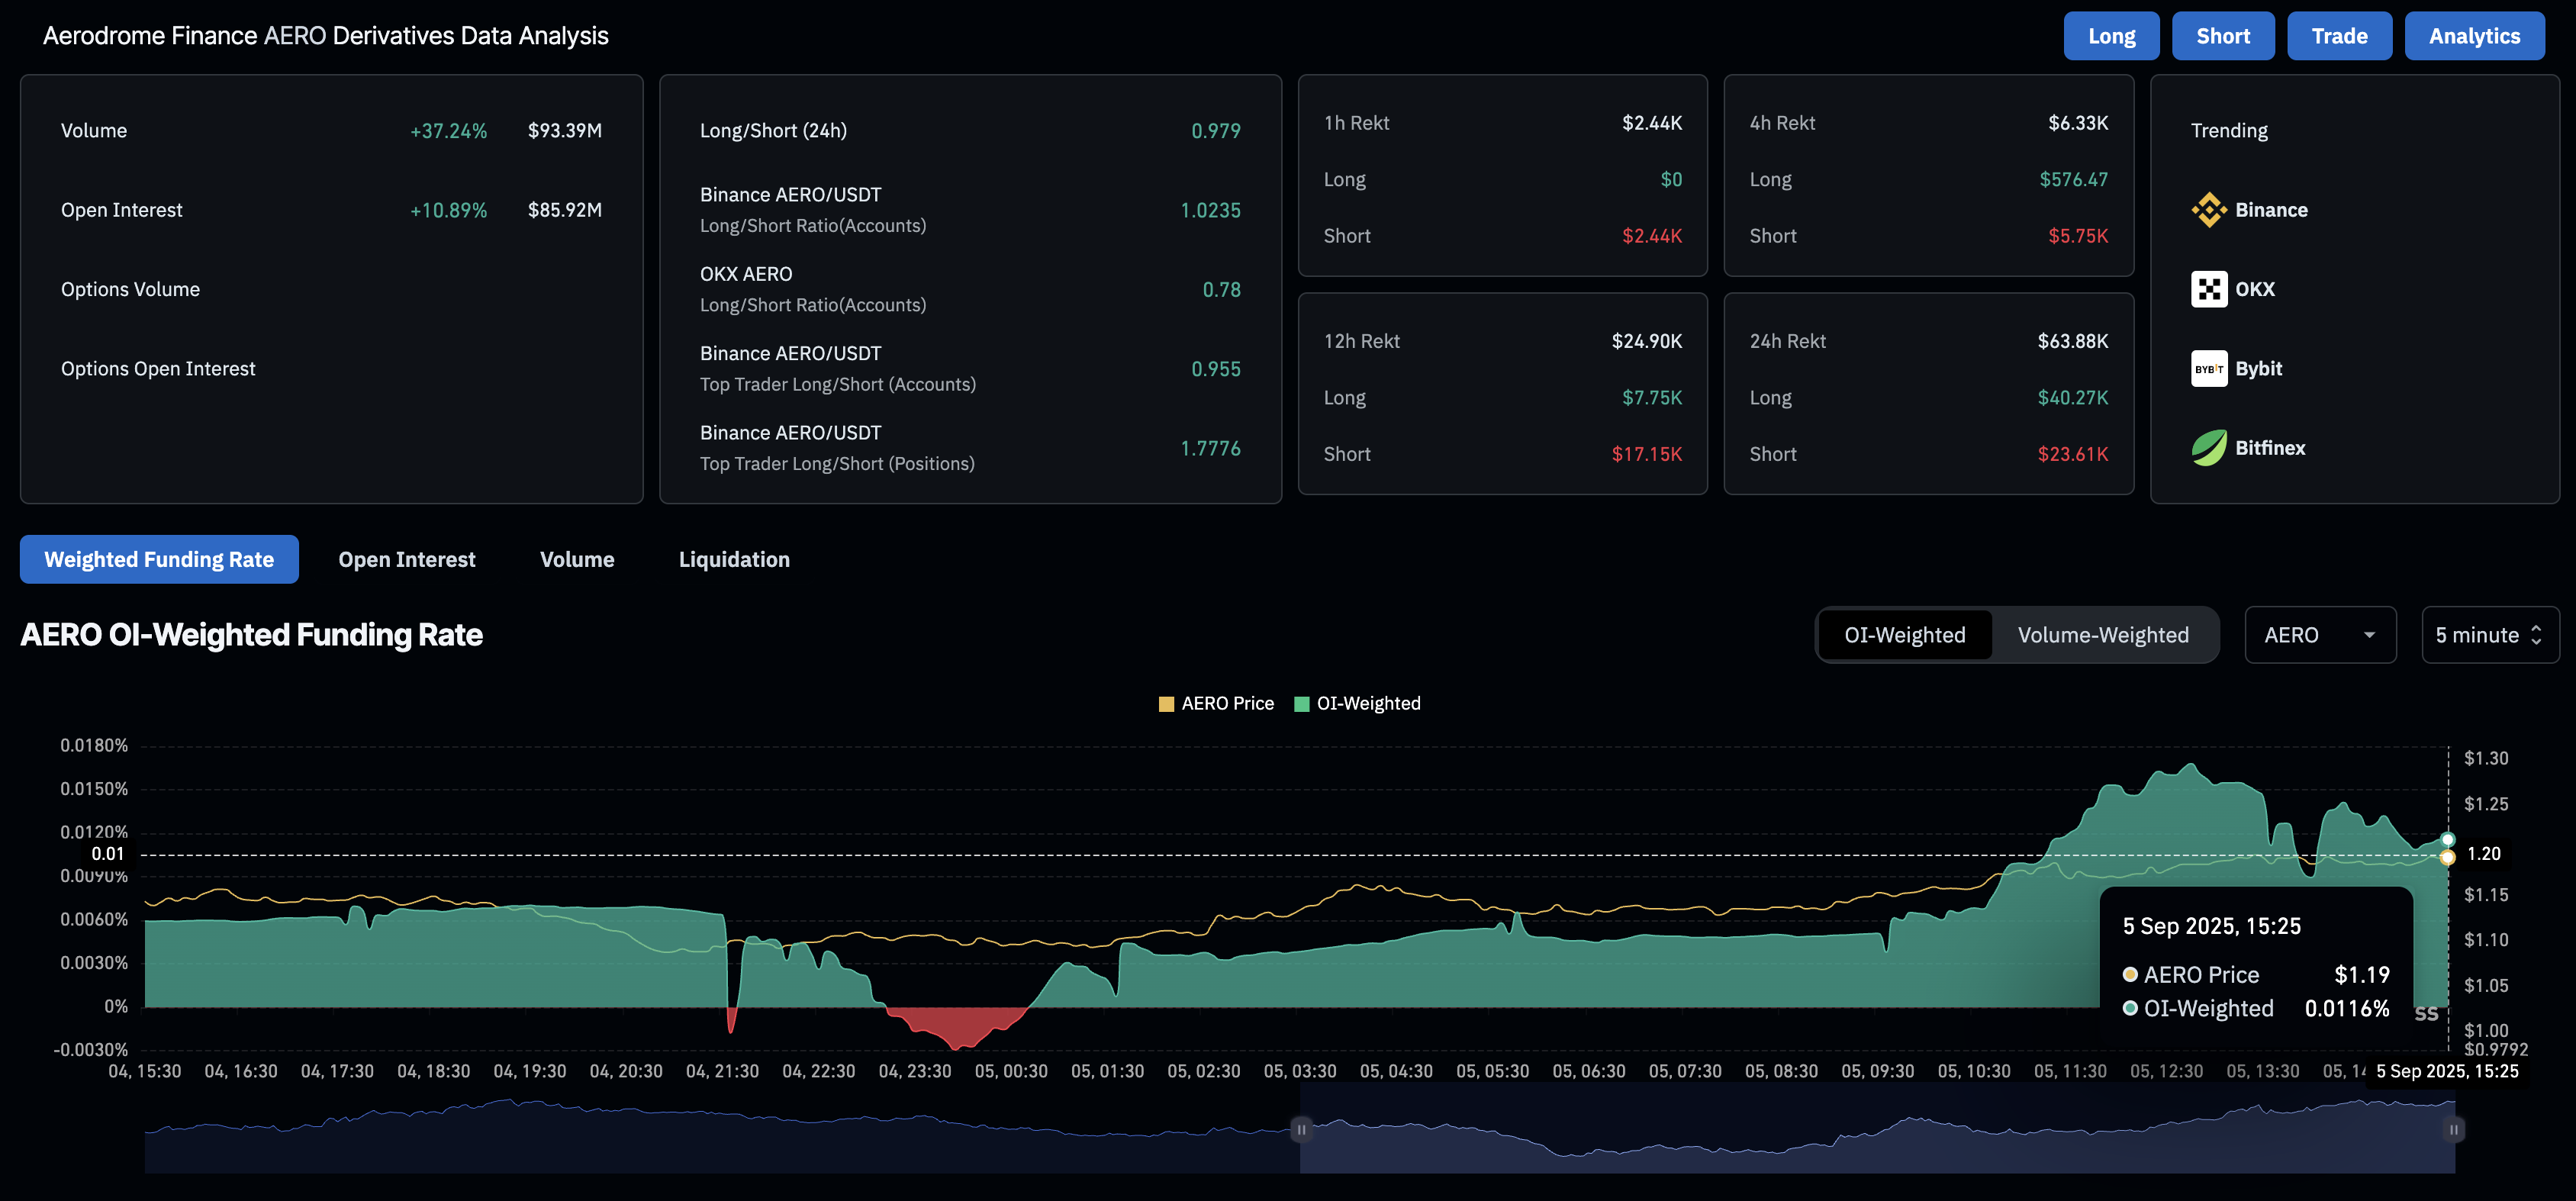
Aerodrome Finance derivatives. Source: Coinglass
Aerodrome Finance prepares to lift off, targeting key resistance
Aerodrom edges higher by over 4% so far on Friday, holding above the 61.8% Fibonacci retracement, drawn from the $2.33 high of December 12 to the $0.28 low from April 7, at $1.04. The recovery run targets the 78.6% Fibonacci retracement at $1.48 as the 50-day EMA provided dynamic support, increasing upside chances.
The technical indicators on the daily chart signal a potential shift in trend momentum. The Moving Average Convergence Divergence (MACD) shows a declining intensity of the red histogram bars. Sidelined investors could consider the MACD crossing above its signal line as a buy signal, as it will confirm a bullish shift in trend momentum.
Additionally, the Relative Strength Index (RSI) at 50 on the same chart remains neutral. If the RSI edges above the halfway line, it will signal a bullish tilt with further room for growth.
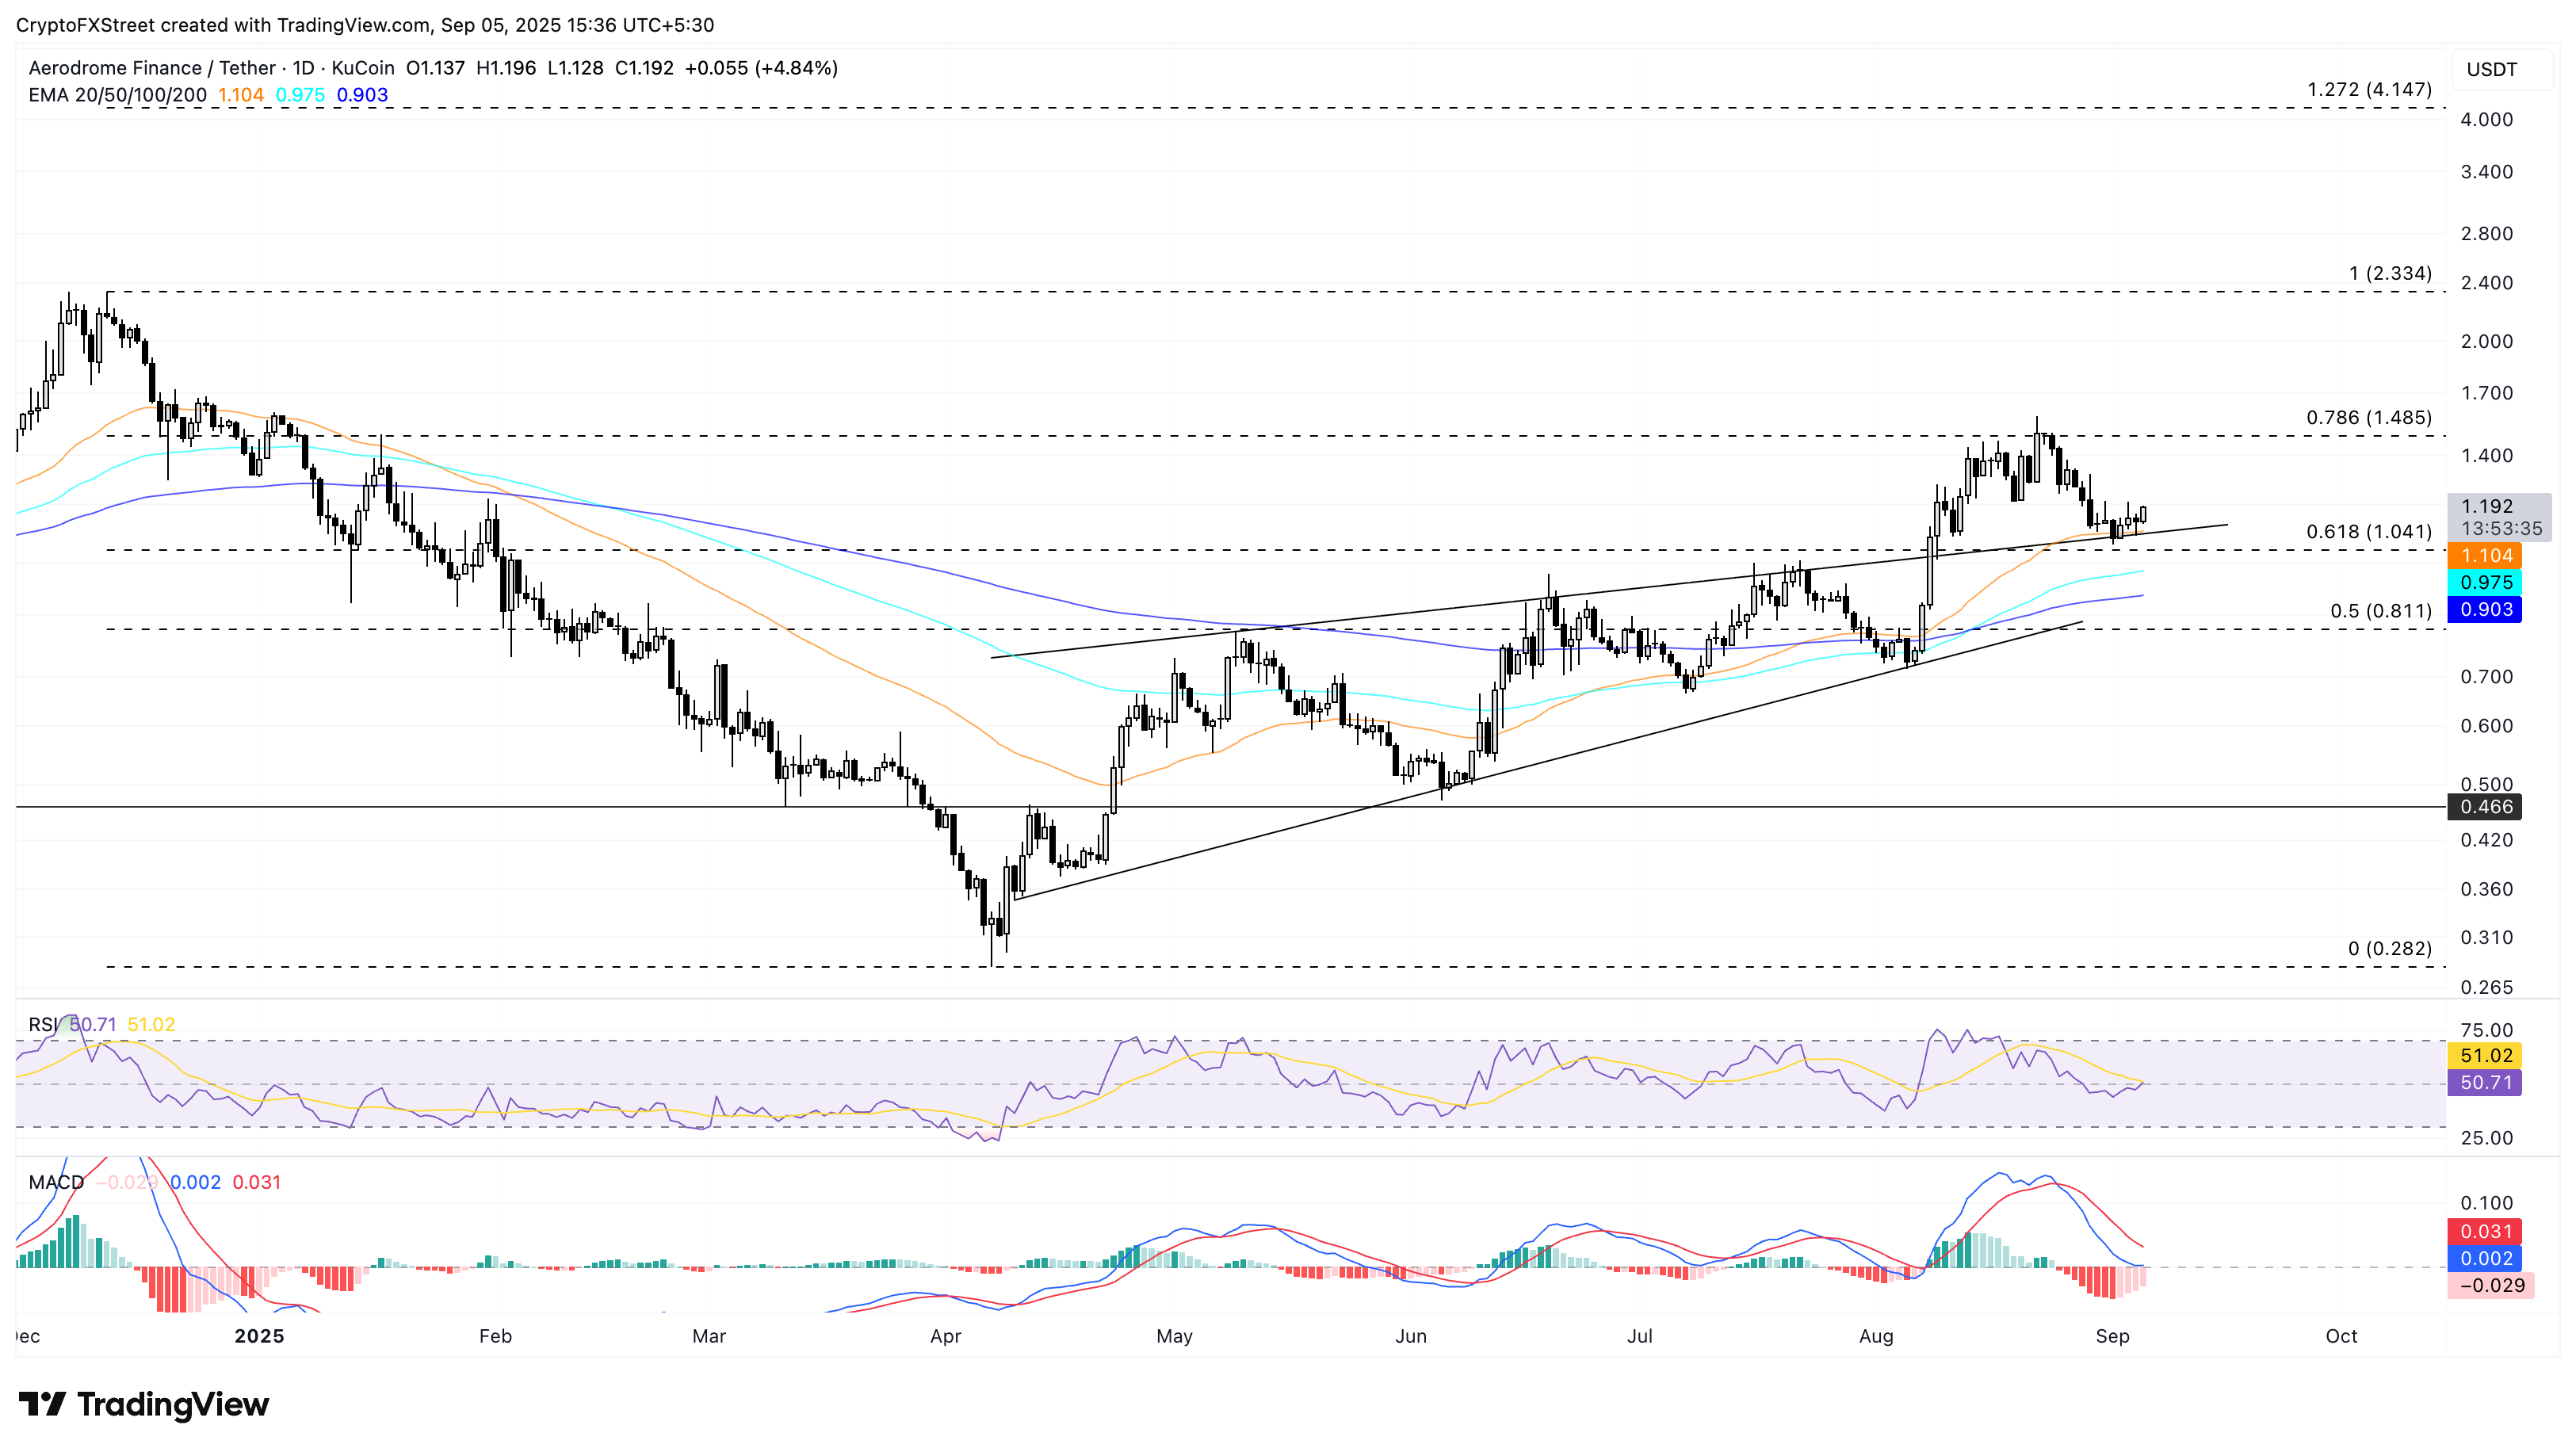
AERO/USDT daily price chart.
On the contrary, a potential reversal below the 50-day EMA at $1.10 could result in a drop to the 100-day EMA at $0.97.

FXStreet
Hơn một triệu người dùng dựa vào FXStreet để có dữ liệu thị trường thời gian thực, công cụ biểu đồ, góc nhìn chuyên gia và tin tức Forex. Lịch kinh tế toàn diện và các hội thảo web giáo dục giúp nhà giao dịch luôn cập nhật và đưa ra quyết định có tính toán. FXStreet có khoảng 60 nhân sự, chia giữa trụ sở Barcelona và nhiều khu vực toàn cầu.
Read More


