
Trade The World
Aptos Price Forecast: Token unlocks worth over $50 million set to test investor sentiment
Bởi Manish Chhetri
Ngày xuất bản: 9 Sep 2025 | Ngày chỉnh sửa: 9 Sep 2025


POPULAR ARTICLES

Aptos (APT) price is holding steady near $4.43 at the time of writing on Tuesday, following a modest rebound last week. However, investors are set to face a key test as more than $50 million worth of tokens are scheduled to be unlocked on Thursday, representing 2.20% of the circulating supply.
- Aptos price hovers around $4.43 on Tuesday, having recovered slightly the previous week.
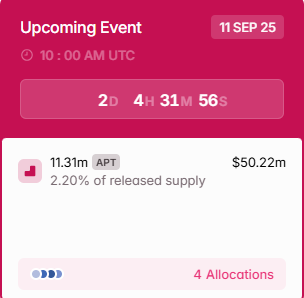
- More than $50 million in APT tokens will be unlocked on Thursday, equal to 2.20% of the circulating supply.
- Traders should be cautious as token unlocks frequently generate negative sentiment among investors, weighing down prices.
Aptos (APT) price is holding steady near $4.43 at the time of writing on Tuesday, following a modest rebound last week. However, investors are set to face a key test as more than $50 million worth of tokens are scheduled to be unlocked on Thursday, representing 2.20% of the circulating supply. Such unlocks often pressure prices as circulating supply expands, raising caution among traders.
Tokens unlock worth 2.20% of the circulating supply
Tokenomist data shows that Aptos is scheduled for a cliff unlock on Thursday, which allows a certain number of tokens to be unlocked immediately after a specified period has elapsed. This event will unlock 11.31 million Aptos, worth $50.22 million, which accounts for 2.20% of the released supply.
Generally, when a token unlocks accounts for over 1% of the cryptocurrency’s circulating supply, it is likely to have a negative impact on the token’s price. Therefore, traders should monitor Aptos for increased volatility this week.
Apart from the token unlock event, the falling Total Value Locked (TVL) on Aptos also raises concerns. DeFiLlama data show that Aptos TVL currently stands at $741.36 million, down approximately 42.53% from its record high of $1.29 billion in May, likely due to the withdrawal of funds or unstaking of assets, suggesting weakening demand for the protocol.
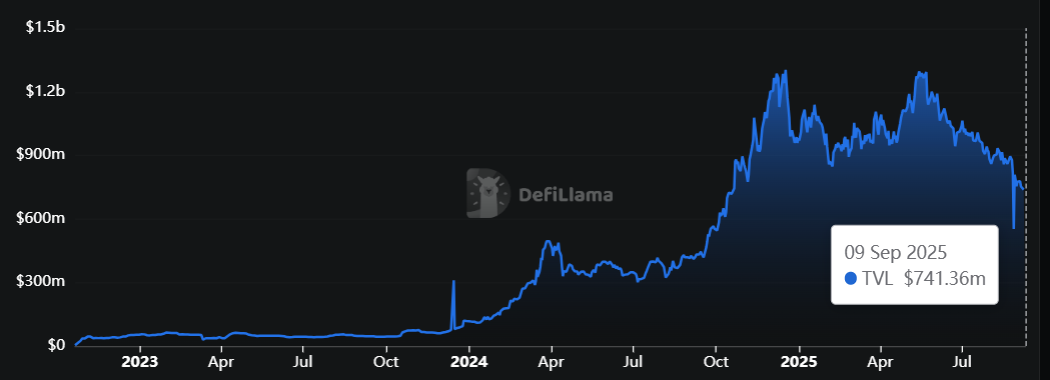
Aptos TVL chart. Source: DefiLlama
Technical analysis breakdown for Aptos
On the 4-hour chart, the Aptos price has been consolidating within a parallel channel between $4.13 and $4.47 since August 25. However, APT broke above a descending trendline drawn by connecting multiple highs since August 14, on Monday, hinting at some sense of relief. At the time of writing on Tuesday, APT trades at around $4.43, nearing its upper boundary of the parallel channel.
If APT breaks above the upper channel boundary at $4.47 and finds support around it, it could extend the rally toward the 50% Fibonacci retracement level at $4.63 (draw from the August 14 high of $5.14 to the September 2 low of $4.11).
The Relative Strength Index (RSI) on the 4-hour chart reads 64, above its neutral level of 50 and well below its overbought conditions, indicating bullish momentum.
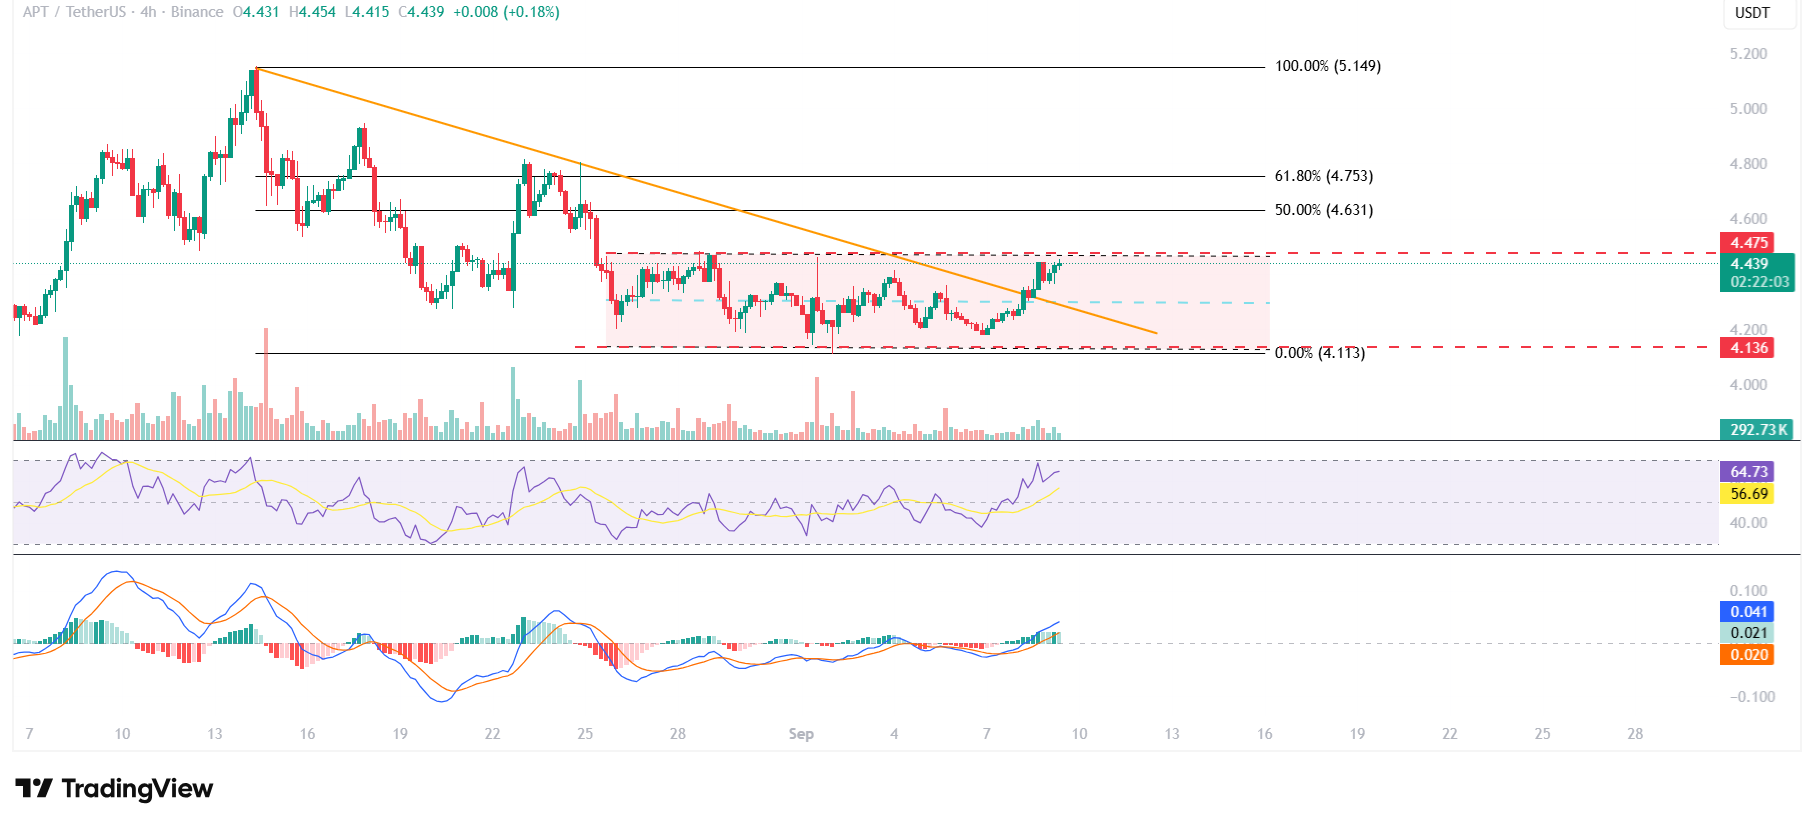
APT/USDT 4-hour chart
The daily chart shows that APT rebounded after finding support around the lower trendline of a triangle pattern on Sunday and recovered 4.85% by Monday. At the time of writing on Tuesday, APT trades just below the 50-day Exponential Moving Average (EMA) at $4.51.
If APT closes above the 50-day EMA at $4.51 on a daily basis, it could extend the rally toward the August 22 high of $4.81, which roughly coincides with the upper trendline of the triangle pattern.
The RSI on the daily chart is moving above its neutral level of 50, indicating early signs of bullish momentum. The Moving Average Convergence Divergence (MACD) on the daily chart showed a bullish crossover on Monday, giving a buy signal and supporting the bullish view.
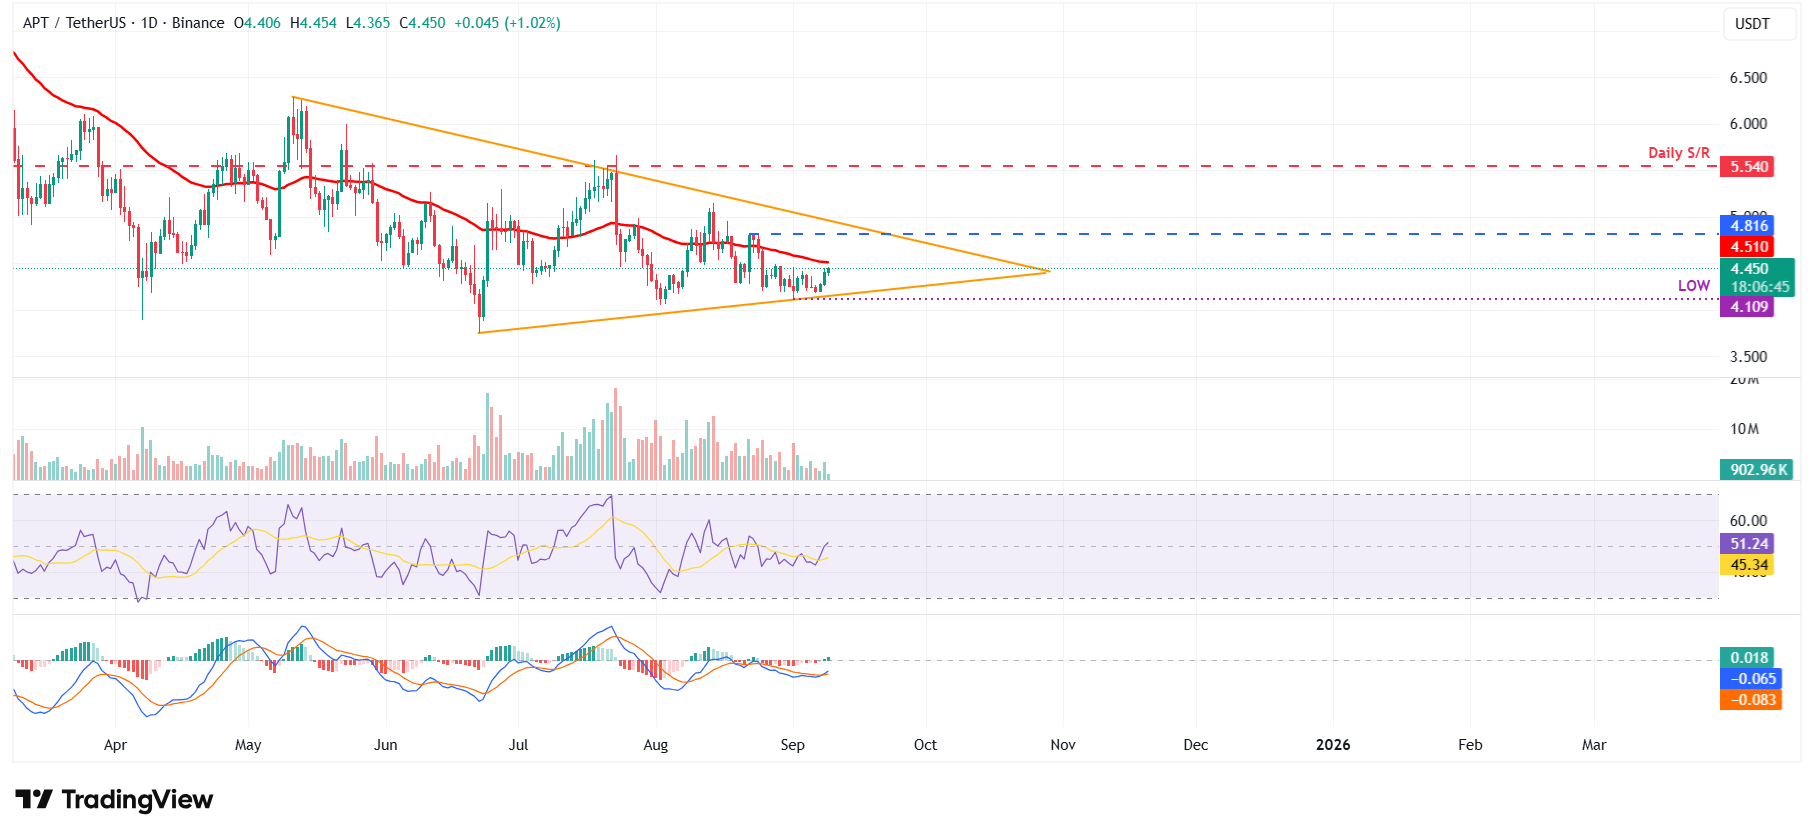
APT/USDT daily chart
However, if APT faces a correction from the 50-day EMA at $4.51, it could extend the decline toward the September 1 low of $4.10.

FXStreet
Hơn một triệu người dùng dựa vào FXStreet để có dữ liệu thị trường thời gian thực, công cụ biểu đồ, góc nhìn chuyên gia và tin tức Forex. Lịch kinh tế toàn diện và các hội thảo web giáo dục giúp nhà giao dịch luôn cập nhật và đưa ra quyết định có tính toán. FXStreet có khoảng 60 nhân sự, chia giữa trụ sở Barcelona và nhiều khu vực toàn cầu.
Read More


