
AUD/USD Price Forecast: Wobbles around 0.6900 ahead of Iran’s response to Trump’s ultimatum
Bởi Sagar Dua
Đã cập nhật: 7 Apr 2026


BÀI VIẾT PHỔ BIẾN

The AUD/USD pair trades in a tight range around 0.6900 during the early European trading session on Tuesday.
- AUD/USD trades with caution around 0.6900 ahead of Trump’s Iran deadline.
- US President Trump threatened to destroy Iran’s civilian infrastructure if it doesn’t reopen the Hormuz.
- Investors await the US FOMC minutes and the CPI data.
The AUD/USD pair trades in a tight range around 0.6900 during the early European trading session on Tuesday. The Aussie pair consolidates as investors await Tehran’s response to United States (US) President Donald Trump’s warning to destroy Iranian power plants and bridges if it doesn’t reopen the Strait of Hormuz by Tuesday, 08:00 PM ET.
Market sentiment remains cautious, with the S&P 500 futures trading 0.5% down during the press time. The US Dollar Index (DXY), which tracks the Greenback’s value against six major currencies, trades marginally higher around 100.10.
Ahead of the deadline, statements from Iranian officials indicate that the nation is unlikely to reopen the Hormuz, a scenario that could mark an escalation in the ongoing war. An advisor to Iran's Parliament Speaker Mohammad Bagher Ghalibaf stated that “Trump has about 20 hours to either surrender to Iran, or his allies will return to the Paleolithic Age”.
On the domestic front, investors await the US Federal Open Market Committee (FOMC) minutes of the March policy meeting, which will be released on Wednesday. This week, the major highlight will be the US Consumer Price Index (CPI) data for March, which is scheduled for Friday.
AUD/USD technical analysis
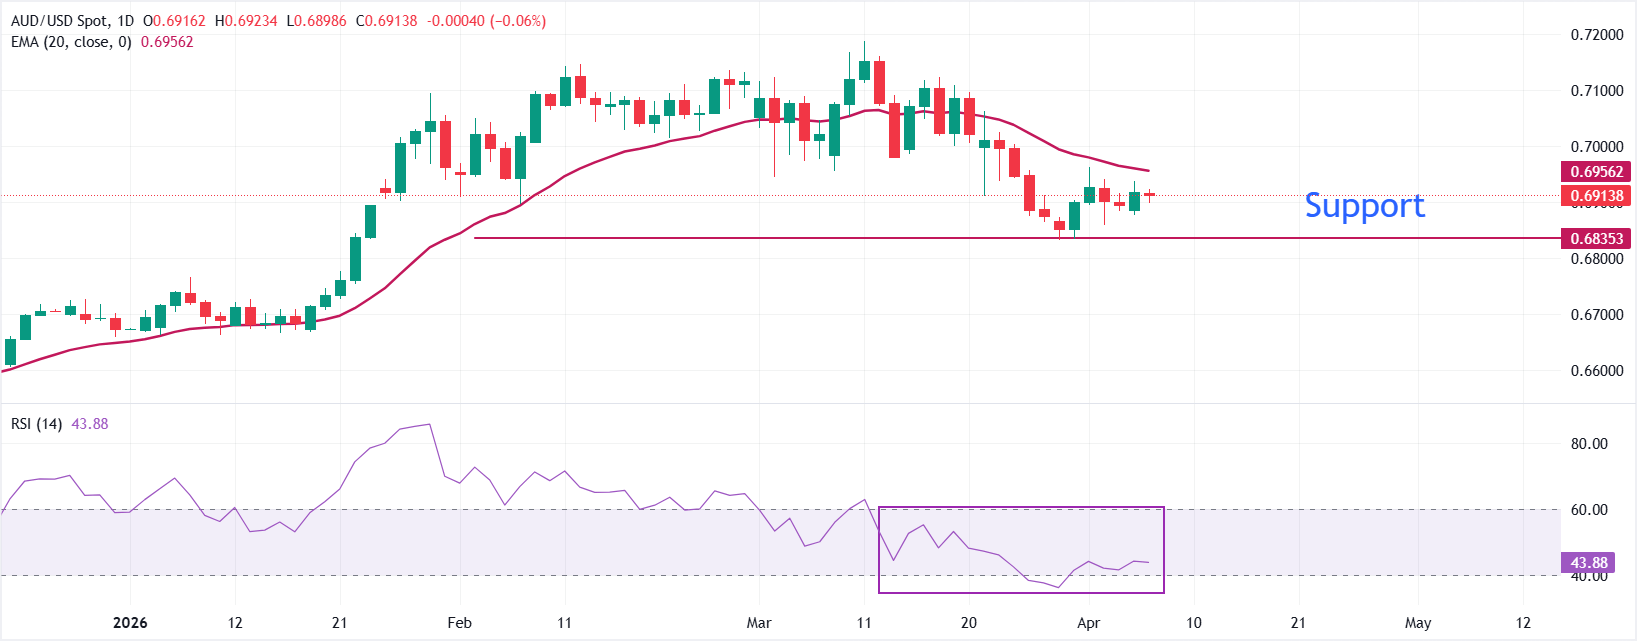
AUD/USD trades cautiously at around 0.6910 as of writing. The near-term bias is mildly bearish as spot holds below the 20-day exponential moving average, which has started to roll over and cap bounces in the 0.6960 area. Price action shows a sequence of lower closes from the 0.71 region, while the RSI has slipped below the 50 line and stabilizes in the low-40s, confirming building downside momentum rather than oversold conditions.
Initial resistance emerges at the 20-day EMA near 0.6960, with a break above exposing the March 23 high around 0.7060 as the next barrier. On the downside, immediate support stands at 0.6880, guarding the recent trough at 0.6835. A daily close below 0.6835 would extend the bearish phase toward the 0.6800 handle, while recovery above 0.6960 would ease selling pressure and open a corrective phase within the broader range.
(The technical analysis of this story was written with the help of an AI tool.)
Economic Indicator
FOMC Minutes
FOMC stands for The Federal Open Market Committee that organizes 8 meetings in a year and reviews economic and financial conditions, determines the appropriate stance of monetary policy and assesses the risks to its long-run goals of price stability and sustainable economic growth. FOMC Minutes are released by the Board of Governors of the Federal Reserve and are a clear guide to the future US interest rate policy.
Next release: Wed Apr 08, 2026 18:00
Frequency: Irregular
Consensus: -
Previous: -
Source: Federal Reserve
Minutes of the Federal Open Market Committee (FOMC) is usually published three weeks after the day of the policy decision. Investors look for clues regarding the policy outlook in this publication alongside the vote split. A bullish tone is likely to provide a boost to the greenback while a dovish stance is seen as USD-negative. It needs to be noted that the market reaction to FOMC Minutes could be delayed as news outlets don’t have access to the publication before the release, unlike the FOMC’s Policy Statement.

Hơn một triệu người dùng dựa vào FXStreet để có dữ liệu thị trường thời gian thực, công cụ biểu đồ, góc nhìn chuyên gia và tin tức Forex. Lịch kinh tế toàn diện và các hội thảo web giáo dục giúp nhà giao dịch luôn cập nhật và đưa ra quyết định có tính toán. FXStreet có khoảng 60 nhân sự, chia giữa trụ sở Barcelona và nhiều khu vực toàn cầu.
Đọc thêm


