
Bitcoin Price Forecast: BTC falls below $64K as demand turns negative, short-term holders' selling intensifies
Bởi Michael Ebiekutan
Đã cập nhật: 4 Jun 2026


BÀI VIẾT PHỔ BIẾN

Bitcoin (BTC) has fallen below $64,000 on Thursday amid weakening market demand and mounting selling pressure from short-term holders (STHs).
- Bitcoin drops below $64,000 as market demand dips to its weakest level of the current cycle, with selling pressure outweighing buying activity.
- Short-term holders recorded their largest capitulation event this year, transferring 53,800 BTC to exchanges at a loss.
- BTC quickly recovered the $62,520 support after briefly dipping below it.
Bitcoin (BTC) has fallen below $64,000 on Thursday amid weakening market demand and mounting selling pressure from short-term holders (STHs). The leading cryptocurrency slipped toward the $63,000 level amid a broader risk-off environment, with several key metrics signaling one of the most challenging periods of the current market cycle.
Bitcoin demand falls to worst level of current cycle
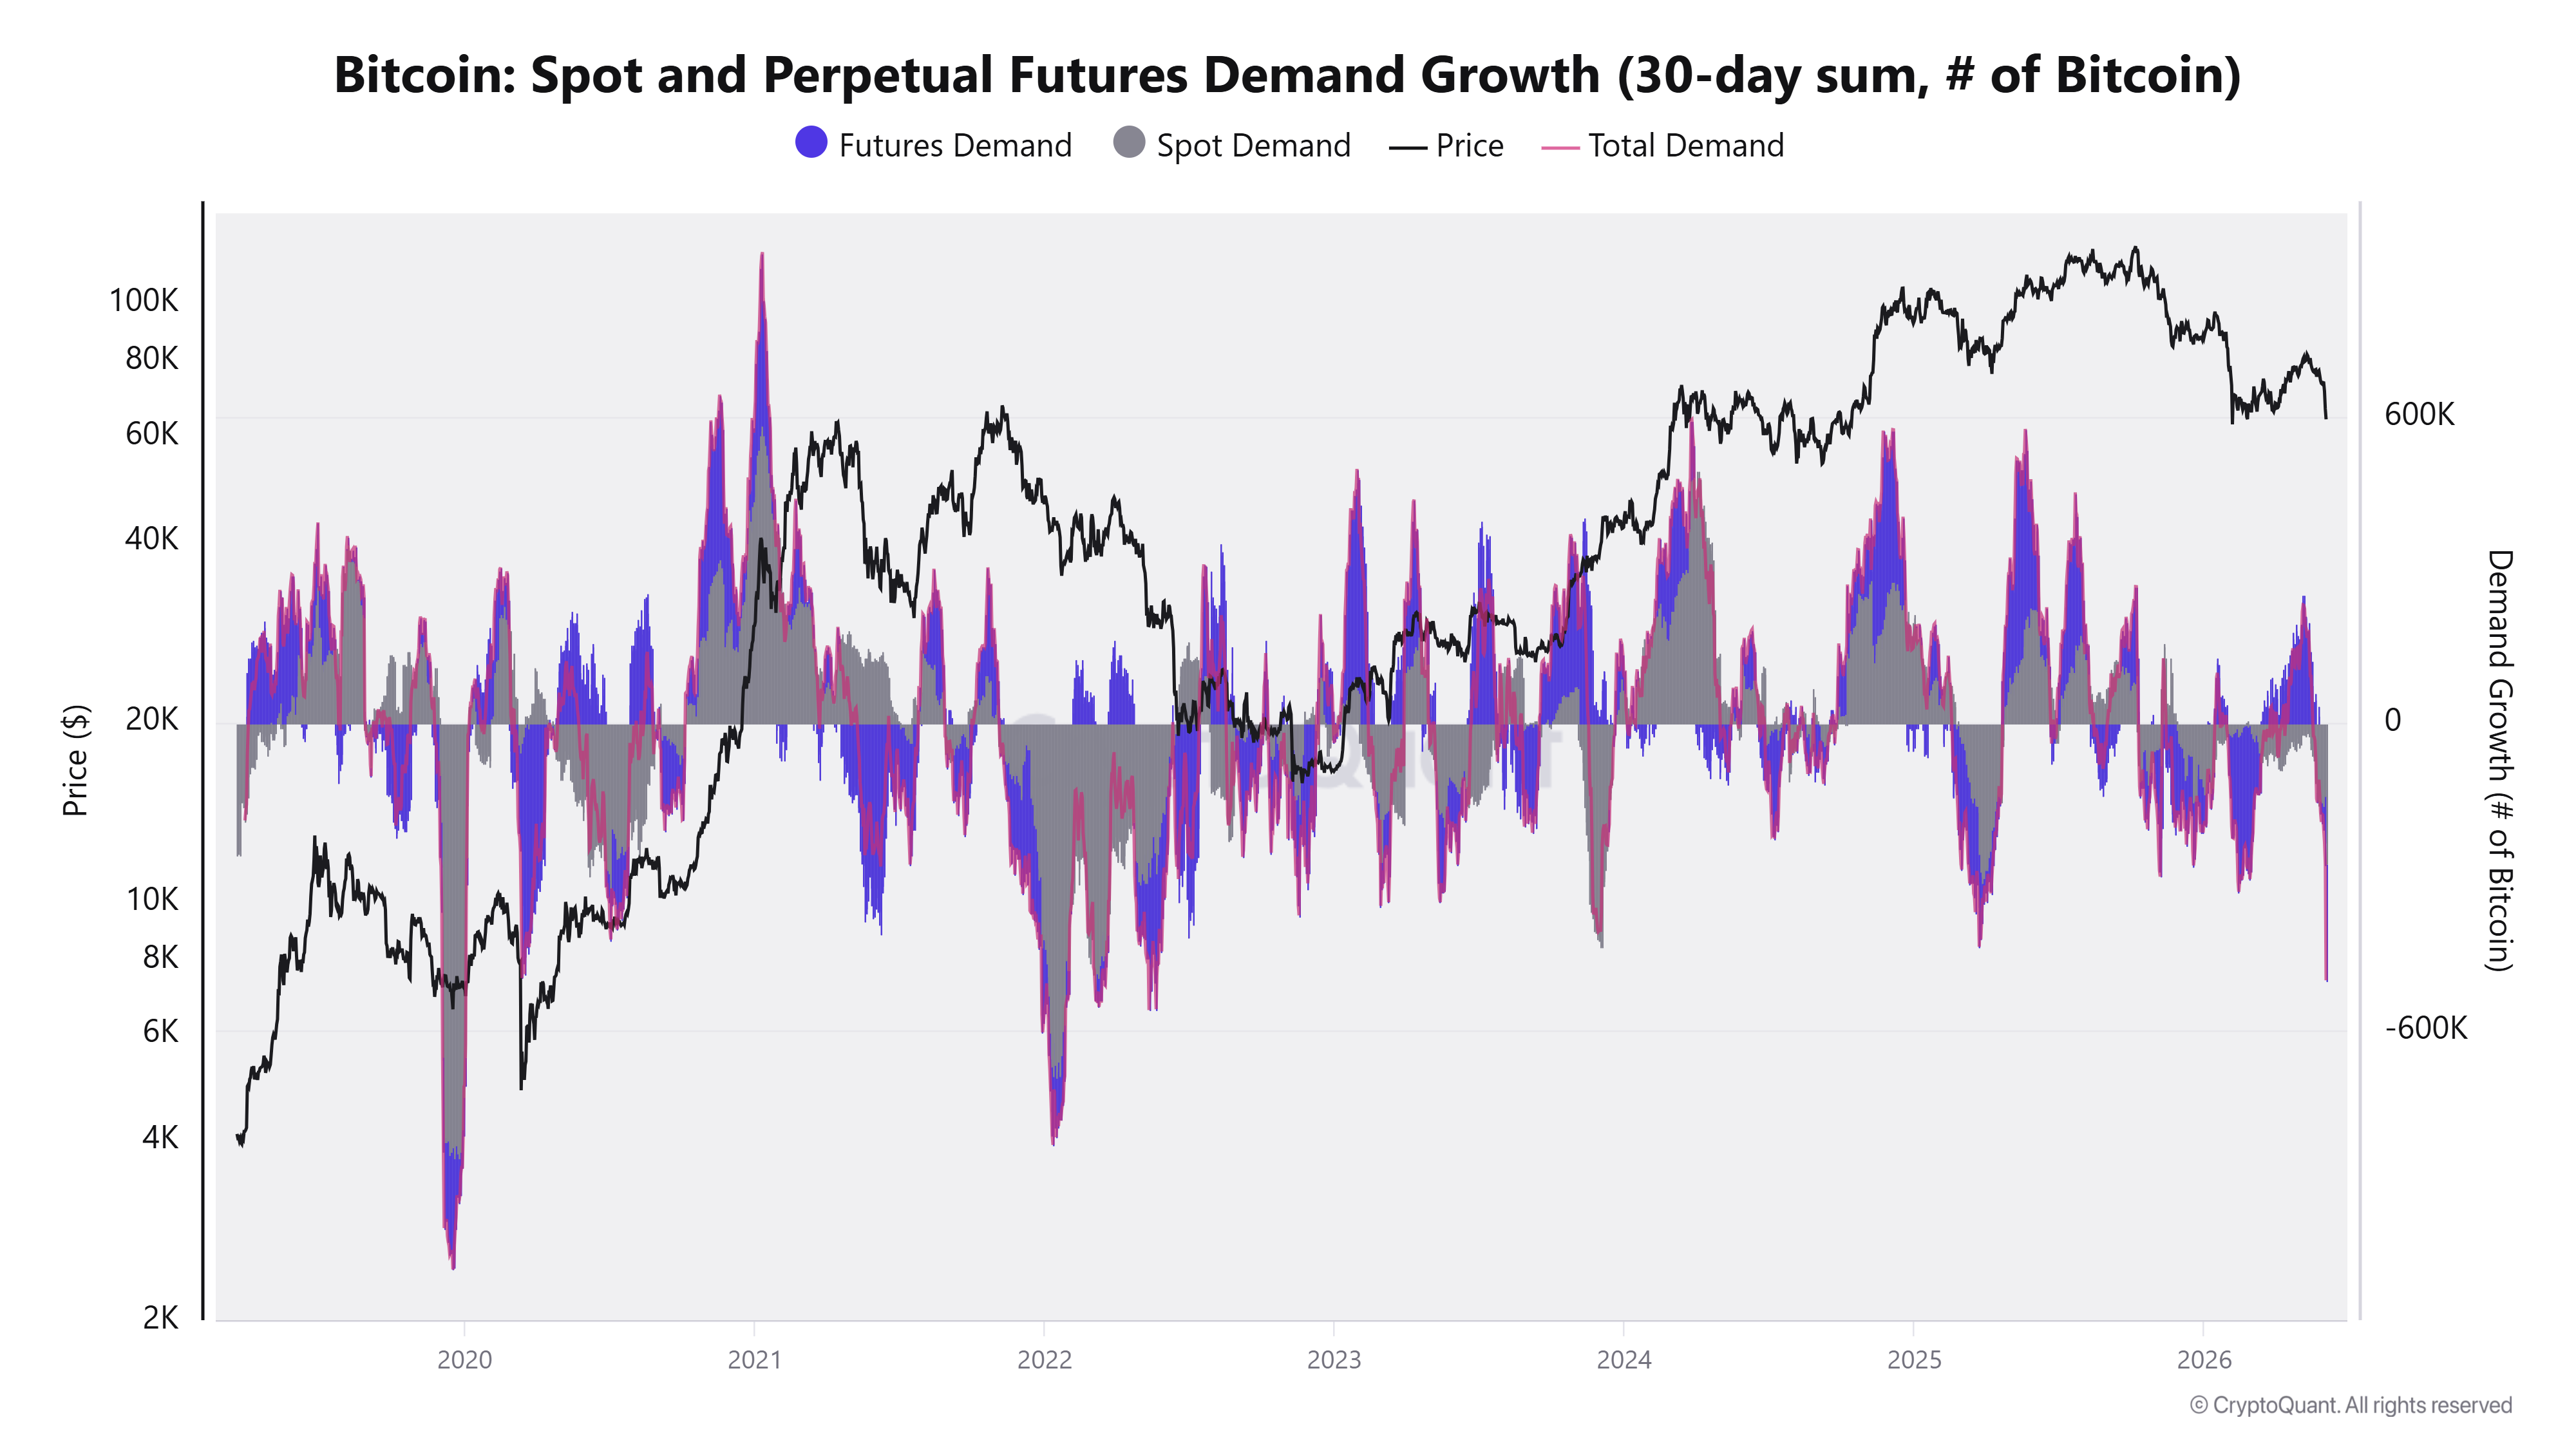
Global Bitcoin demand has reached its weakest level since the previous bear cycle, highlighting a deterioration in activity across both spot and derivatives markets, according to a market commentary by CryptoQuant analyst Darkfost on Thursday.
The analyst noted that spot demand has fallen to -272,000 BTC on a 30-day cumulative basis and has remained in negative territory for most of the year. Similarly, futures demand has declined to -229,000 BTC, bringing total demand contraction to approximately 501,000 BTC. The figures suggest that selling pressure continues to outpace buying activity across the market, despite intermittent periods of institutional participation.
The analyst attributed the weakness to a challenging macroeconomic backdrop, including elevated bond yields, inflationary pressures and growing geopolitical uncertainty surrounding the Strait of Hormuz.
"In this environment, available liquidity is flowing more toward equity markets driven by tech and AI, or even into Forex and precious metals," Darkfost wrote.
Short-term holders record heavy capitulation
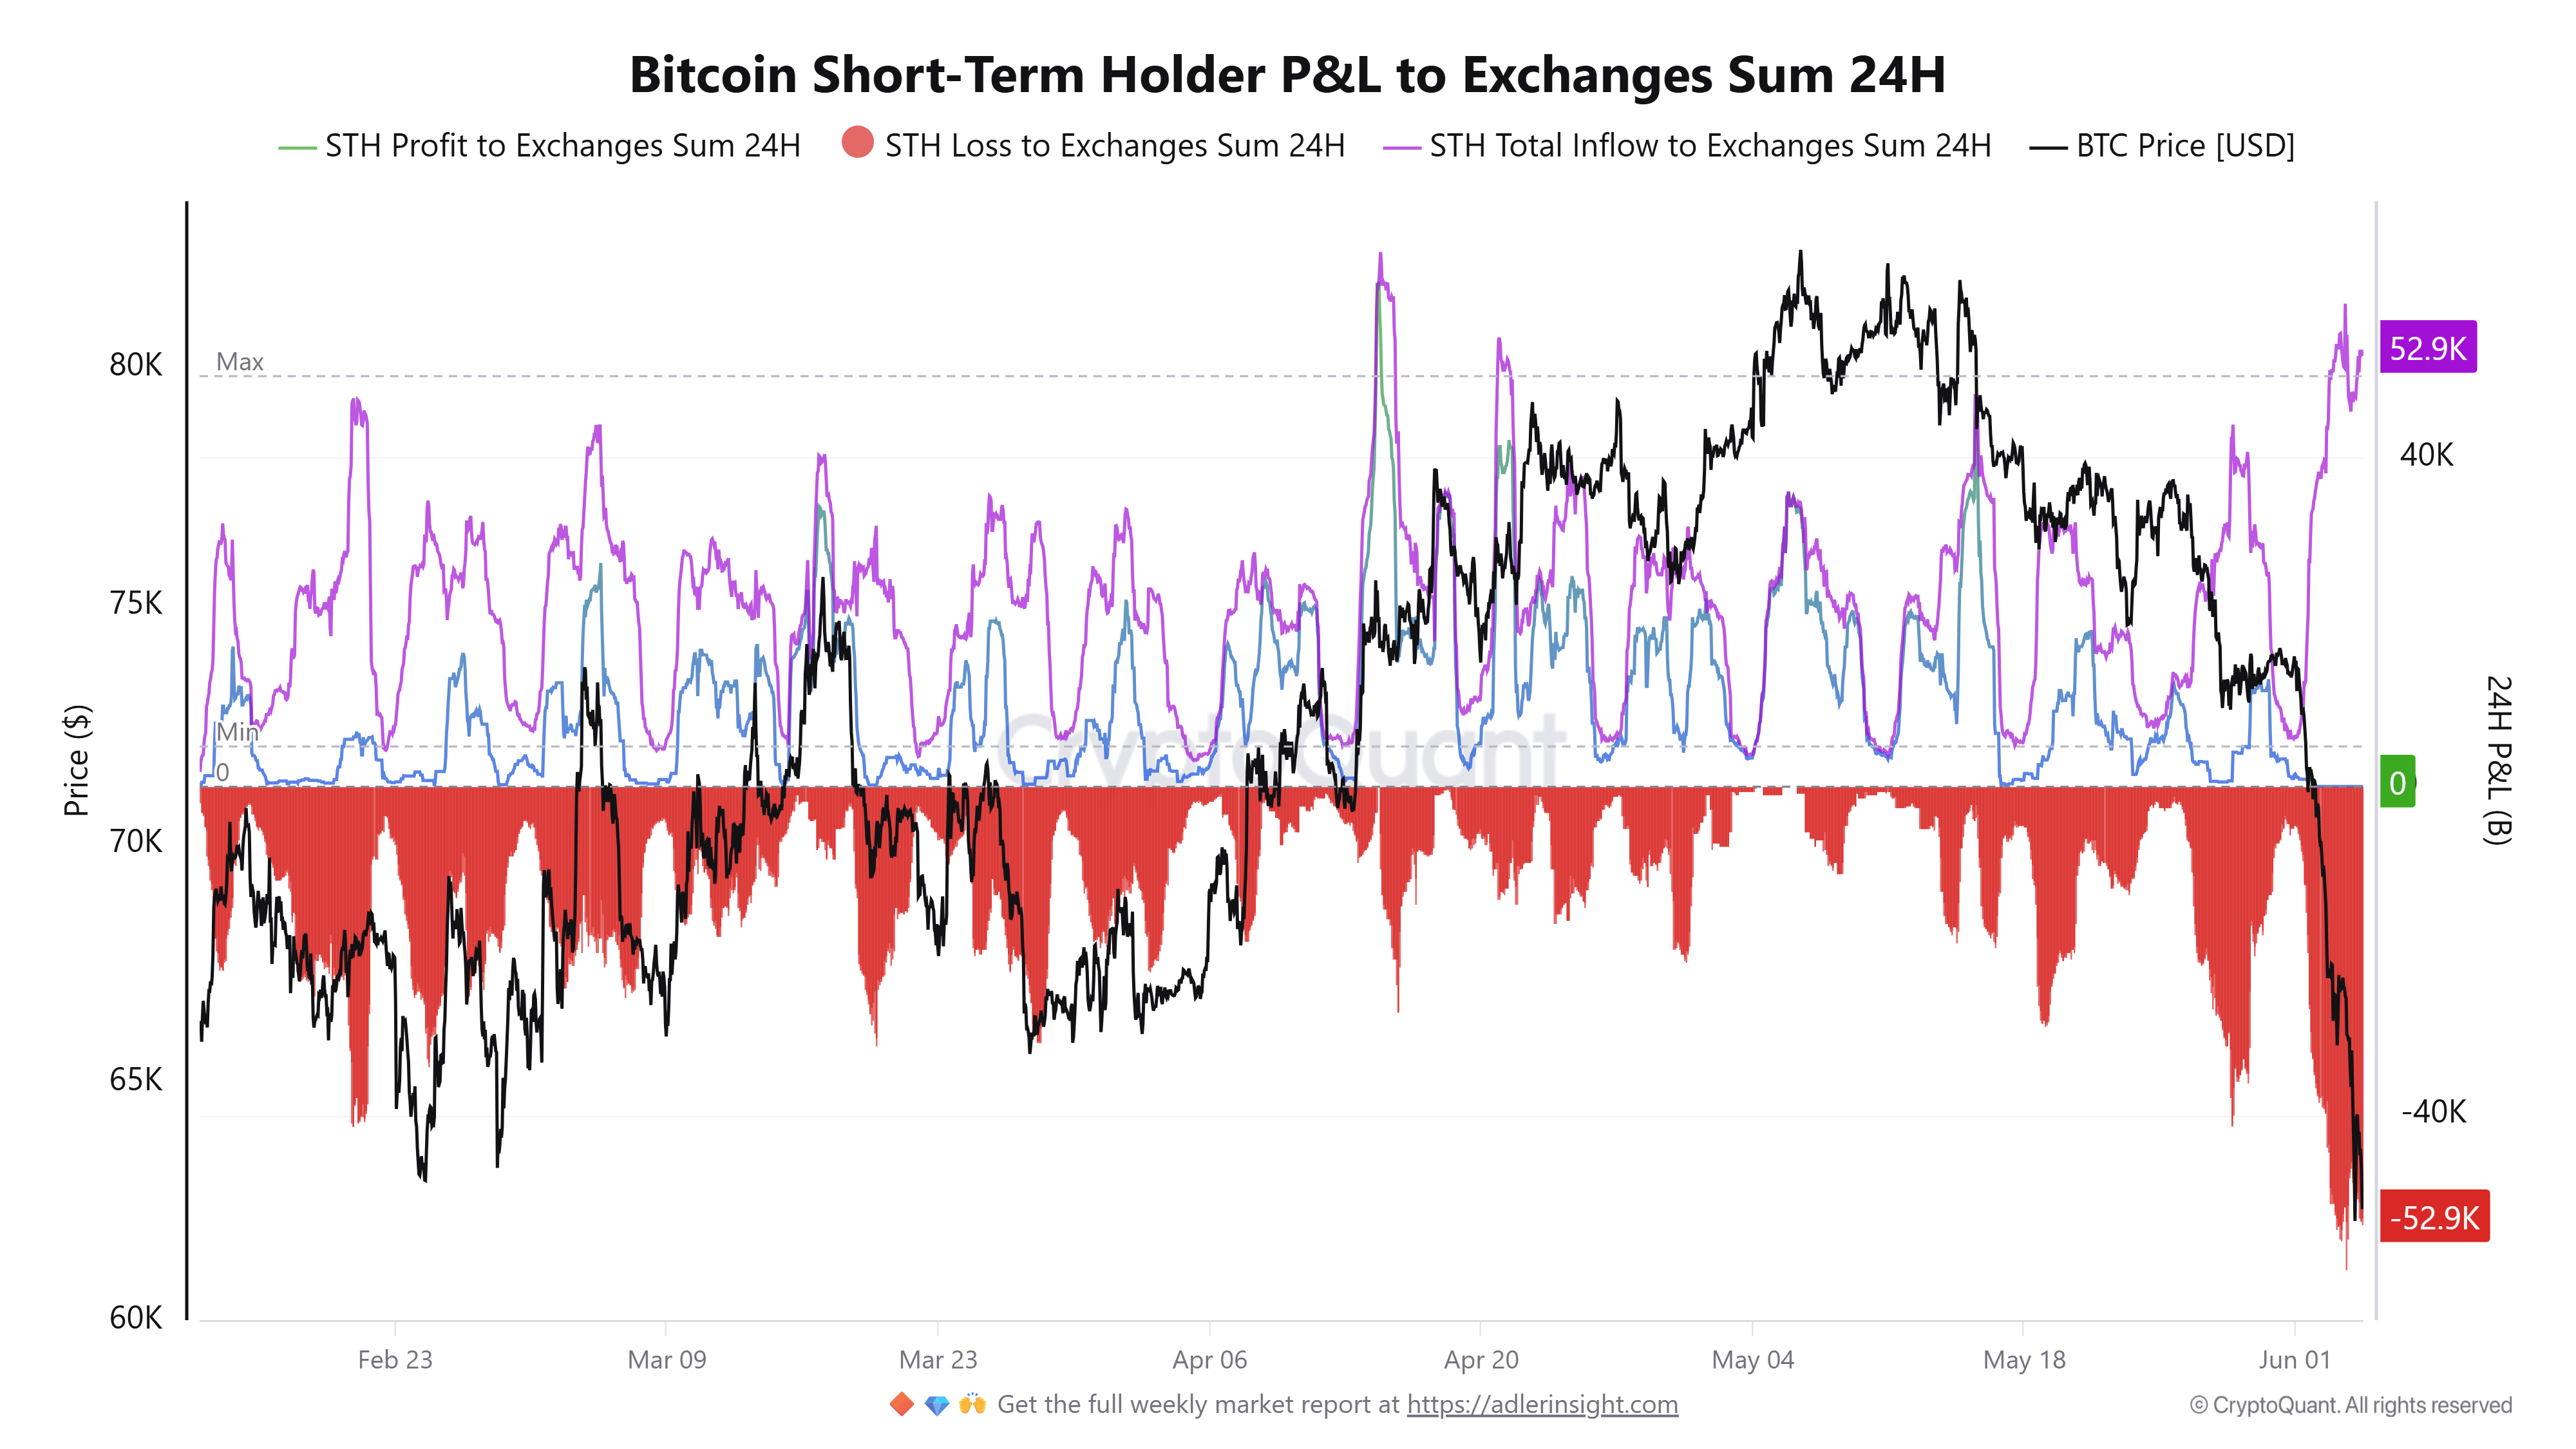
Short-term holders also registered their largest capitulation event of the year. CryptoQuant analyst MorenoDV stated in another commentary that approximately 53,800 BTC were transferred to exchanges at a loss, while inflows from profitable positions dropped to zero. The imbalance highlights growing panic among recent buyers as unrealized losses deepen.
The analyst noted that while such capitulation events often emerge near local bottoms, they should not be viewed as standalone reversal signals.
"Historically, peaks in loss-driven STH inflows cluster around local capitulation events. They mark weak hands flushing out and supply transferring from over-leveraged late entrants to higher-conviction holders, the kind of stress that often precedes, but never guarantees, a local low," MorenoDV_ wrote.
However, the analyst warned that persistent outflows could prolong the current correction if demand fails to recover.
Strategy's losses add to recent market pressure
The market decline intensified after Strategy disclosed its first Bitcoin sale in over 4 years on Monday. The company sold 32 BTC for approximately $2.5 million to fund preferred stock dividend distributions, weighing on market sentiment.
The company's Bitcoin position is now facing its largest-ever unrealized loss, estimated at approximately $10.8 billion, according to a Thursday X post by The Kobeissi Letter. The post estimates that after six years of Bitcoin accumulation, Strategy is currently down roughly 17% on its aggregate position, while the S&P 500 is up by roughly 116% during the same period.
Bitcoin Price Forecast: BTC quickly recovers $62,520 support
On the daily chart, BTC is extending a corrective slide below the 20-, 50- and 100-day Exponential Moving Averages (EMAs), which now fan out as layered resistance between roughly $72,900 and $75,800, keeping the near-term bias bearish.
The Relative Strength Index (RSI) is deeply oversold near 18, while the Stochastic Oscillator (Stoch) also hovers in oversold territory, hinting that downside momentum could be stretched even as price remains capped by the overhead EMA cluster.
On the topside, initial resistance appears at the horizontal barrier near $65,103, followed by a confluence zone around the 20-day EMA at $72,874 and the horizontal level at $74,012, before the 50-day EMA at $74,769 and the 100-day EMA at $75,796 come into play. A daily close back above this band would be needed to ease the prevailing bearish pressure.
On the downside, immediate support is seen at $62,520, with further cushions at $59,058 and then $55,770, where buyers would need to defend to prevent the corrective phase from evolving into a deeper bearish reversal.
(The technical analysis of this story was written with the help of an AI tool.)

Hơn một triệu người dùng dựa vào FXStreet để có dữ liệu thị trường thời gian thực, công cụ biểu đồ, góc nhìn chuyên gia và tin tức Forex. Lịch kinh tế toàn diện và các hội thảo web giáo dục giúp nhà giao dịch luôn cập nhật và đưa ra quyết định có tính toán. FXStreet có khoảng 60 nhân sự, chia giữa trụ sở Barcelona và nhiều khu vực toàn cầu.
Đọc thêm


