
Bitcoin Price Forecast: BTC risks losing $70,000 as AI and chip rally steal the spotlight
Bởi Vishal Dixit
Đã cập nhật: 1 Jun 2026


BÀI VIẾT PHỔ BIẾN

Bitcoin (BTC) edges below $73,000 at press time on Monday, extending its decline under the prevailing downside pressure from three consecutive weeks of losses.
- Bitcoin edges below $73,000 on Monday, extending the losses seen in the past three weeks.
- Bitcoin ETF outflows cross $1 billion for the third straight week, reinforcing bearish institutional sentiment.
- The US and Korean premium indices continue to decline, suggesting the AI and chip rally is eclipsing demand for BTC in its top markets.
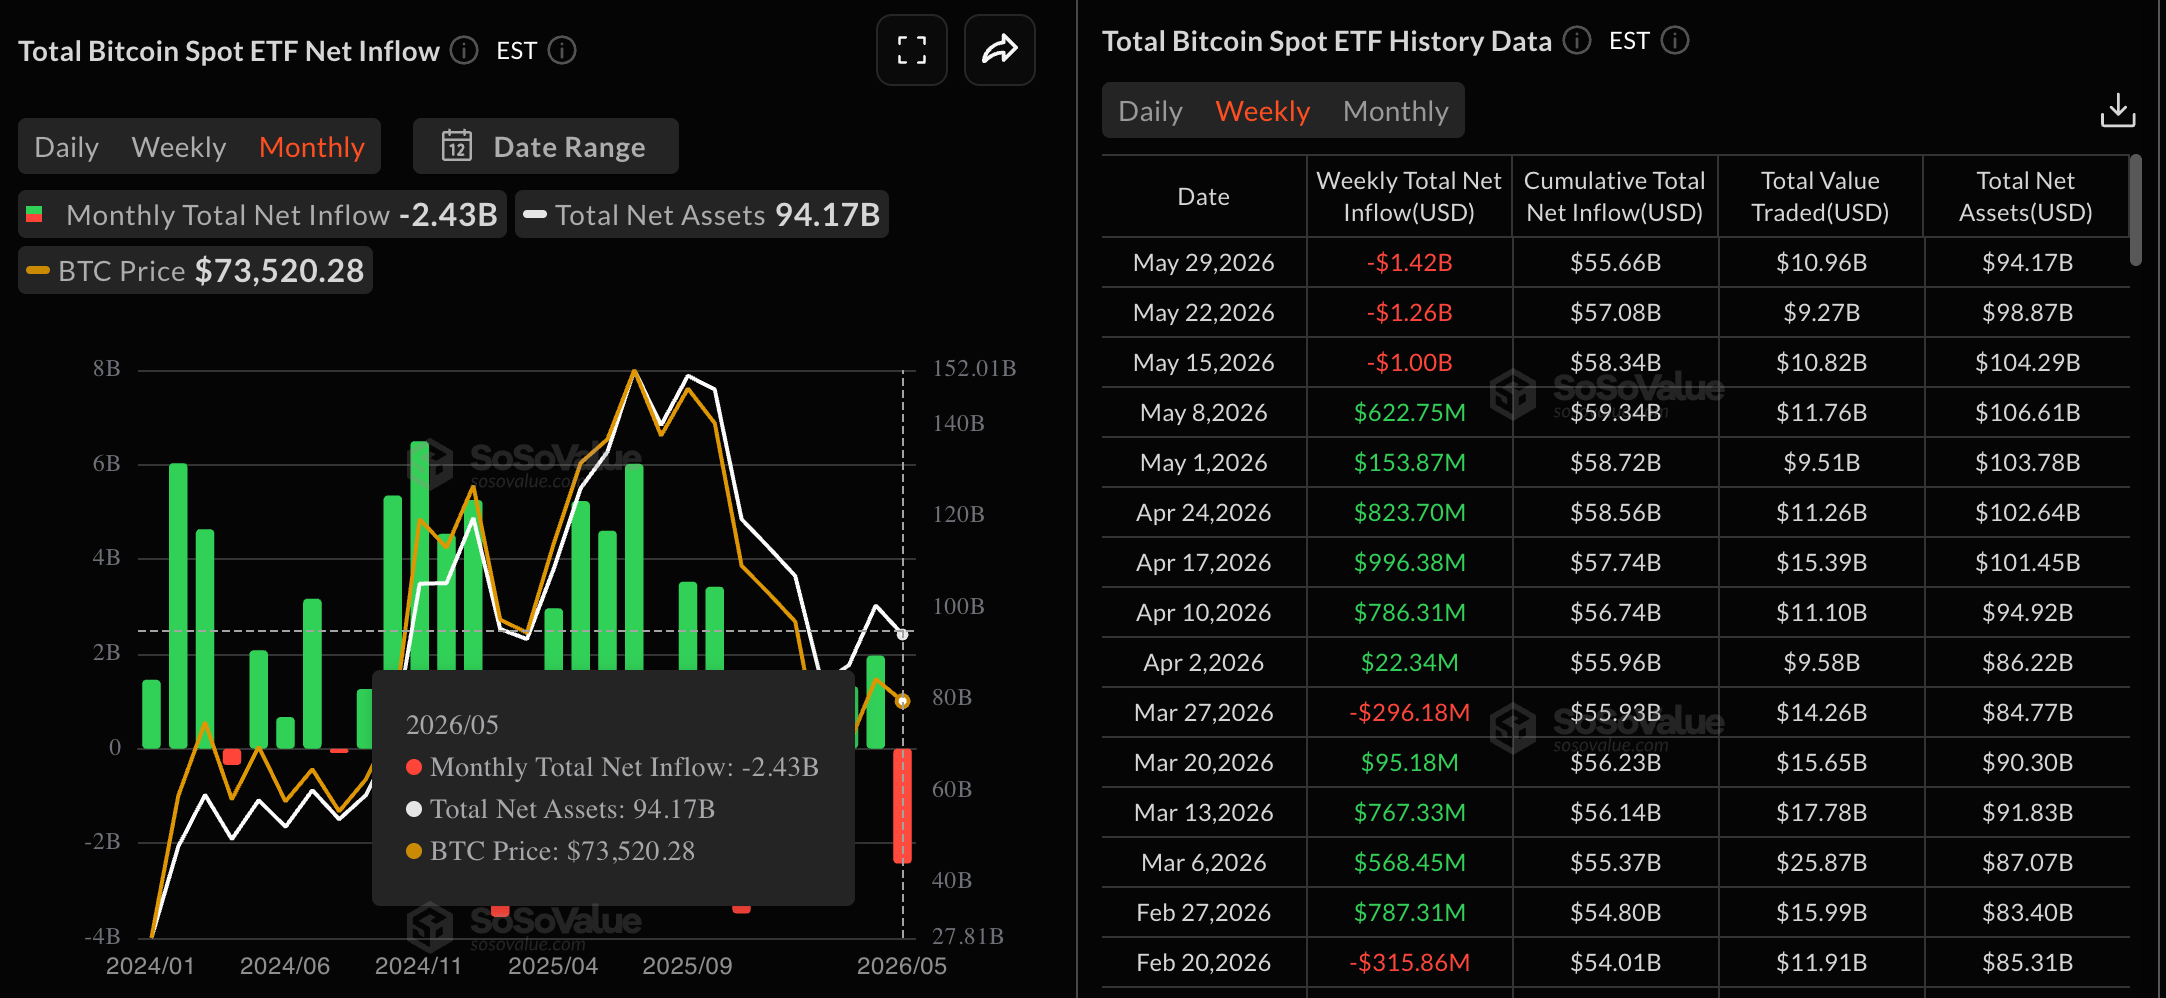
Bitcoin (BTC) edges below $73,000 at press time on Monday, extending its decline under the prevailing downside pressure from three consecutive weeks of losses. Dark clouds are gathering over Bitcoin as institutional investors shed $2.43 billion in BTC from Exchange-Traded Funds (ETFs) over the last month, and the US and Korean crypto premium indices flip negative amid the AI and chip rally.
Bitcoin ETFs record their largest monthly outflow in 2026
Traditional financial institutions in the crypto market have become a price-dictating factor due to their large investment pool. Typically, inflows fuel or support recovery while outflows reduce retail sentiment, further worsening the pullback.
CoinGlass data show institutions are reducing their Bitcoin exposure at a record pace, with total net assets dropping to $94.17 billion in May, from $100.53 billion a month earlier. BTC-focused ETFs recorded $1.42 billion in outflows last week, marking the third consecutive weekly outflow of over $1 billion and the largest monthly amount of $2.43 billion so far in 2026.
AI and Chip stocks outshine Bitcoin in the US and Korea
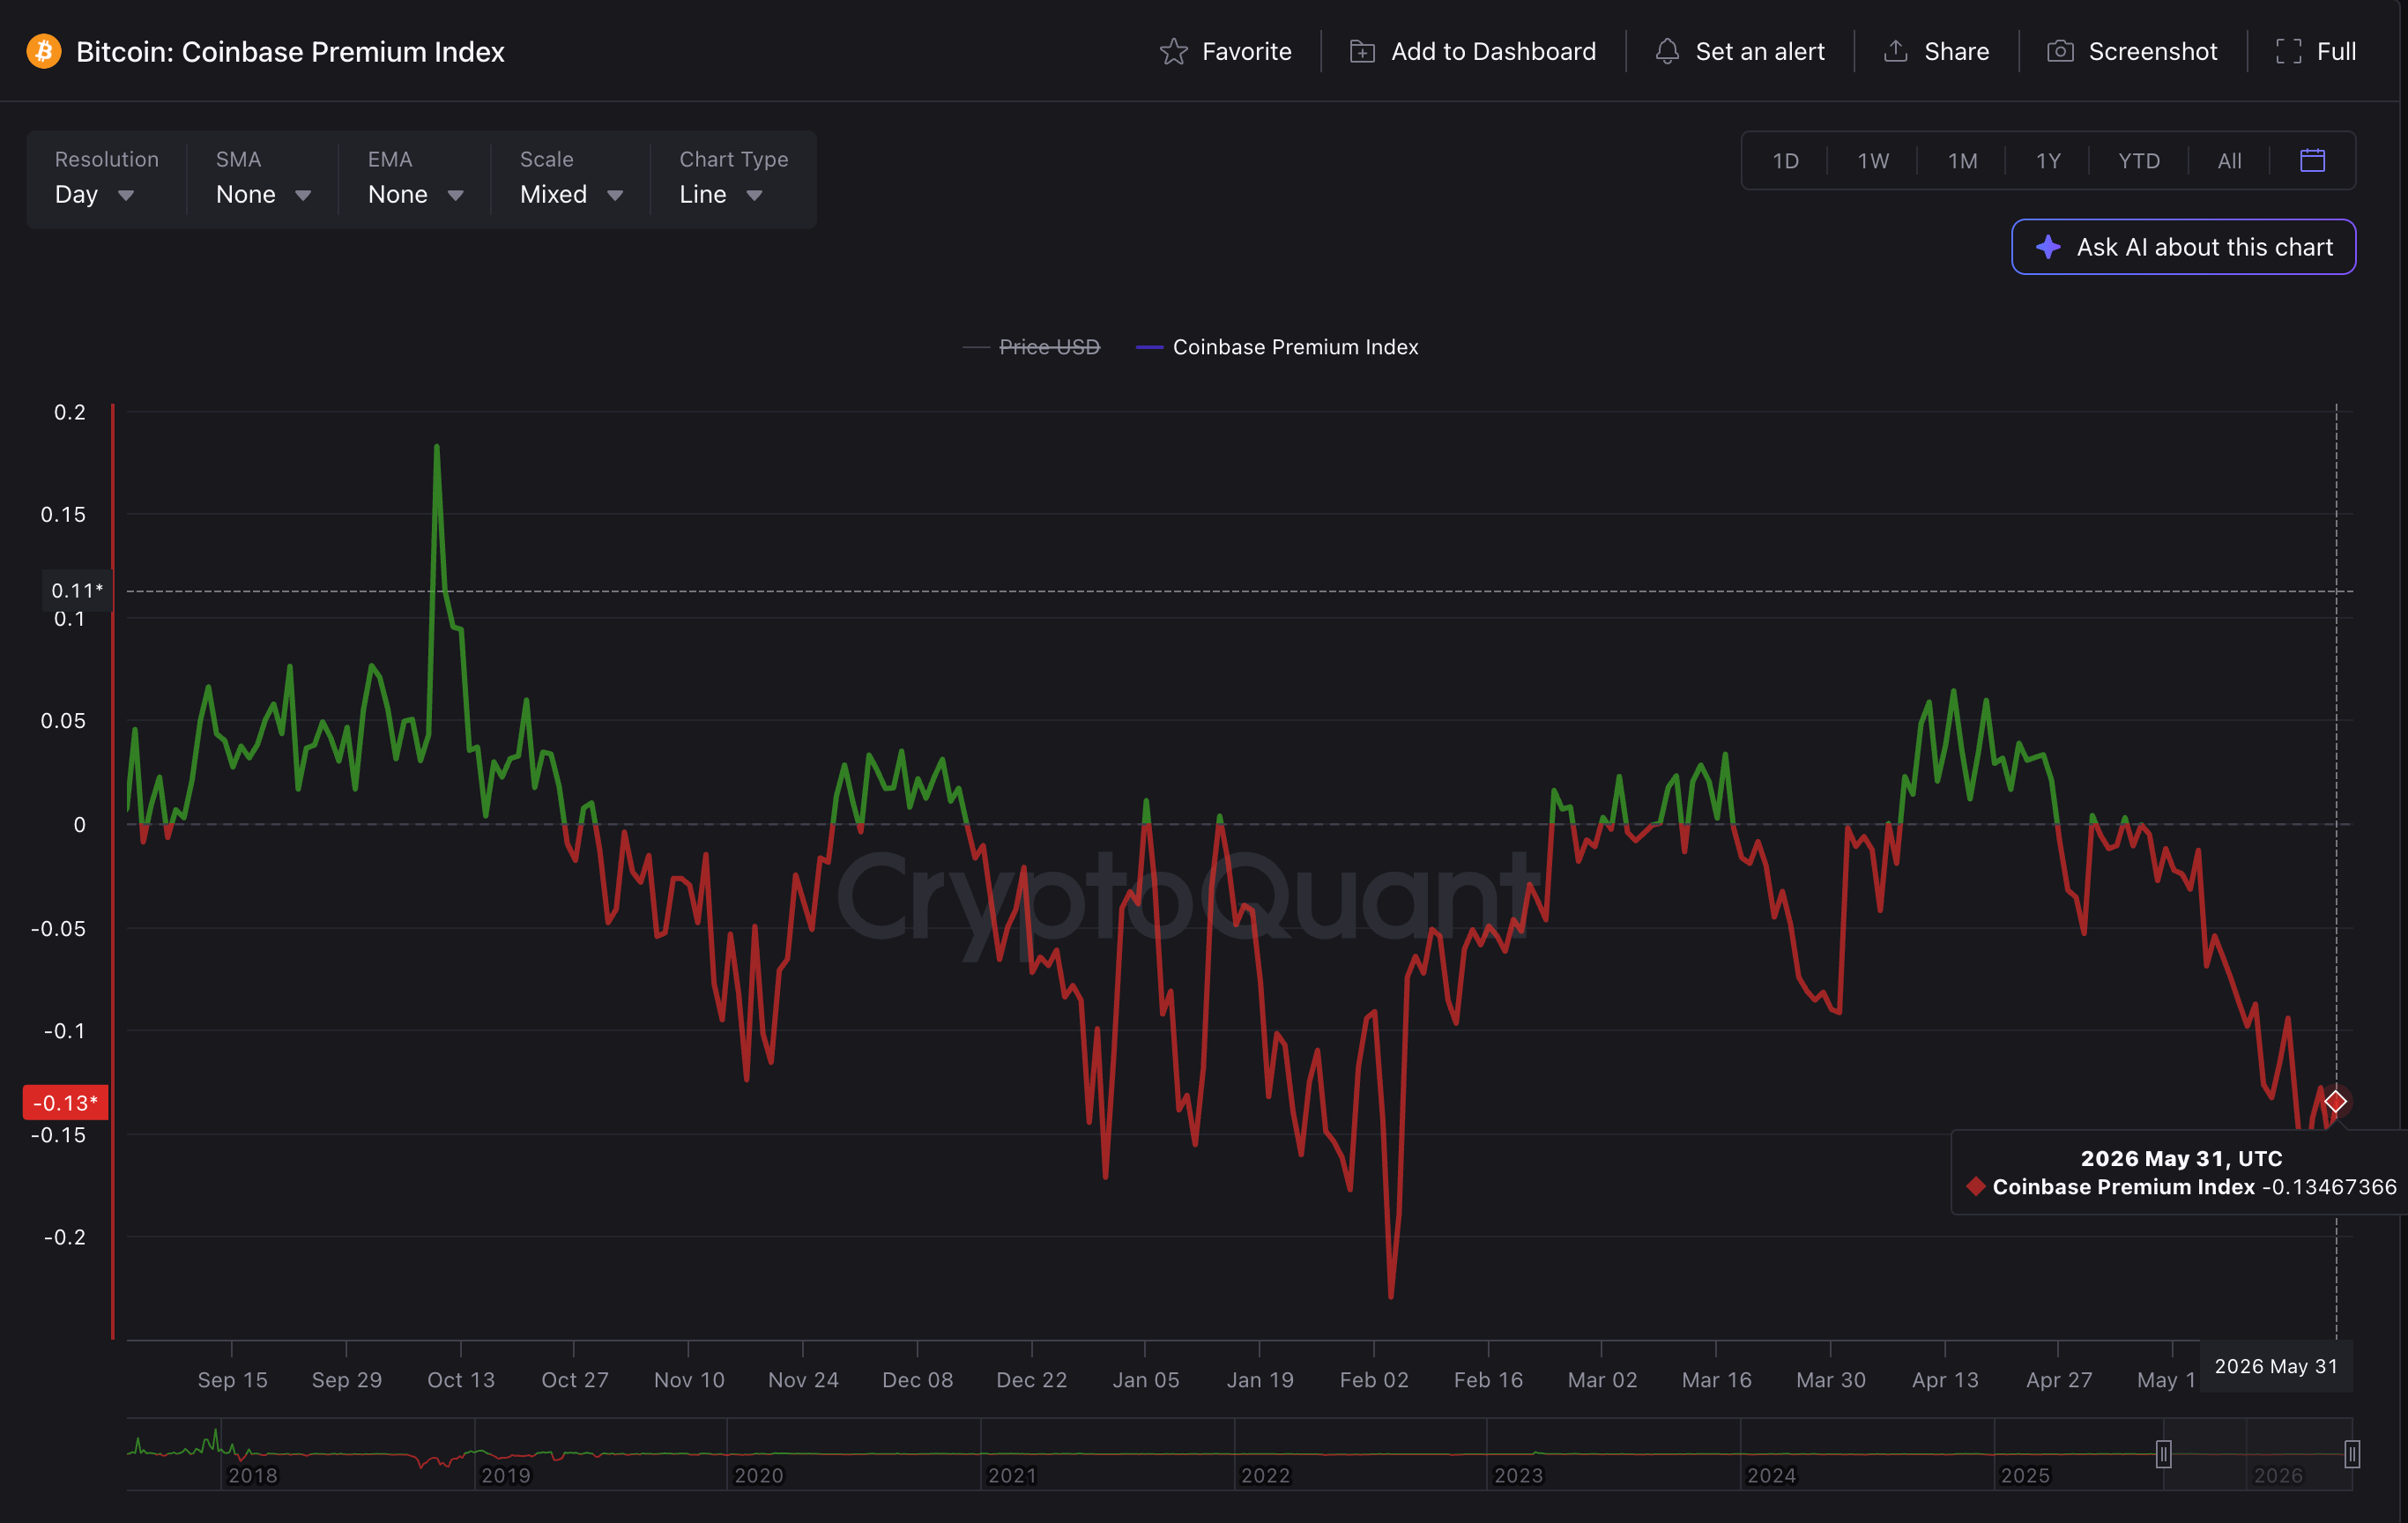
Consistent outflows from Bitcoin ETFs suggest investors could be pulling capital away from crypto toward the stock market amid a rally in AI and chip stocks. CryptoQuant data show that the Bitcoin Premium Index, which tracks the price difference between the domestic and decentralized markets, has flipped negative. In the US market, Coinbase's premium is down to -0.13, indicating softened demand among retail American investors.
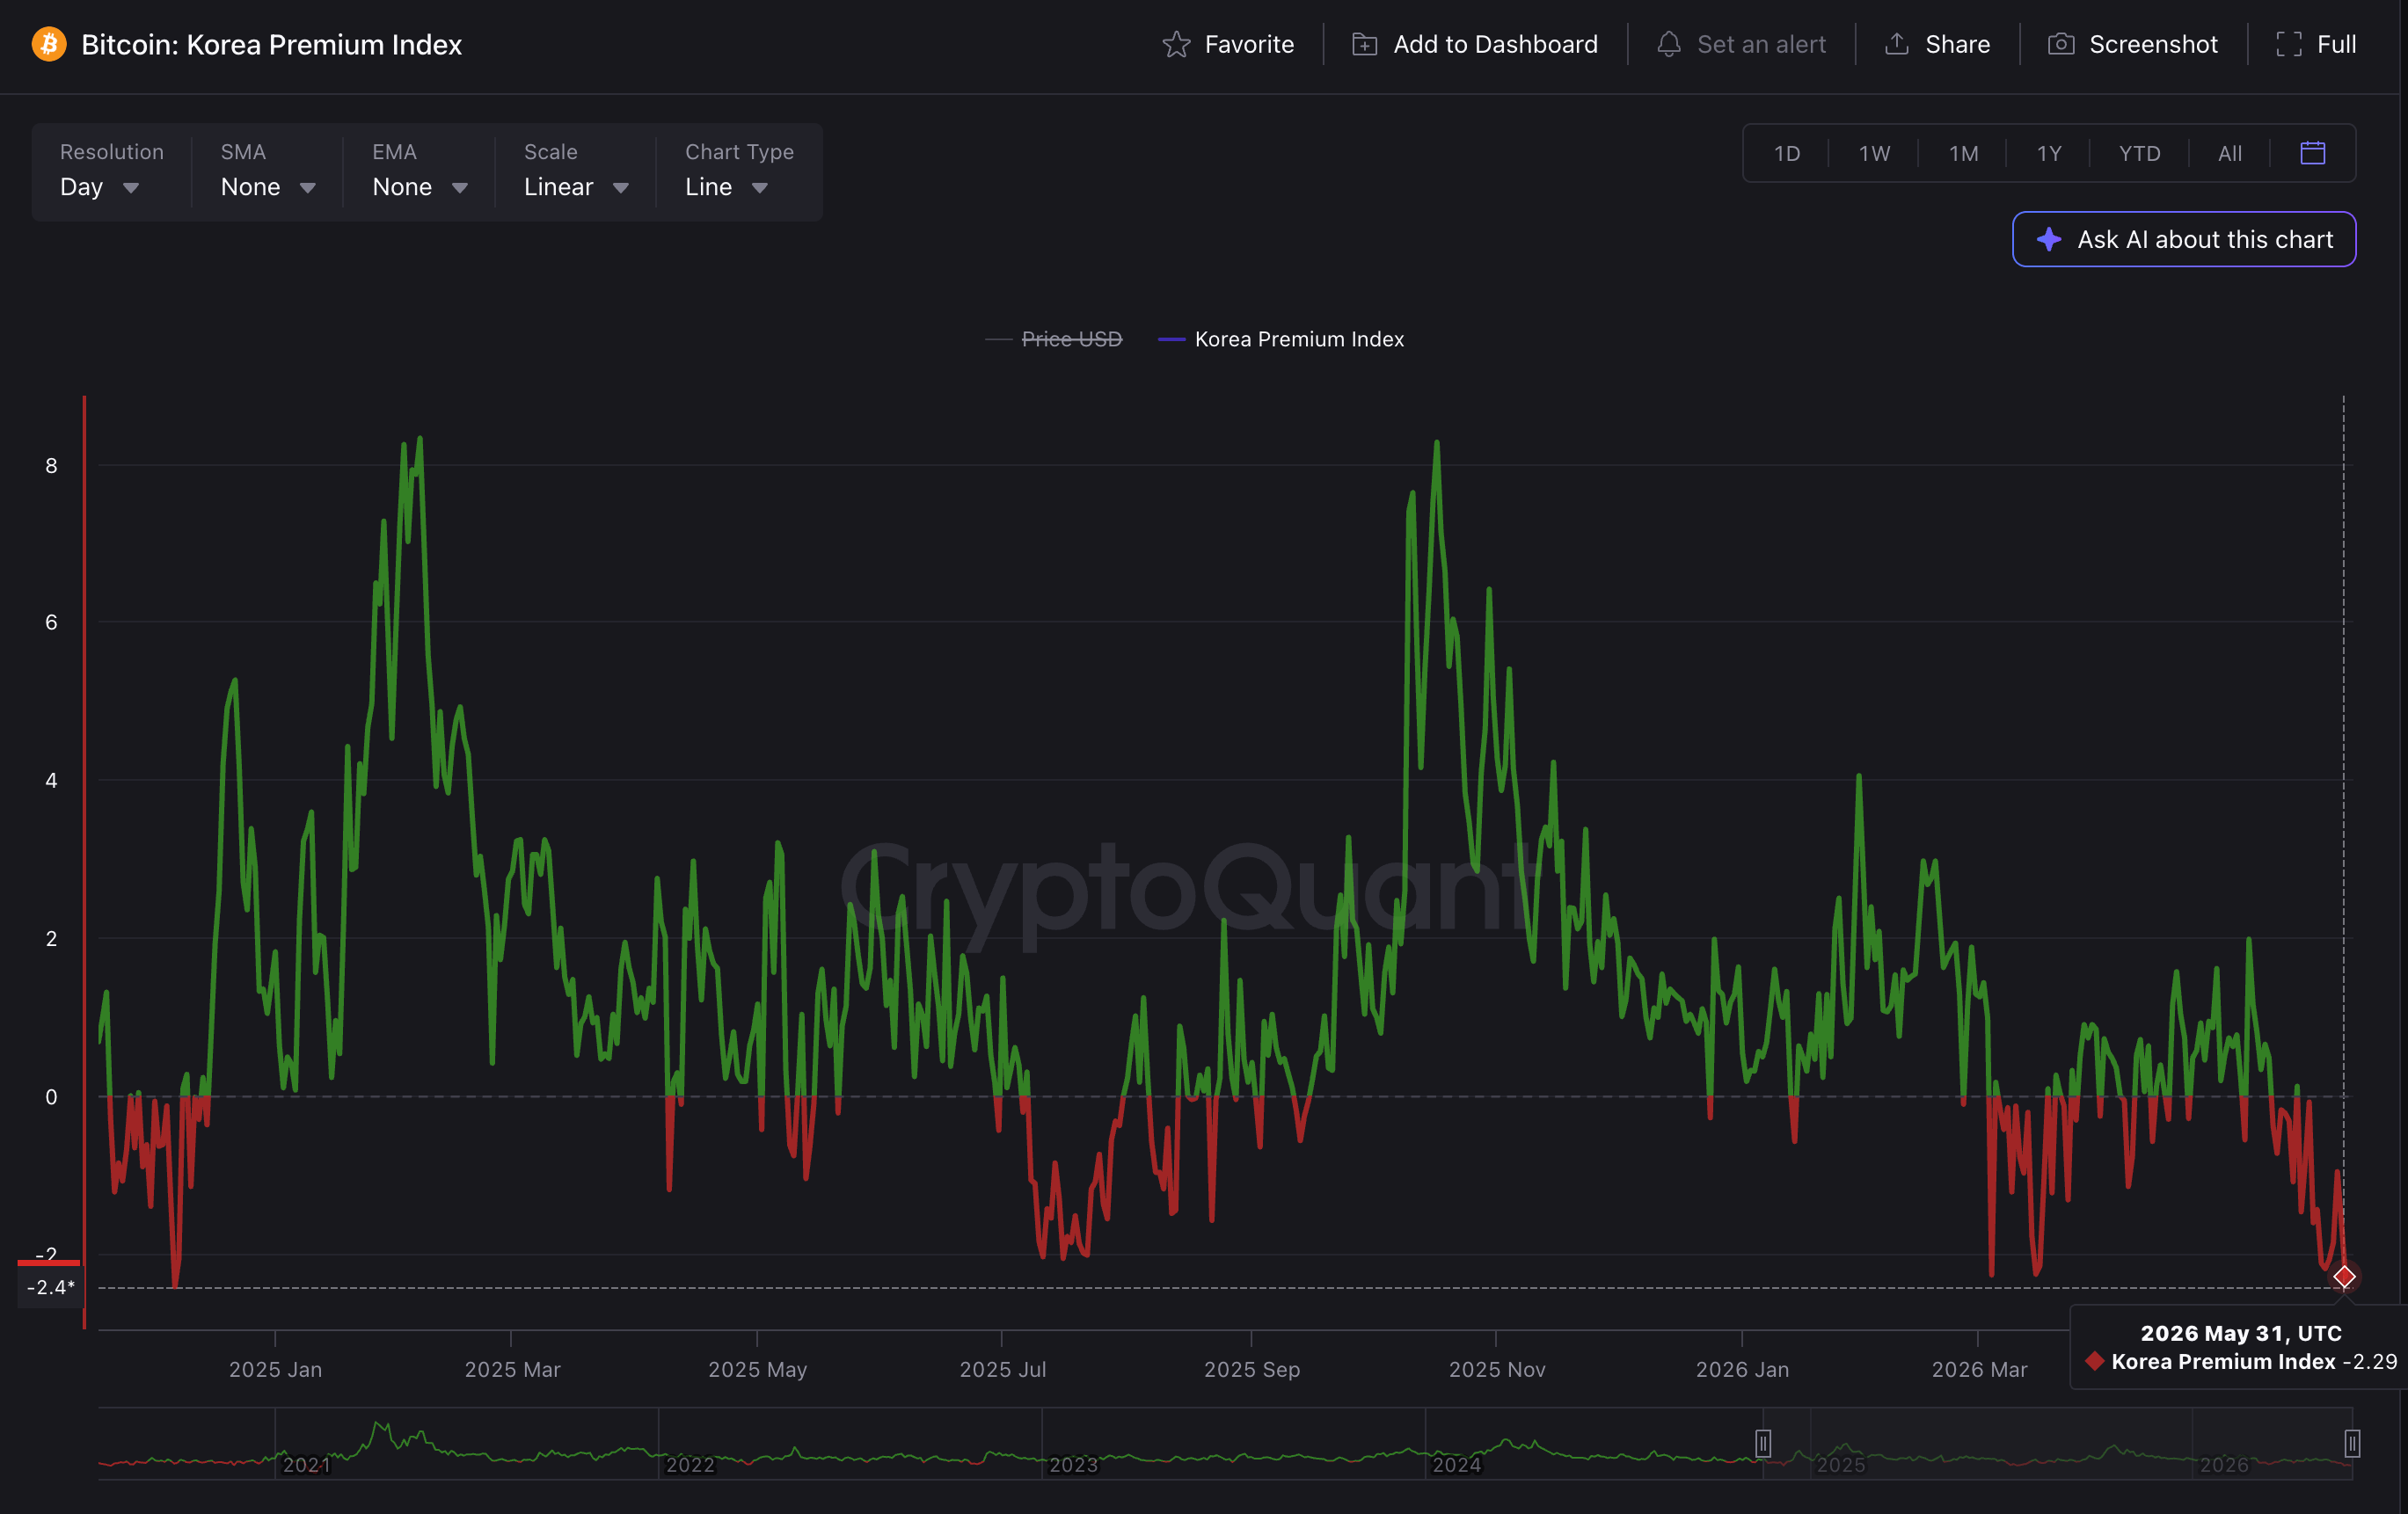
Similarly, the Korea Premium Index, which tracks demand in the South Korean retail market, has dropped to -2.29, its lowest level since December 2024.
Technical outlook: Will Bitcoin break below $70,000?
Bitcoin trades below $73,000 at press time on Monday, risking a drop below a short-term consolidation range between Thursday's high of $74,590 and low of $72,582. The intraday pullback risks a downside breakout below $72,582, which could threaten the rising support trendline near $71,300 and the April 12 low at $70,505. Beyond this, the next line of defense for King Crypto emerges at the lows of March 29 and February 6 at $65,000 and $60,000, respectively.
Bitcoin maintains a bearish near-term bias below the key Exponential Moving Averages (EMAs), which are now reinforcing a corrective tone. Momentum stays heavy as the Relative Strength Index (RSI) at 34 edges toward the oversold territory on the daily chart. At the same time, the Moving Average Convergence Divergence (MACD) extends a negative slope below its signal and zero lines, suggesting downside pressure is still dominant.
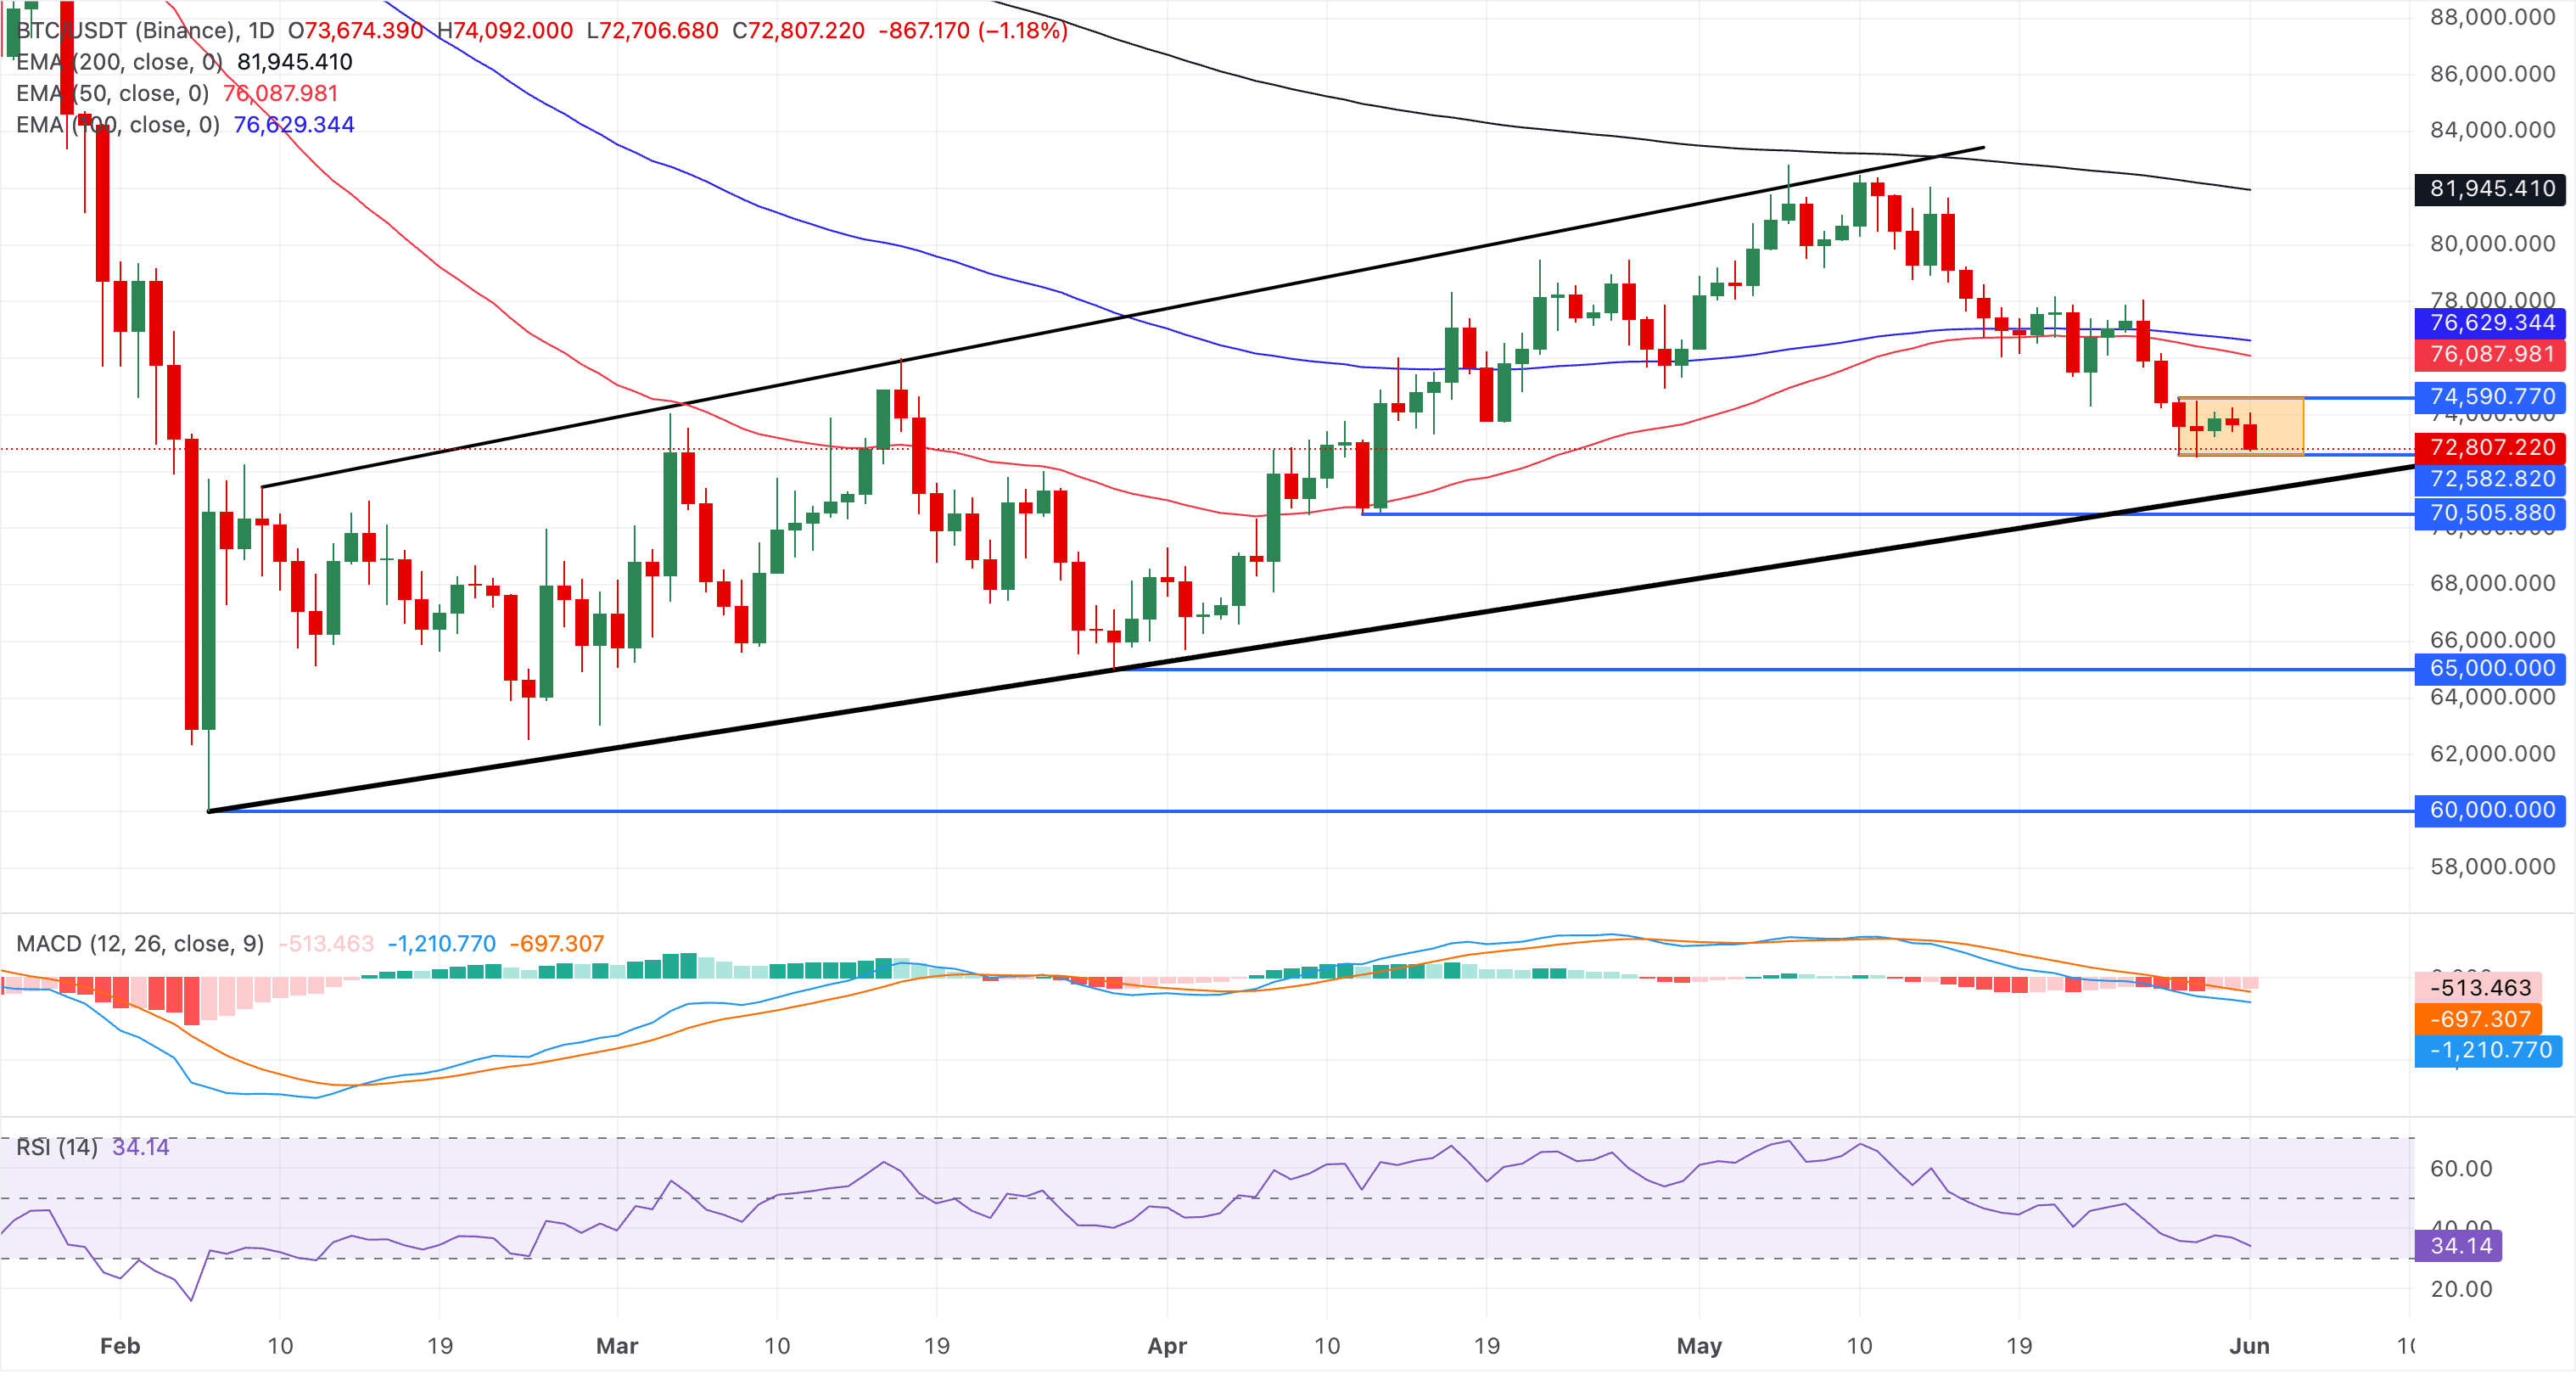
On the topside, immediate resistance is at the 50-day and 100-day EMAs at $76,087 and $76,629, which act as a broader bullish validation level that buyers would need to reclaim to reassert a stronger uptrend. Meanwhile, the 200-day EMA up at $81,945 marks a more distant structural barrier.
(The technical analysis of this story was written with the help of an AI tool.)

Hơn một triệu người dùng dựa vào FXStreet để có dữ liệu thị trường thời gian thực, công cụ biểu đồ, góc nhìn chuyên gia và tin tức Forex. Lịch kinh tế toàn diện và các hội thảo web giáo dục giúp nhà giao dịch luôn cập nhật và đưa ra quyết định có tính toán. FXStreet có khoảng 60 nhân sự, chia giữa trụ sở Barcelona và nhiều khu vực toàn cầu.
Đọc thêm


