
Bitcoin Price Forecast: BTC seesaws around $68,000 as Trump’s 48-hour ultimatum over Hormuz dents risk appetite
Bởi Manish Chhetri
Ngày xuất bản: 23 Mar 2026 | Ngày chỉnh sửa: 23 Mar 2026


BÀI VIẾT PHỔ BIẾN

Bitcoin (BTC) is trading at $68,500 at the time of writing on Monday, as market sentiment deteriorates amid escalating tensions between the US and Iran.
- Bitcoin price hovers around $68,500 on Monday as market sentiment deteriorates after Trump and Iran exchange threats over Hormuz.
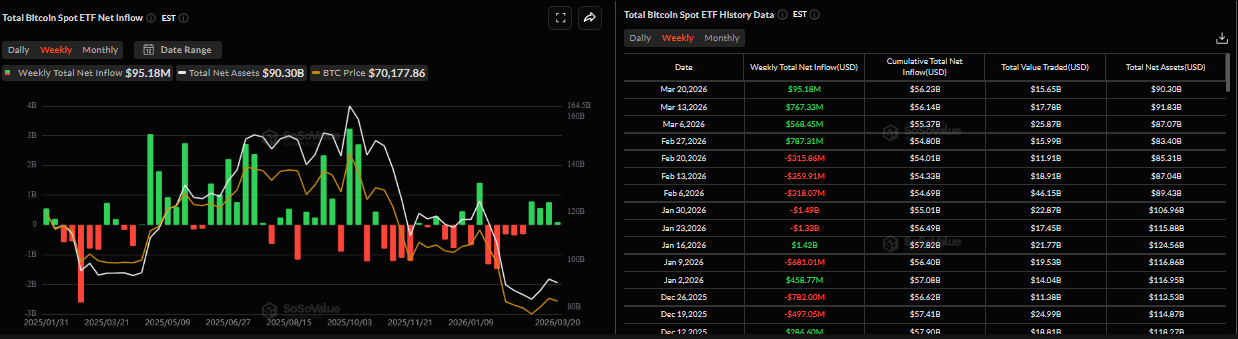
- US-listed spot ETFs recorded a mild inflow of $95.18 million last week, signaling a cautious stance among investors.
- The technical outlook shows bullish momentum is fading.
Bitcoin (BTC) is trading at $68,500 at the time of writing on Monday, as market sentiment deteriorates amid escalating tensions between the US and Iran. Meanwhile, US-listed spot BTC Exchange Traded Funds (ETFs) recorded mild inflows last week, reflecting a cautious stance among institutional investors. The technical outlook suggests that bullish momentum is fading, leaving the Crypto King vulnerable to further downside.
Middle East conflicts dampen risk appetite
Bitcoin’s price fell by nearly 4% over the weekend, closing the week with an over 6% loss. As of Monday, BTC is trading cautiously below $68,500, with the crypto market beginning the week on a cautious note amid escalating tensions between the US and Iran, which continue to weigh on investor sentiment.
On Saturday, US President Donald Trump issued a 48-hour deadline for Iran to reopen the Strait of Hormuz and threatened to target Iran’s energy infrastructure if the demand is not met.
Iran responded on Sunday that it would strike the energy and water systems of its Gulf neighbours in retaliation if Trump follows through with his threat.
Meanwhile, on Monday, President Trump said on his Truth Social account, “PEACE THROUGH STRENGTH, TO PUT IT MILDLY!!!”, further escalating the conflict.
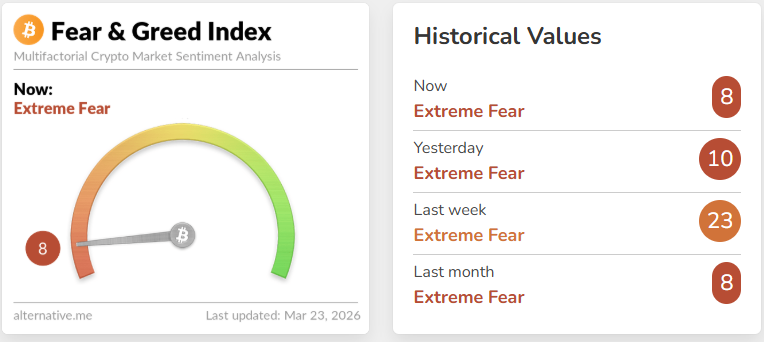
These latest developments have triggered uncertainty and a risk-off sentiment, with Asian stocks and US equity futures opening the week on a negative note. In addition, the fear and greed index, as shown below, has fallen back to the extreme fear zone, standing at 8 on Monday, highlighting a sharp deterioration in market sentiment and rising investor caution.
Institutional demand shows cautionary signs
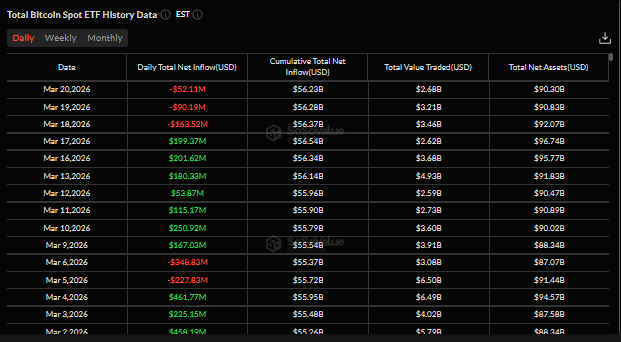
Institutional demand shows early signs of caution, despite a net inflow of $95.18 million in US-listed spot BTC ETFs last week. During the second half of the previous week, ETFs recorded three consecutive days of outflows through Friday, suggesting that institutional investors may be becoming more defensive amid rising uncertainty due to the Middle East war. Traders should keep an eye out for the possibility that, if this outflow continues and intensifies, BTC could see a price correction in the upcoming weeks.
Bitcoin Price Forecast: BTC momentum indicators show early bearish signs
Bitcoin price is trading below $68,500 as of Monday. The near-term bias turns mildly bearish as price holds below the channel’s upper boundary near $72,600 while respecting the lower band around $65,900, indicating sellers dominate on rallies within the downward structure. Daily closes remain well below the 50-day and 100-day Exponential Moving Averages (EMAs), which are clustered between $72,000 and $78,000, underscoring a corrective phase within a broader range.
Momentum conditions back this tone, with the Relative Strength Index (RSI) on the daily chart retreating toward the low-40s and the Moving Average Convergence Divergence (MACD) line slipping below the signal line into negative territory, as the expanding negative histogram signals strengthening selling interest.
Initial resistance aligns with Sunday’s swing high near $69,000, followed by the channel top just under $72,600, where the 50-day Exponential Moving Average overhead strengthens the supply zone; a daily close above this confluence would be needed to ease the current downside bias and open the way toward $73,500 and beyond.
On the downside, immediate support aligns with the channel floor and recent reaction low around $65,900, with a decisive close below this area opening the way toward the next psychological support band near $64,000. As long as BTC stays beneath $69,000 and the EMA cluster above, risk remains skewed toward further tests of the lower channel supports rather than a sustained upside reversal.
-1774254553962-1774254553963.png)
(The technical analysis of this story was written with the help of an AI tool.)
Bitcoin, altcoins, stablecoins FAQs
Bitcoin is the largest cryptocurrency by market capitalization, a virtual currency designed to serve as money. This form of payment cannot be controlled by any one person, group, or entity, which eliminates the need for third-party participation during financial transactions.
Altcoins are any cryptocurrency apart from Bitcoin, but some also regard Ethereum as a non-altcoin because it is from these two cryptocurrencies that forking happens. If this is true, then Litecoin is the first altcoin, forked from the Bitcoin protocol and, therefore, an “improved” version of it.
Stablecoins are cryptocurrencies designed to have a stable price, with their value backed by a reserve of the asset it represents. To achieve this, the value of any one stablecoin is pegged to a commodity or financial instrument, such as the US Dollar (USD), with its supply regulated by an algorithm or demand. The main goal of stablecoins is to provide an on/off-ramp for investors willing to trade and invest in cryptocurrencies. Stablecoins also allow investors to store value since cryptocurrencies, in general, are subject to volatility.
Bitcoin dominance is the ratio of Bitcoin's market capitalization to the total market capitalization of all cryptocurrencies combined. It provides a clear picture of Bitcoin’s interest among investors. A high BTC dominance typically happens before and during a bull run, in which investors resort to investing in relatively stable and high market capitalization cryptocurrency like Bitcoin. A drop in BTC dominance usually means that investors are moving their capital and/or profits to altcoins in a quest for higher returns, which usually triggers an explosion of altcoin rallies.

Hơn một triệu người dùng dựa vào FXStreet để có dữ liệu thị trường thời gian thực, công cụ biểu đồ, góc nhìn chuyên gia và tin tức Forex. Lịch kinh tế toàn diện và các hội thảo web giáo dục giúp nhà giao dịch luôn cập nhật và đưa ra quyết định có tính toán. FXStreet có khoảng 60 nhân sự, chia giữa trụ sở Barcelona và nhiều khu vực toàn cầu.
Đọc thêm


