
Bitcoin Price Forecast: BTC struggles near key level amid US-Iran ceasefire doubts
Bởi Manish Chhetri
Đã cập nhật: 9 Apr 2026


BÀI VIẾT PHỔ BIẾN

Bitcoin (BTC) nears a key technical support level at $70,500 on Thursday, with the outcome hinging on whether bulls can regain momentum or bears push for a deeper pullback. That will determine the Crypto King’s next directional move.
- Bitcoin price is retesting the 50-day EMA near $70,500 on Thursday, a level that could shape the next directional move.
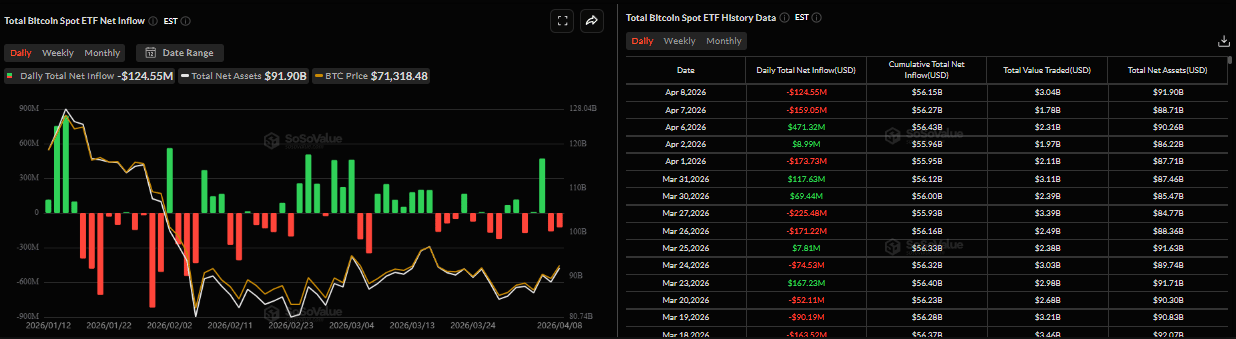
- US-listed spot ETF recorded an outflow of $124.55 million on Wednesday amid uncertainty over the US-Iran ceasefire deal.
- The technical outlook shows BTC is approaching a critical zone amid mildly bullish momentum.
Bitcoin (BTC) nears a key technical support level at $70,500 on Thursday, with the outcome hinging on whether bulls can regain momentum or bears push for a deeper pullback. That will determine the Crypto King’s next directional move. Meanwhile, market sentiment remains cautious amid uncertainty over the US-Iran ceasefire, with institutional demand hesitant to increase BTC exposure.
Truce uncertainty remains elevated
US President Donald Trump posted on his Truth Social account on Thursday, “all US ships, aircraft, and military personnel with additional ammunition, weaponry, and anything else that is appropriate and necessary for the lethal prosecution and destruction of an already substantially degraded enemy, will remain in place in, and around, Iran, until such time as the real agreement reached is fully complied with.”
Trump continued, “If for any reason it is not, which is highly unlikely, then the ‘Shootin’ Starts,’ bigger, and better, and stronger than anyone has ever seen before.”
These remarks come after the US and Iran brokered a two-week ceasefire and agreed to enter negotiations, potentially paving the way for lasting peace in the Middle East.
Meanwhile, Iranian ambassador Reza Amiri Moghadam confirmed, in a tweet on X on Thursday, that a team is scheduled to visit Pakistan at night for the first round of talks on the 10-point plan with the US on Saturday. Moghadam added that Iran is sending delegates despite Israel violating the ceasefire terms by attacking Lebanon.
Ongoing uncertainty surrounding the US-Iran ceasefire continues to keep market sentiment cautious, with Bitcoin facing rejection near $72,800 on Wednesday and struggling to hold above the $71,000 level as of Thursday.
Iran to use Bitcoin for toll payment
According to the Financial Times (FT), Iran will demand that shipping companies pay tolls in cryptocurrency for oil tankers passing through the Strait of Hormuz, as it seeks to retain control over passage through the key waterway during the two-week ceasefire.
The proposal would require tanker operators to submit cargo details in advance via email for approval by Iranian authorities, Hamid Hosseini, a spokesperson for Iran’s Oil, Gas and Petrochemical Products Exporters’ Union, told FT.
Approved vessels would then pay a transit fee of approximately $1 per barrel, with payments accepted in Bitcoin and other crypto, or in Chinese yuan. Empty vessels would be exempt from the charge.
As explained in the previous report, Iran relies on cryptocurrencies due to US sanctions, and Bitcoin has served as a tool for paying for imports and settling trade. Iran legalized crypto mining in 2019 and has played a role in its economy. The latest proposal by Iran to accept Bitcoin and other cryptocurrencies for transit fees in the Strait of Hormuz indicates crypto’s evolving role in global trade. If implemented, this could mark a key milestone in adoption, particularly for regions facing financial constraints. This development could boost Bitcoin demand in the near term, as 20% of global oil tankers pass through the Hormuz Strait.
Institutional investors are not willing to increase BTC exposure
Institutional demand remains mixed with a slight bearish tilt so far this week. SoSoValue data shows that spot Bitcoin Exchange Traded Funds (ETFs) recorded an outflow of $124.55 million on Wednesday after the US-Iran ceasefire announcement, highlighting institutional investors not willing to increase exposure amid the growing uncertainty. If these outflows continue and intensify, they could cap Bitcoin’s recovery.
The Glassdoor weekly report on Wednesday highlighted that across spot, futures, and options markets, the dominant theme is one of stabilization without strong conviction.
“The market appears to be transitioning into a cleaner and more balanced structure after the recent washout, but not yet into a fully constructive trend. For that shift to occur, stronger spot demand, broader participation, and a more decisive re-engagement across derivatives markets will likely be required,” reported Glassdoor analyst.
Morgan Stanley Bitcoin Trust goes live
Morgan Stanley’s Bitcoin Trust (MSBT) began trading on the New York Stock Exchange (NYSE) on Wednesday, marking the first spot Bitcoin ETF launched by a major US bank.
Eric Balchunas, Senior ETF Analyst at Bloomberg, described the debut as a “BIG BOY LAUNCH” in a post on X, highlighting its significance for the crypto market.
He added that the Morgan Stanley Bitcoin ETF “arguably represents the biggest BTC launch since spot products began trading,” projecting around $5 billion in assets under management within the first year and roughly $30 million in day-one trading volume.
Bitcoin Price Forecast: BTC awaits the next directional bias
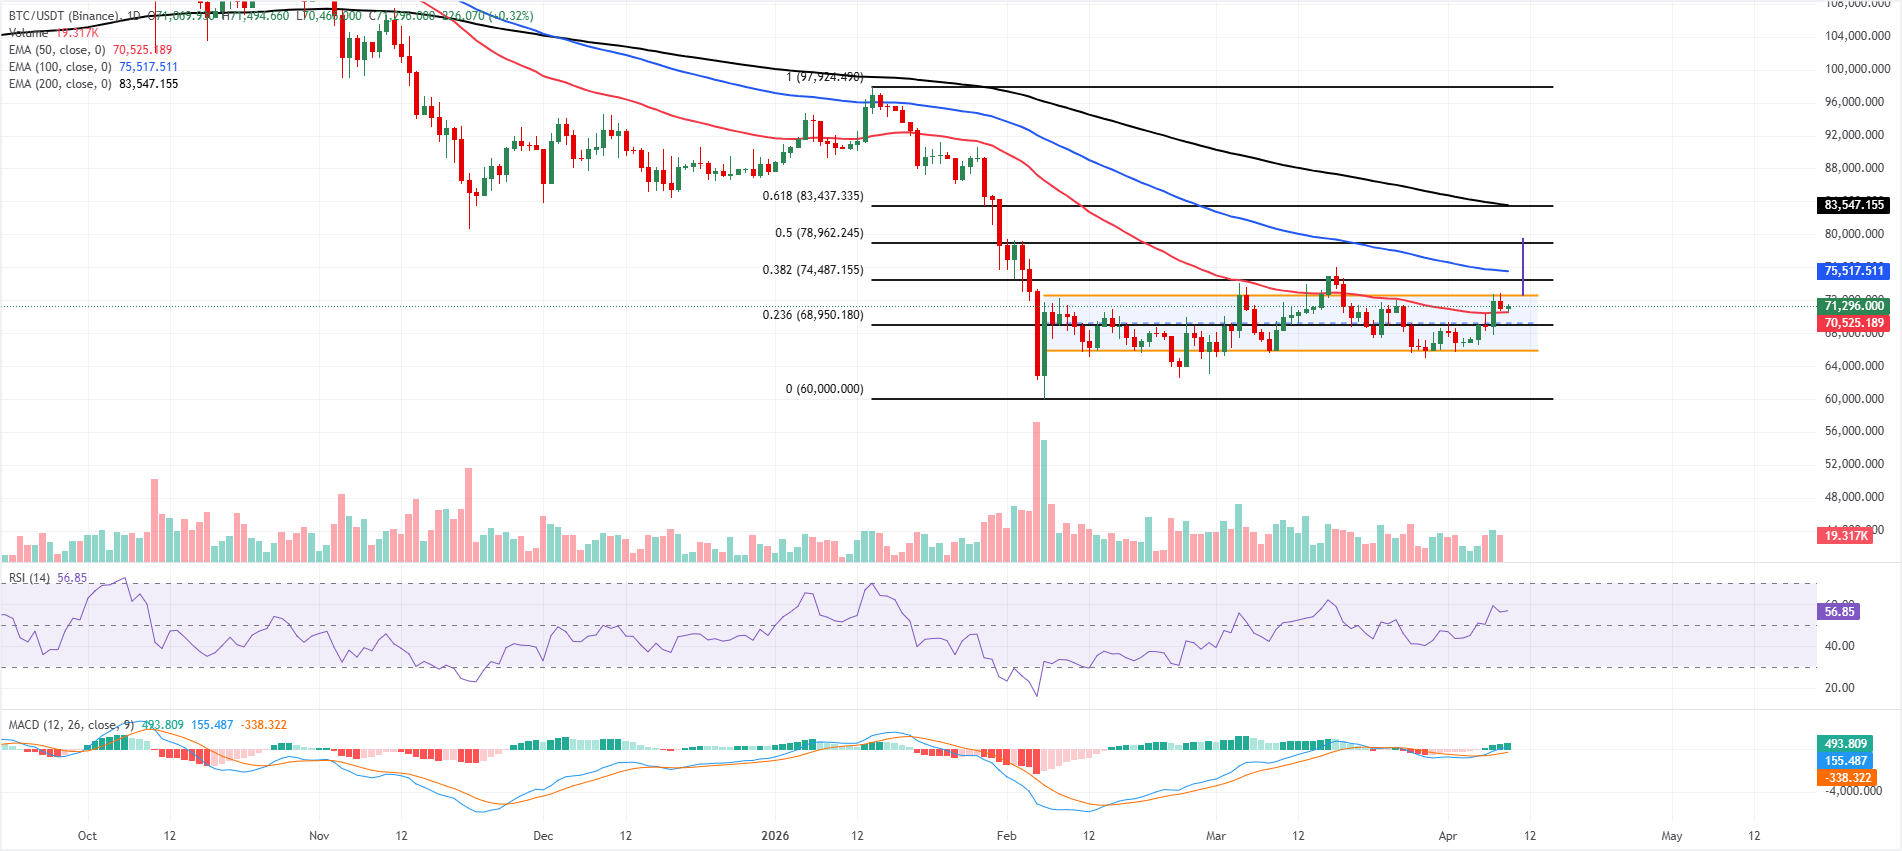
Bitcoin is trading at $71,200 on Thursday after being rejected at the channel top around $72,600 the previous day. BTC holds a capped bias as it remains below the 100-day and 200-day Exponential Moving Averages (EMAs) while respecting the 50-day EMA as nearby support.
BTC consolidates inside a parallel channel, currently correcting from the top, suggesting the latest bounce is corrective within a broader consolidation. At the same time, a Relative Strength Index (RSI) on the daily chart in the mid-50s and a positive, rising Moving Average Convergence Divergence (MACD) histogram hint that bullish momentum is improving but not yet strong enough to decisively reverse the higher-timeframe downtrending structure.
On the topside, immediate resistance is seen at the upper boundary of the channel near $72,600, where a breakout and a daily close above this level could boost BTC to the channel breakout target at $79,500. However, the 38.2% Fibonacci retracement of the $97,924-$60,000 decline, at $74,487, could act as interim resistance. Higher up, the 100-day EMA at $75,517 and the 50% retracement at $78,962 precede a more substantial barrier.
On the downside, initial support aligns with the 50-day EMA around $70,525, ahead of the 23.6% Fibonacci level at $68,950. A break below there would expose the lower channel boundary near $65,872, with the broader structural floor stemming from the $60,000 swing low further down.
(The technical analysis of this story was written with the help of an AI tool.)
Bitcoin, altcoins, stablecoins FAQs
Bitcoin is the largest cryptocurrency by market capitalization, a virtual currency designed to serve as money. This form of payment cannot be controlled by any one person, group, or entity, which eliminates the need for third-party participation during financial transactions.
Altcoins are any cryptocurrency apart from Bitcoin, but some also regard Ethereum as a non-altcoin because it is from these two cryptocurrencies that forking happens. If this is true, then Litecoin is the first altcoin, forked from the Bitcoin protocol and, therefore, an “improved” version of it.
Stablecoins are cryptocurrencies designed to have a stable price, with their value backed by a reserve of the asset it represents. To achieve this, the value of any one stablecoin is pegged to a commodity or financial instrument, such as the US Dollar (USD), with its supply regulated by an algorithm or demand. The main goal of stablecoins is to provide an on/off-ramp for investors willing to trade and invest in cryptocurrencies. Stablecoins also allow investors to store value since cryptocurrencies, in general, are subject to volatility.
Bitcoin dominance is the ratio of Bitcoin's market capitalization to the total market capitalization of all cryptocurrencies combined. It provides a clear picture of Bitcoin’s interest among investors. A high BTC dominance typically happens before and during a bull run, in which investors resort to investing in relatively stable and high market capitalization cryptocurrency like Bitcoin. A drop in BTC dominance usually means that investors are moving their capital and/or profits to altcoins in a quest for higher returns, which usually triggers an explosion of altcoin rallies.

Hơn một triệu người dùng dựa vào FXStreet để có dữ liệu thị trường thời gian thực, công cụ biểu đồ, góc nhìn chuyên gia và tin tức Forex. Lịch kinh tế toàn diện và các hội thảo web giáo dục giúp nhà giao dịch luôn cập nhật và đưa ra quyết định có tính toán. FXStreet có khoảng 60 nhân sự, chia giữa trụ sở Barcelona và nhiều khu vực toàn cầu.
Đọc thêm


