
BNB Price Forecast: Ongoing correction threatens deeper losses below key support
Bởi Manish Chhetri
Đã cập nhật: 10 Jun 2026


BÀI VIẾT PHỔ BIẾN

BNB (BNB), formerly known as Binance Coin, continues to extend its losses, trading below $585 at the time of writing on Wednesday, having corrected over 3% so far this week.
- BNB continues its correction on Wednesday, extending losses over 3% so far this week.
- On-chain and derivatives metrics support bearish bias, with falling social dominance, negative funding rates and rising short bets.
- The technical outlook suggests deeper losses if BNB closes below the lower boundary of the consolidation at $570.
BNB (BNB), formerly known as Binance Coin, continues to extend its losses, trading below $585 at the time of writing on Wednesday, having corrected over 3% so far this week. On-chain and derivatives indicators support a bearish outlook, as declining social dominance, negative funding rates and rising short positions signal growing downside bias. Meanwhile, price action shows BNB is approaching a critical support zone at $570, and a decisive close below this lower consolidation boundary could pave the way for deeper losses.
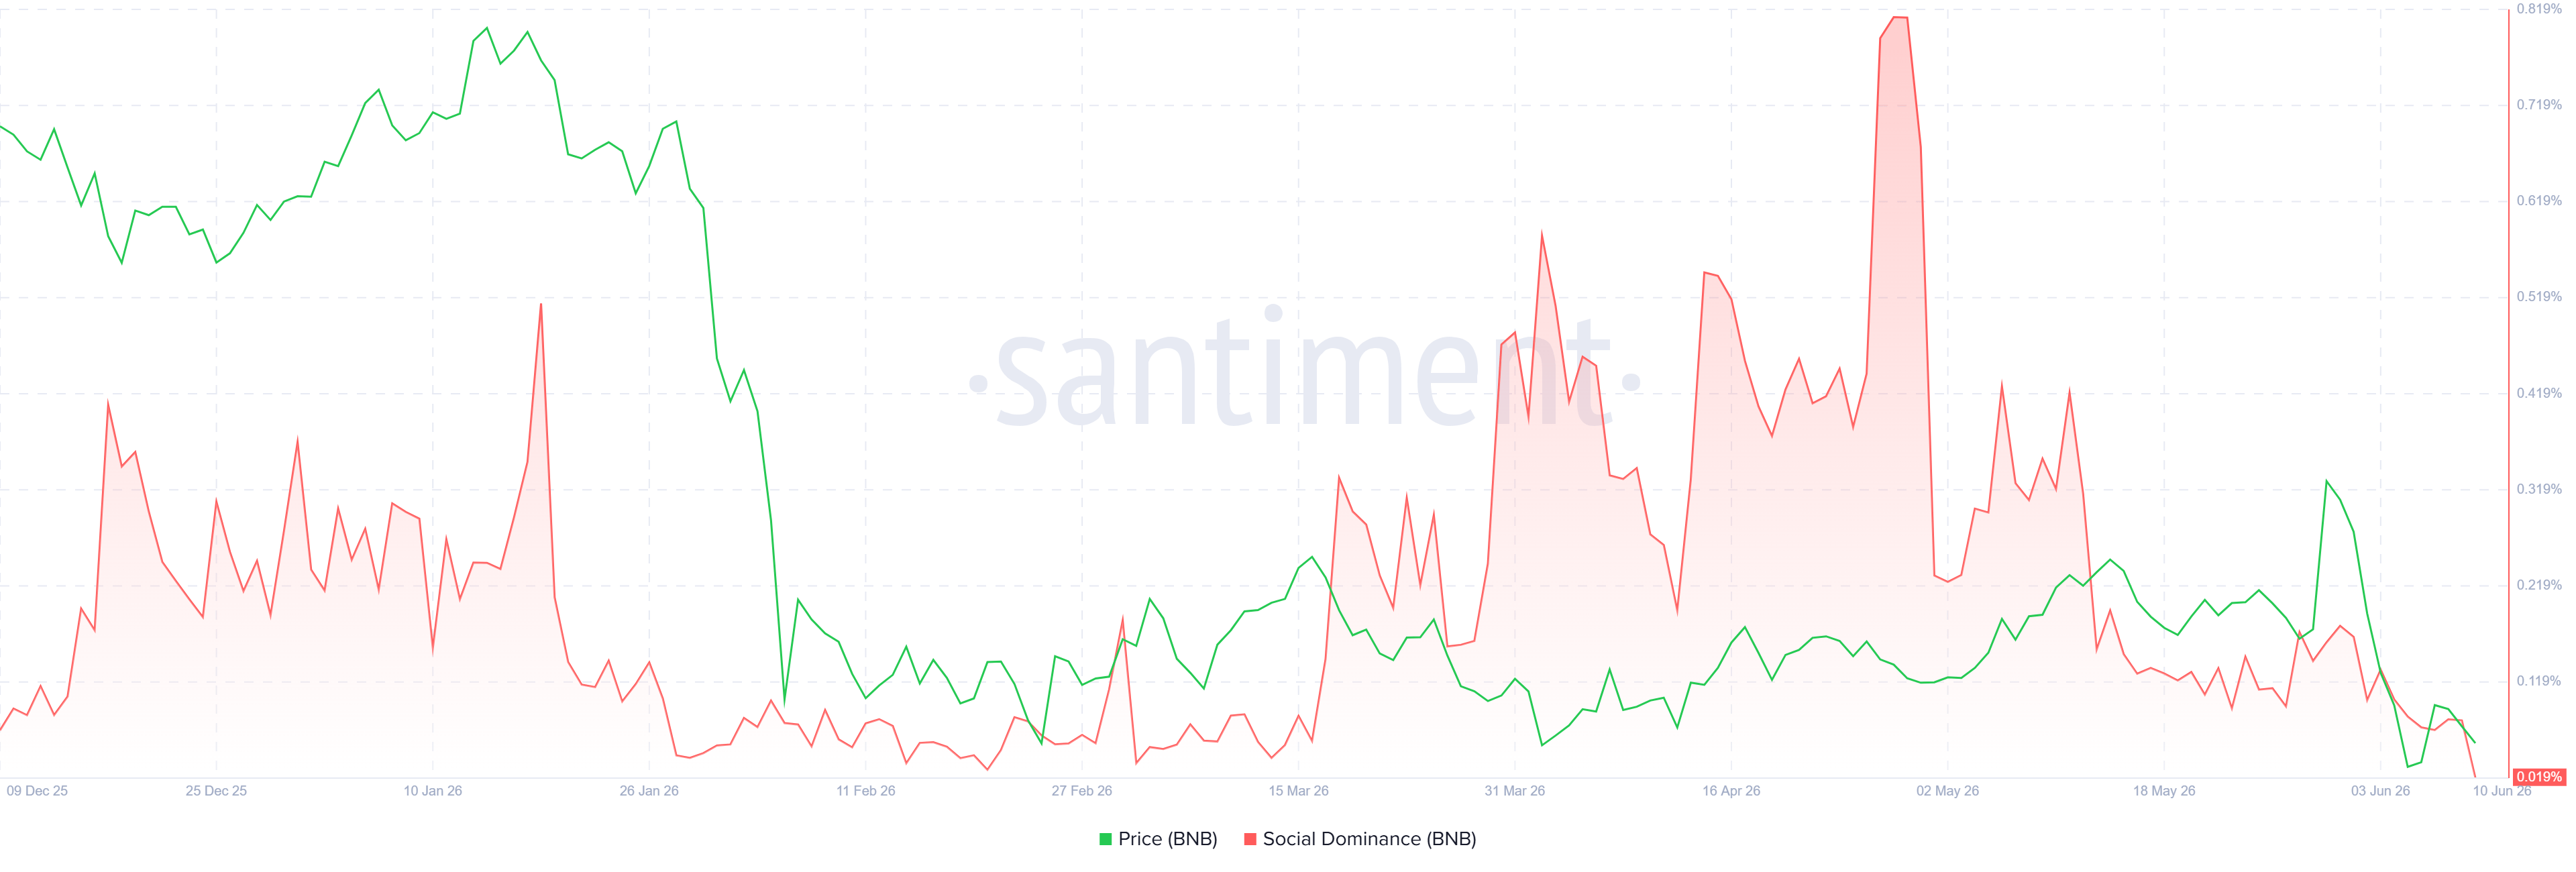
On-chain data show fading interest among BNB investors
Santiment’s Social Dominance metric for BNB hints at a bearish bias. The index measures the share of BNB-related discussions across the cryptocurrency media. The metric falls sharply, reading 0.019% on Wednesday, reaching levels not seen since December 2020. This decline indicates fading market interest and sentiment among BNB investors.
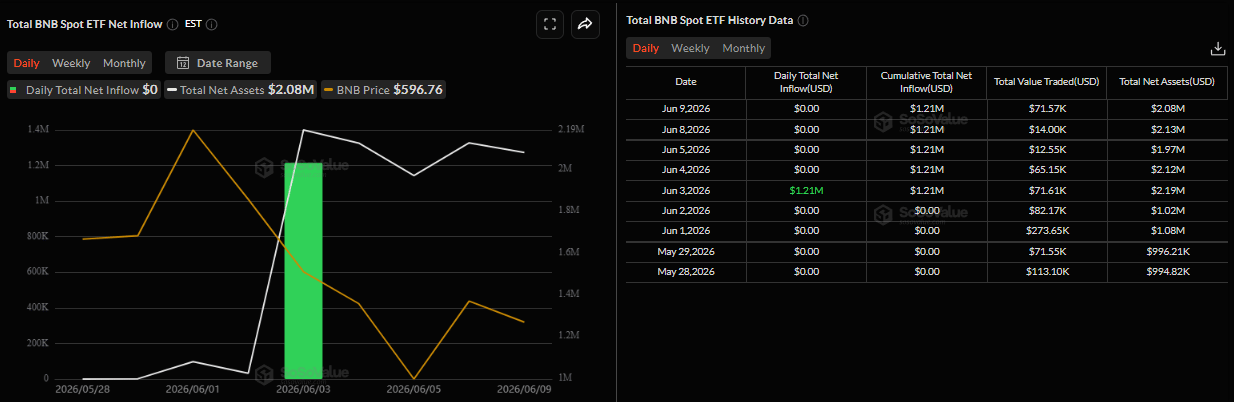
SoSoValue data show that BNB’s spot Exchange-Traded Funds (ETFs) have remained largely silent since their launch on May 28, indicating a lack of meaningful institutional demand for the token.
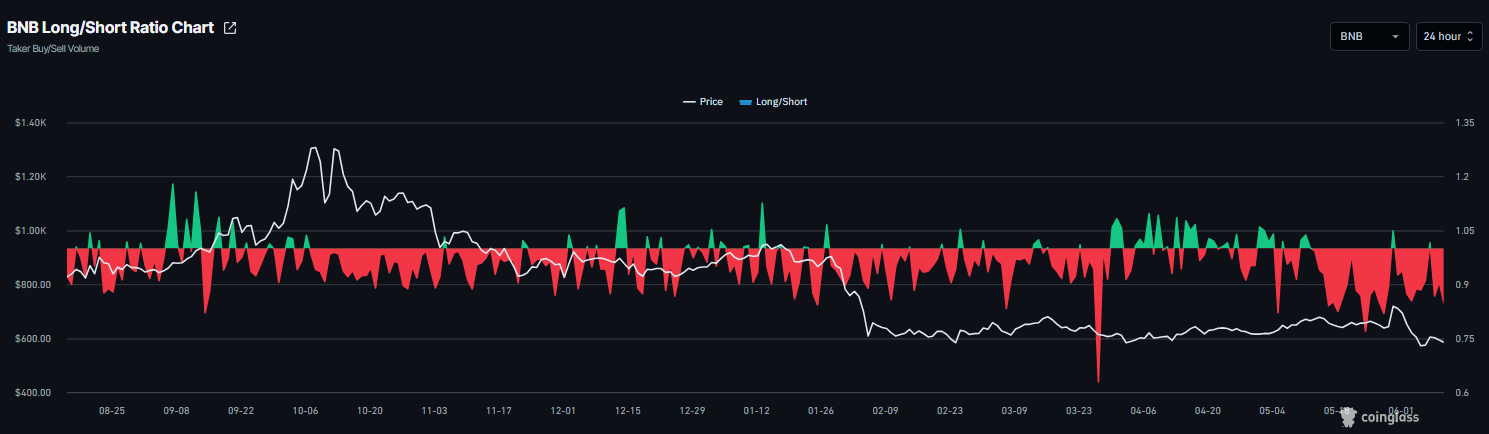
Derivatives metrics support a bearish outlook
BNB’s derivatives data also supports a negative outlook. CoinGlass’ long-to-short ratio for BNB reads 0.84 on Wednesday, nearing the lowest level over a month. The ratio being below one indicates bearish sentiment, as traders are betting that BNB's price will fall.
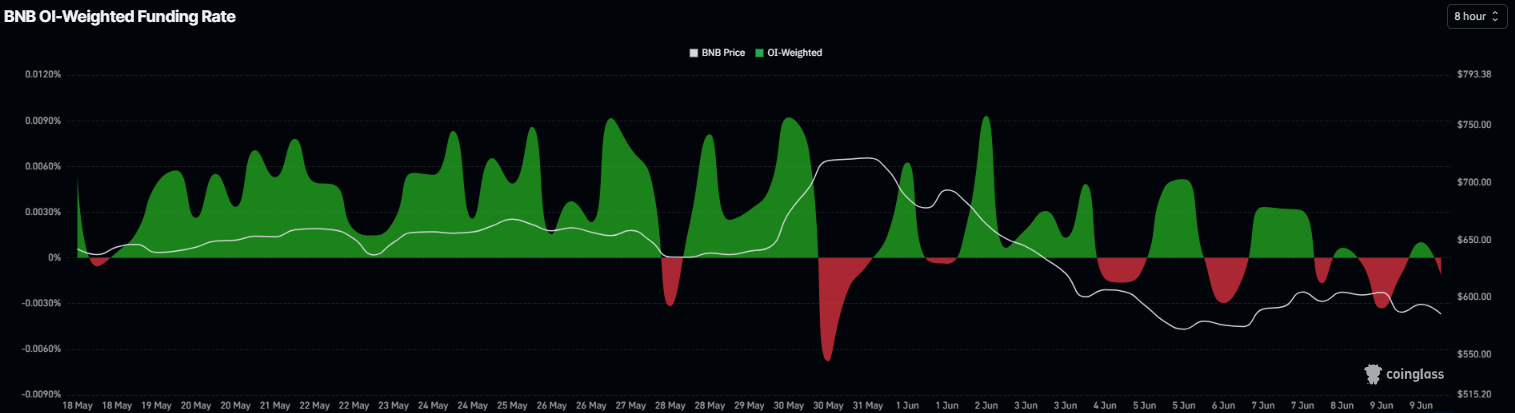
In addition, CoinGlass funding rates data support negative sentiment for BNB. The metric flipped to a negative rate on Wednesday, indicating shorts are paying longs and suggesting bearish sentiment toward BNB.
BNB Price Forecast: BNB could extend further losses if it closes below $570
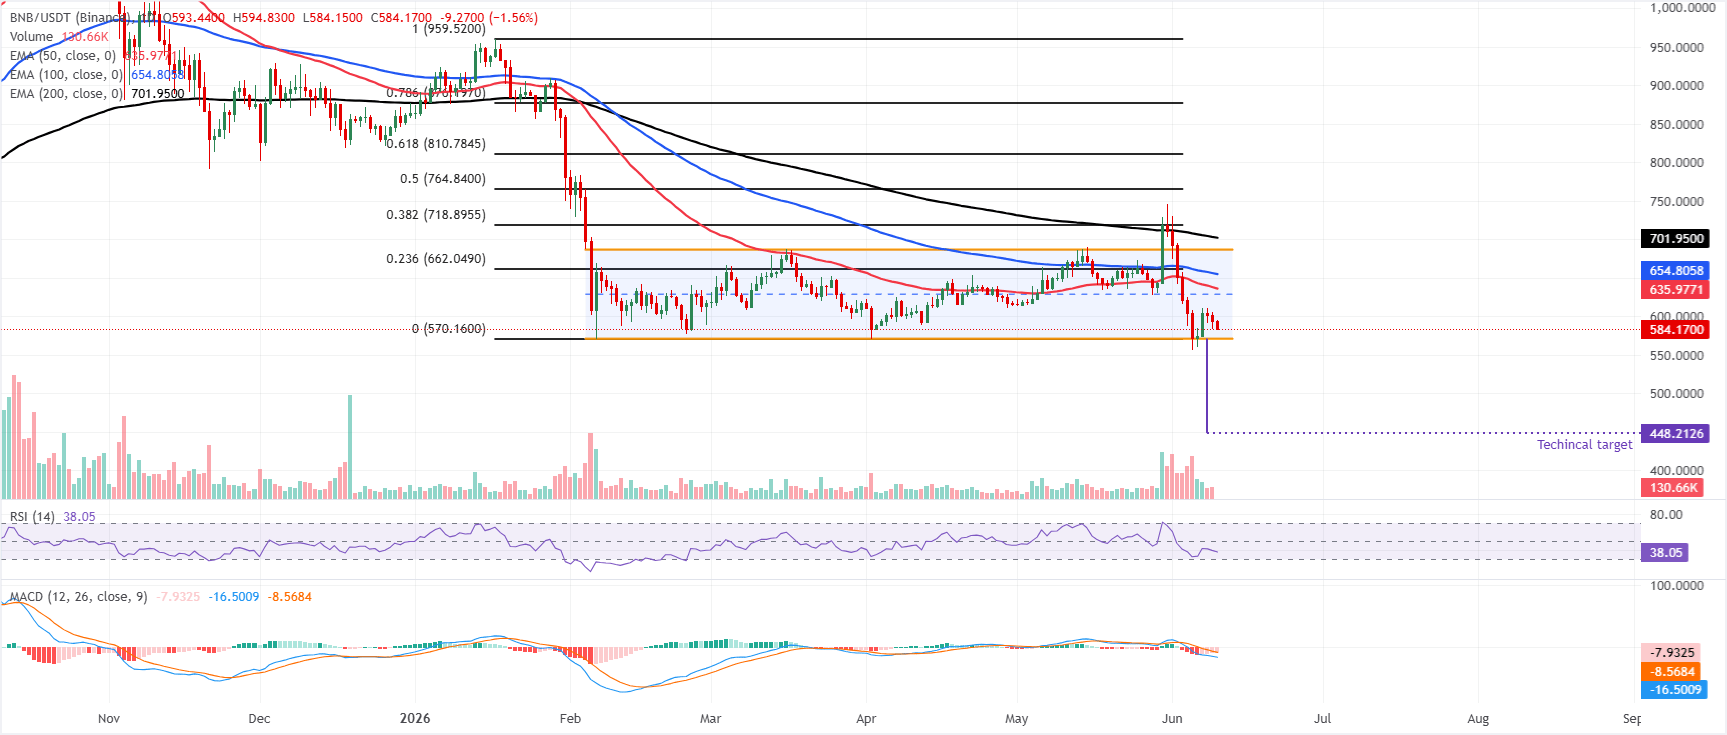
BNB price trades at $584.54 on Wednesday, extending a bearish phase below all three exponential moving averages (EMAs), with the 50-day EMA near $635.97, the 100-day EMA around $654.80 and the 200-day EMA close to $701.95 acting as a layered cap.
BNB is sliding within parallel channel, hovering just above the lower boundary near $570, while the Relative Strength Index (RSI) is around 38 and a negative Moving Average Convergence Divergence (MACD) reading reinforces weakening momentum rather than any immediate recovery signal.
On the downside, initial support aligns with the channel bottom at roughly $570, where a daily close below would suggest a correction toward the technical target at $488.21 (based on the distance between the channel extrapolated from the breakdown point).
On the topside, any bounce faces immediate resistance from the 50-day EMA at $635.97, followed by the 100-day EMA at $654.80 and the 23.6% Fibonacci retracement at $662.05; a stronger recovery would need to challenge the channel top near $687.30 and the 200-day EMA at $701.95 before the higher retracement barriers at $718.90, $764.84, $810.78, $876.20 and $959.52 come back into play.
(The technical analysis of this story was written with the help of an AI tool.)

Hơn một triệu người dùng dựa vào FXStreet để có dữ liệu thị trường thời gian thực, công cụ biểu đồ, góc nhìn chuyên gia và tin tức Forex. Lịch kinh tế toàn diện và các hội thảo web giáo dục giúp nhà giao dịch luôn cập nhật và đưa ra quyết định có tính toán. FXStreet có khoảng 60 nhân sự, chia giữa trụ sở Barcelona và nhiều khu vực toàn cầu.
Đọc thêm


