
Cardano Price Forecast: ADA eyes short-term rebound as derivatives sentiment improves
Bởi Manish Chhetri
Ngày xuất bản: 12 Feb 2026 | Ngày chỉnh sửa: 12 Feb 2026


BÀI VIẾT PHỔ BIẾN

Cardano (ADA) is trading at $0.257 at the time of writing on Thursday, after slipping more than 4% so far this week. Derivatives sentiment improves as ADA’s funding rates turn positive alongside rising long bets among traders.
- Cardano price hovers at $0.257 on Thursday after correcting over 4% so far this week.
- Derivatives data shows improving signals with ADA’s funding rate flipping positive and long bets rising among traders.
- The technical outlook suggests a short-term recovery, as momentum indicators show fading bearish strength.
Cardano (ADA) is trading at $0.257 at the time of writing on Thursday, after slipping more than 4% so far this week. Derivatives sentiment improves as ADA’s funding rates turn positive alongside rising long bets among traders. On the technical side, it points to a short-term recovery as momentum indicators show fading bearish strength.
Derivatives data shows signs of recovery
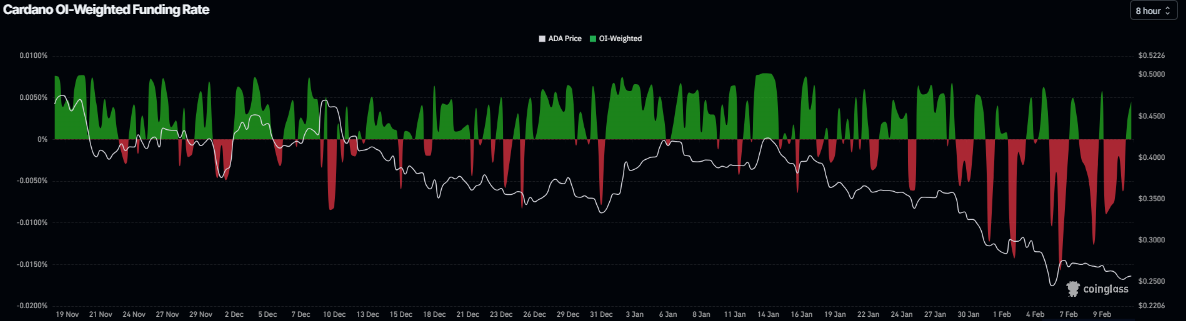
Cardano’s funding rates support a recovery thesis. CoinGlass’s OI-Weighted Funding Rate data shows that the number of traders betting that the price of ADA will slide further is lower than those anticipating a price increase.
The metric flipped to a positive rate on Wednesday and currently stands at 0.0045% on Thursday, indicating that longs are paying shorts. Historically, as shown in the chart below, when funding rates have flipped from negative to positive, Cardano’s price has recovered sharply.
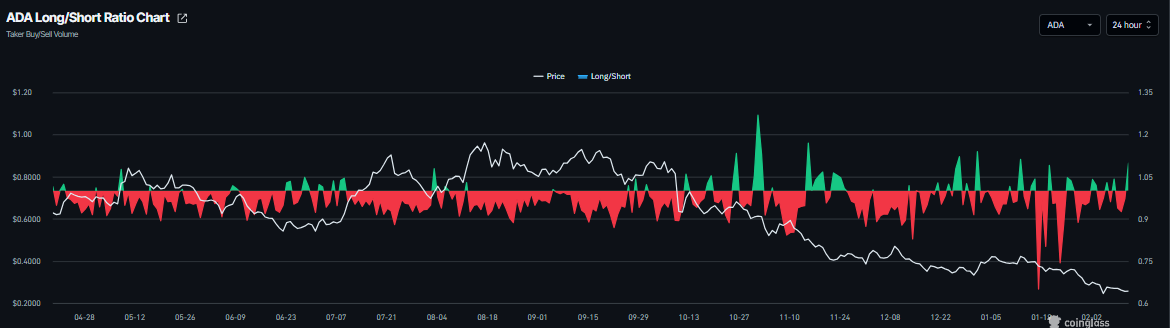
In addition, CoinGlass’ long-to-short ratio for ADA reads 1.09 on Thursday. The ratio above one suggests that more traders are betting on Cardano’s price to rally.
Cardano Price Forecast: Hints at a short-term recovery
On the daily chart, Cardano trades at $0.258 at the time of writing on Thursday. The 9-day Simple Moving Average (SMA) extends its decline and sits above the price at $0.266, reinforcing a bearish near-term bias as spot holds below this dynamic gauge.
The Moving Average Convergence Divergence (MACD) histogram remains negative and contracts below the zero line, indicating the MACD line stays under the signal line while downside momentum fades. The Relative Strength Index stands at 32.7 (neutral), edging higher from oversold and hinting at stabilizing momentum.
The descending trend line from $0.427 limits rebounds. Immediate resistance aligns at $0.301, followed by $0.325. A daily close above $0.301 would open the door to a corrective extension toward $0.325, while a failure to clear the 9-day SMA at $0.266 would keep sellers in control of the trend.
(The technical analysis of this story was written with the help of an AI tool.)

Hơn một triệu người dùng dựa vào FXStreet để có dữ liệu thị trường thời gian thực, công cụ biểu đồ, góc nhìn chuyên gia và tin tức Forex. Lịch kinh tế toàn diện và các hội thảo web giáo dục giúp nhà giao dịch luôn cập nhật và đưa ra quyết định có tính toán. FXStreet có khoảng 60 nhân sự, chia giữa trụ sở Barcelona và nhiều khu vực toàn cầu.
Đọc thêm


