
Cardano Price Forecast: ADA stalls as mixed signals limit recovery
Bởi Manish Chhetri
Ngày xuất bản: 18 Feb 2026 | Ngày chỉnh sửa: 18 Feb 2026


BÀI VIẾT PHỔ BIẾN

Cardano (ADA) steadies at $0.28 on Wednesday after failing to break through a key resistance zone over the weekend. Mixed signals from the derivatives and on-chain metrics suggest that ADA’s short-term outlook remains uncertain, limiting the scope for a recovery.
- Cardano price steadies at $0.28 after failing to break through the key resistance level.
- Derivatives data suggest limited recovery, with ADA’s open interest at very low levels alongside negative funding rates.
- Santiment data indicate mixed sentiment, with some holders accumulating, while social dominance continues to decline.
Cardano (ADA) steadies at $0.28 on Wednesday after failing to break through a key resistance zone over the weekend. Mixed signals from the derivatives and on-chain metrics suggest that ADA’s short-term outlook remains uncertain, limiting the scope for a recovery.
Cardano’s derivatives data show bearish bias
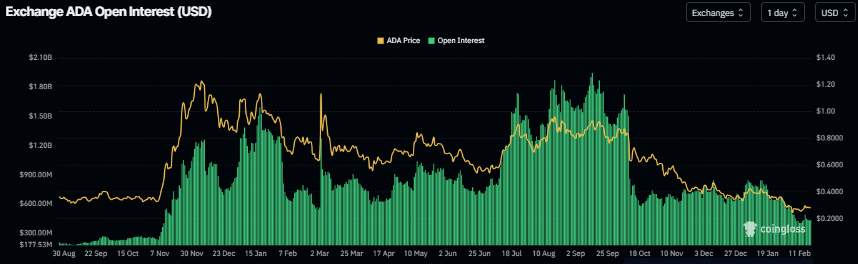
Cardano futures Open Interest (OI) falls to $436 million on Wednesday, having been steadily declining since mid-January and nearing the February 12 level of $407 million. This drop in OI reflects waning investor participation and projects a bearish outlook.
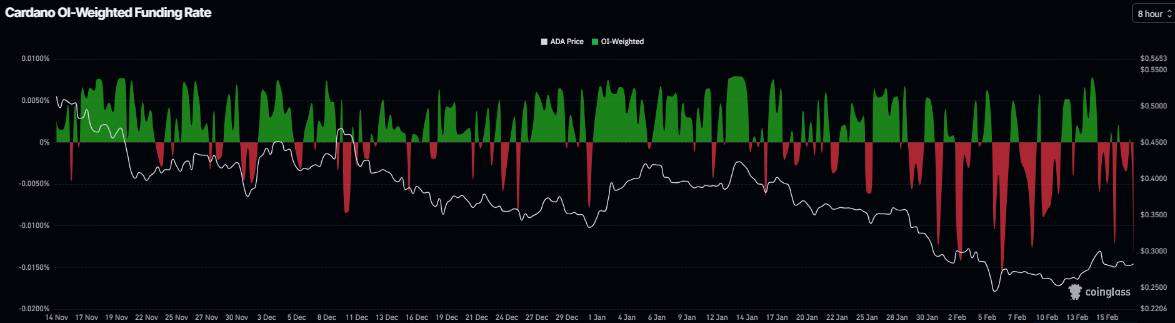
In addition, Coinglass’s OI-Weighted Funding Rate data shows that the number of traders betting that the price of Cardano will slide further is higher than those anticipating a price increase. The metric turned negative on Wednesday and stands at -0.0130%, nearing the February 6 levels, when ADA dropped sharply. The negative ratio suggests that shorts are paying longs, suggesting bearish sentiment toward ADA.
Mixed on-chain data signals indecision
Santiment’s Supply Distribution data supports a positive outlook for Cardano, as certain whales are buying ADA at recent price dips.
The metric indicates that whales holding between 1 million and 10 million ADA tokens (yellow line) and 10 million and 100 million tokens (blue line) have accumulated a total of 240 million ADA tokens since February 11.
 [09-1771393018898-1771393018900.26.58, 18 Feb, 2026].png)
Santiment’s Social Dominance metric for Cardano supports a bearish outlook. The index measures the share of ADA-related discussions across the cryptocurrency media. It has been in a downward trend since the end of December, falling again in early February to 0.038% on Wednesday. This fall indicates fading market interest and weakening sentiment among ADA investors. This combination of accumulation alongside weakening sentiment suggests indecision among investors and limits the chances of a sustained recovery.
 [09-1771393088046-1771393088046.28.23, 18 Feb, 2026].png)
Cardano Price Forecast: ADA faces rejection around the key resistance level
Cardano price was rejected at the 38.2% Fibonacci retracement level at $0.29 (drawn from the January 14 high of $0.42 to the February 6 low at $0.22) on Sunday, and it declined 4.47% that day. ADA has been hovering around the $0.28 level for the past two days and, as of Wednesday, remains there.
If ADA faces a correction, it could extend the losses to retest its weekly resistance at $0.24.
The Relative Strength Index (RSI) reads 44, below the neutral level of 50, indicating bearish momentum gaining traction. However, the Moving Average Convergence Divergence (MACD) showed a bullish crossover on February 13, which remains in place, suggesting that upside bias has not been invalidated yet.
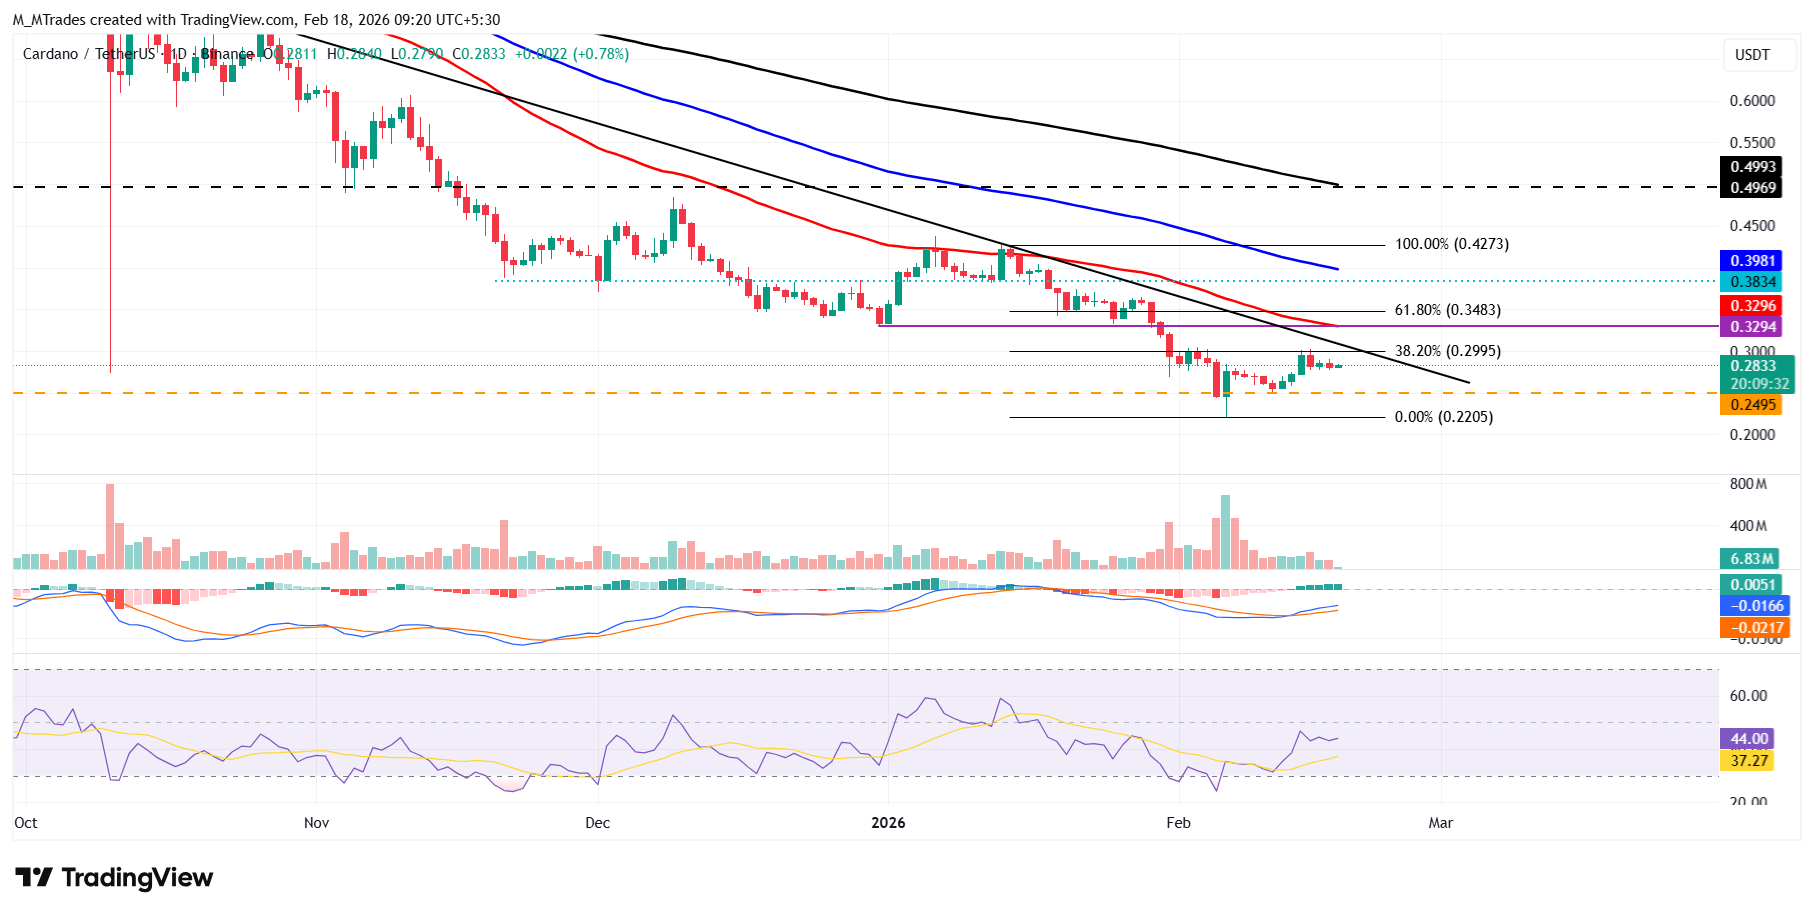
However, if ADA closes above the 38.2% Fibonacci retracement level at $0.29 on a daily basis, it could extend the recovery toward the 50-day Exponential Moving Average (EMA) at $0.32.

Hơn một triệu người dùng dựa vào FXStreet để có dữ liệu thị trường thời gian thực, công cụ biểu đồ, góc nhìn chuyên gia và tin tức Forex. Lịch kinh tế toàn diện và các hội thảo web giáo dục giúp nhà giao dịch luôn cập nhật và đưa ra quyết định có tính toán. FXStreet có khoảng 60 nhân sự, chia giữa trụ sở Barcelona và nhiều khu vực toàn cầu.
Đọc thêm


