
Cardano Price Forecast: Consolidation near support as bearish momentum eases
Bởi Manish Chhetri
Đã cập nhật: 1 Jul 2026


BÀI VIẾT PHỔ BIẾN

Cardano (ADA) trades around $0.146 on Wednesday, stabilizing after a sharp correction as selling pressure eases. Weakening derivatives metrics indicate traders remain cautious, while fading bearish momentum indicators suggest a potential recovery for ADA.
- Cardano price consolidates around $0.146 on Wednesday after a recent sell-off.
- Weakening derivatives activity, with declining open interest and rising short positions, continues to support a cautious near-term outlook.
- The technical outlook shows bearish momentum is fading, raising the possibility of a potential recovery.
Cardano (ADA) trades around $0.146 on Wednesday, stabilizing after a sharp correction as selling pressure eases. Weakening derivatives metrics indicate traders remain cautious, while fading bearish momentum indicators suggest a potential recovery for ADA.
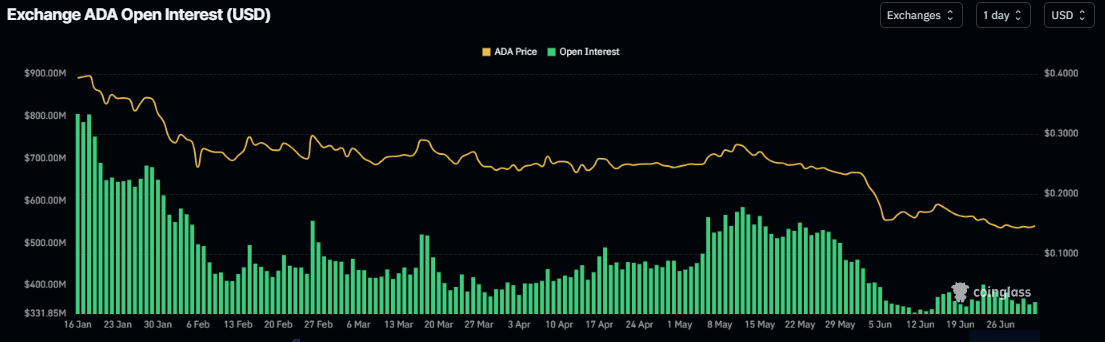
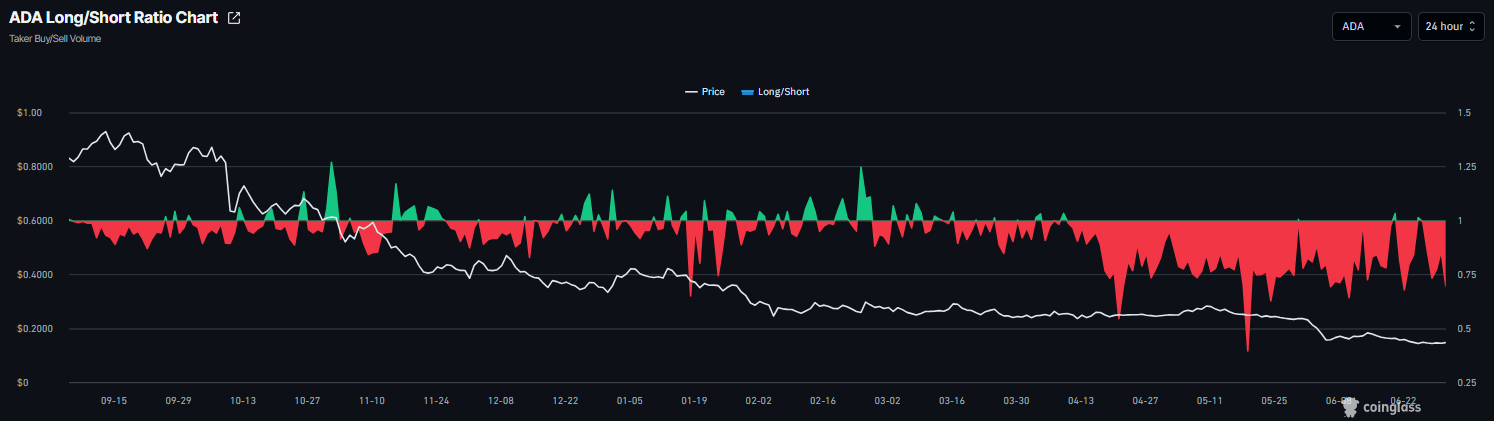
Derivatives traders remain cautious
Cardano’s derivatives metrics support a negative outlook. ADA’s futures Open Interest (OI) dropped to $360 million on Wednesday after a mild rise in mid-May but has been continuously falling since mid-January. This drop in OI reflects waning investor participation and projects a bearish outlook.
In addition, CoinGlass’ long-to-short ratio for ADA reads 0.69 on Wednesday, nearing its lowest level in over a month. This ratio, being below one, reflects bearish sentiment in the market, as more traders are betting on the asset’s price to fall.
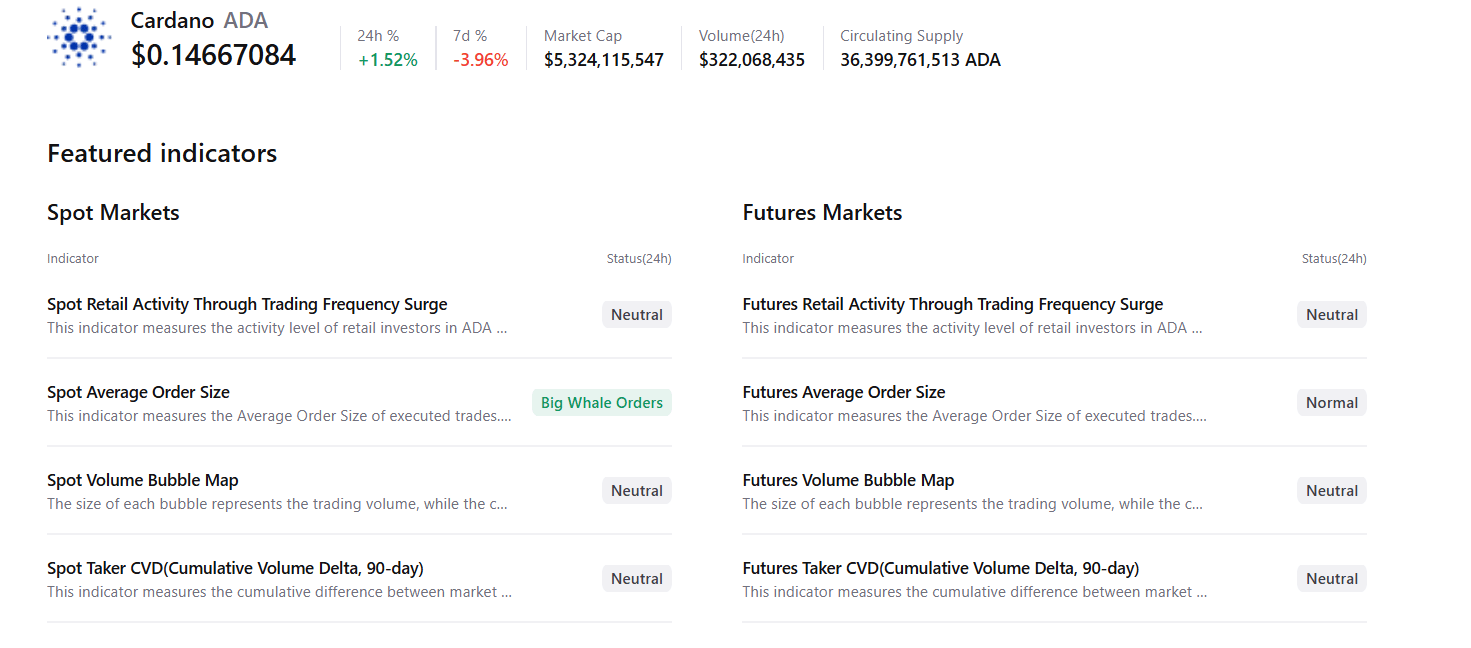
Some signs of optimism
CryptoQuant’s summary data shows mild bullish sentiment. Cardano’s spot markets show large whale orders amid neutral conditions across other metrics, supporting a potential recovery.
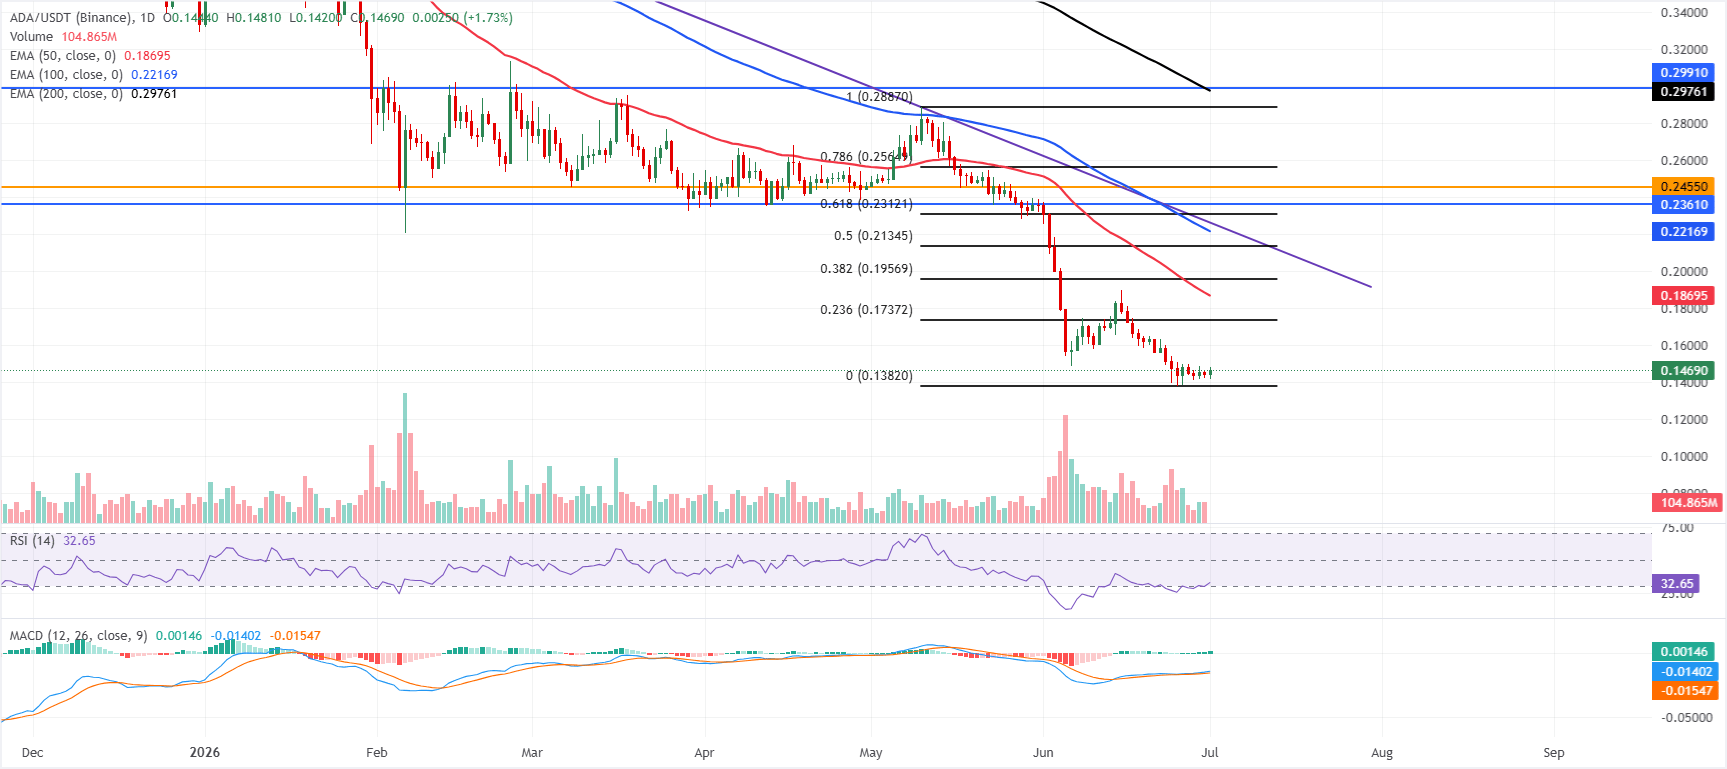
Cardano Price Forecast: Fading bearish momentum
Cardano price trades at $0.146 on Wednesday, consolidating after a recent correction. However, ADA maintains a long-term bearish bias, with price holding well below the 50-day, 100-day, and 200-day Exponential Moving Averages (EMAs) at roughly $0.187, $0.221, and $0.297.
The Relative Strength Index (RSI) has stabilized near 33, and the Moving Average Convergence Divergence (MACD) line remains slightly positive, hinting at tentative downside fatigue but not yet altering the overarching downward structure.
On the topside, initial resistance is seen at the 23.6% Fibonacci retracement near $0.173, ahead of the 50-day EMA around $0.187 and the 38.2% Fibonacci retracement close to $0.1957. Further up, the 50% retracement level at $0.213, the 100-day EMA at $0.221 and the downtrend resistance trendline’s break area near $0.226 form a broader supply band, followed by clustered barriers between the 61.8% Fibonacci retracement at $0.231, horizontal caps at $0.236 and $0.245, and the upper band defined by $0.256–$0.299 including the 78.6% Fibonacci retracement, the 200-day EMA around $0.2976 and overhead horizontal resistance.
On the downside, immediate support sits at the Fibonacci anchor at $0.1382; a clear break below this floor would expose fresh lows in the broader downtrend.
(The technical analysis of this story was written with the help of an AI tool.)

Hơn một triệu người dùng dựa vào FXStreet để có dữ liệu thị trường thời gian thực, công cụ biểu đồ, góc nhìn chuyên gia và tin tức Forex. Lịch kinh tế toàn diện và các hội thảo web giáo dục giúp nhà giao dịch luôn cập nhật và đưa ra quyết định có tính toán. FXStreet có khoảng 60 nhân sự, chia giữa trụ sở Barcelona và nhiều khu vực toàn cầu.
Đọc thêm


