
Chainlink Price Forecast: LINK tests key support as retail interest cools
Bởi John Isige
Ngày xuất bản: 29 Jan 2026 | Ngày chỉnh sửa: 29 Jan 2026


BÀI VIẾT PHỔ BIẾN

Chainlink (LINK) is trading at $11.16 at the time of writing on Thursday, extending its downtrend for the second consecutive day amid broader crypto market weakness.
- Chainlink continues its decline, testing the $11.00 support level as bearish sentiment weighs on the crypto market.
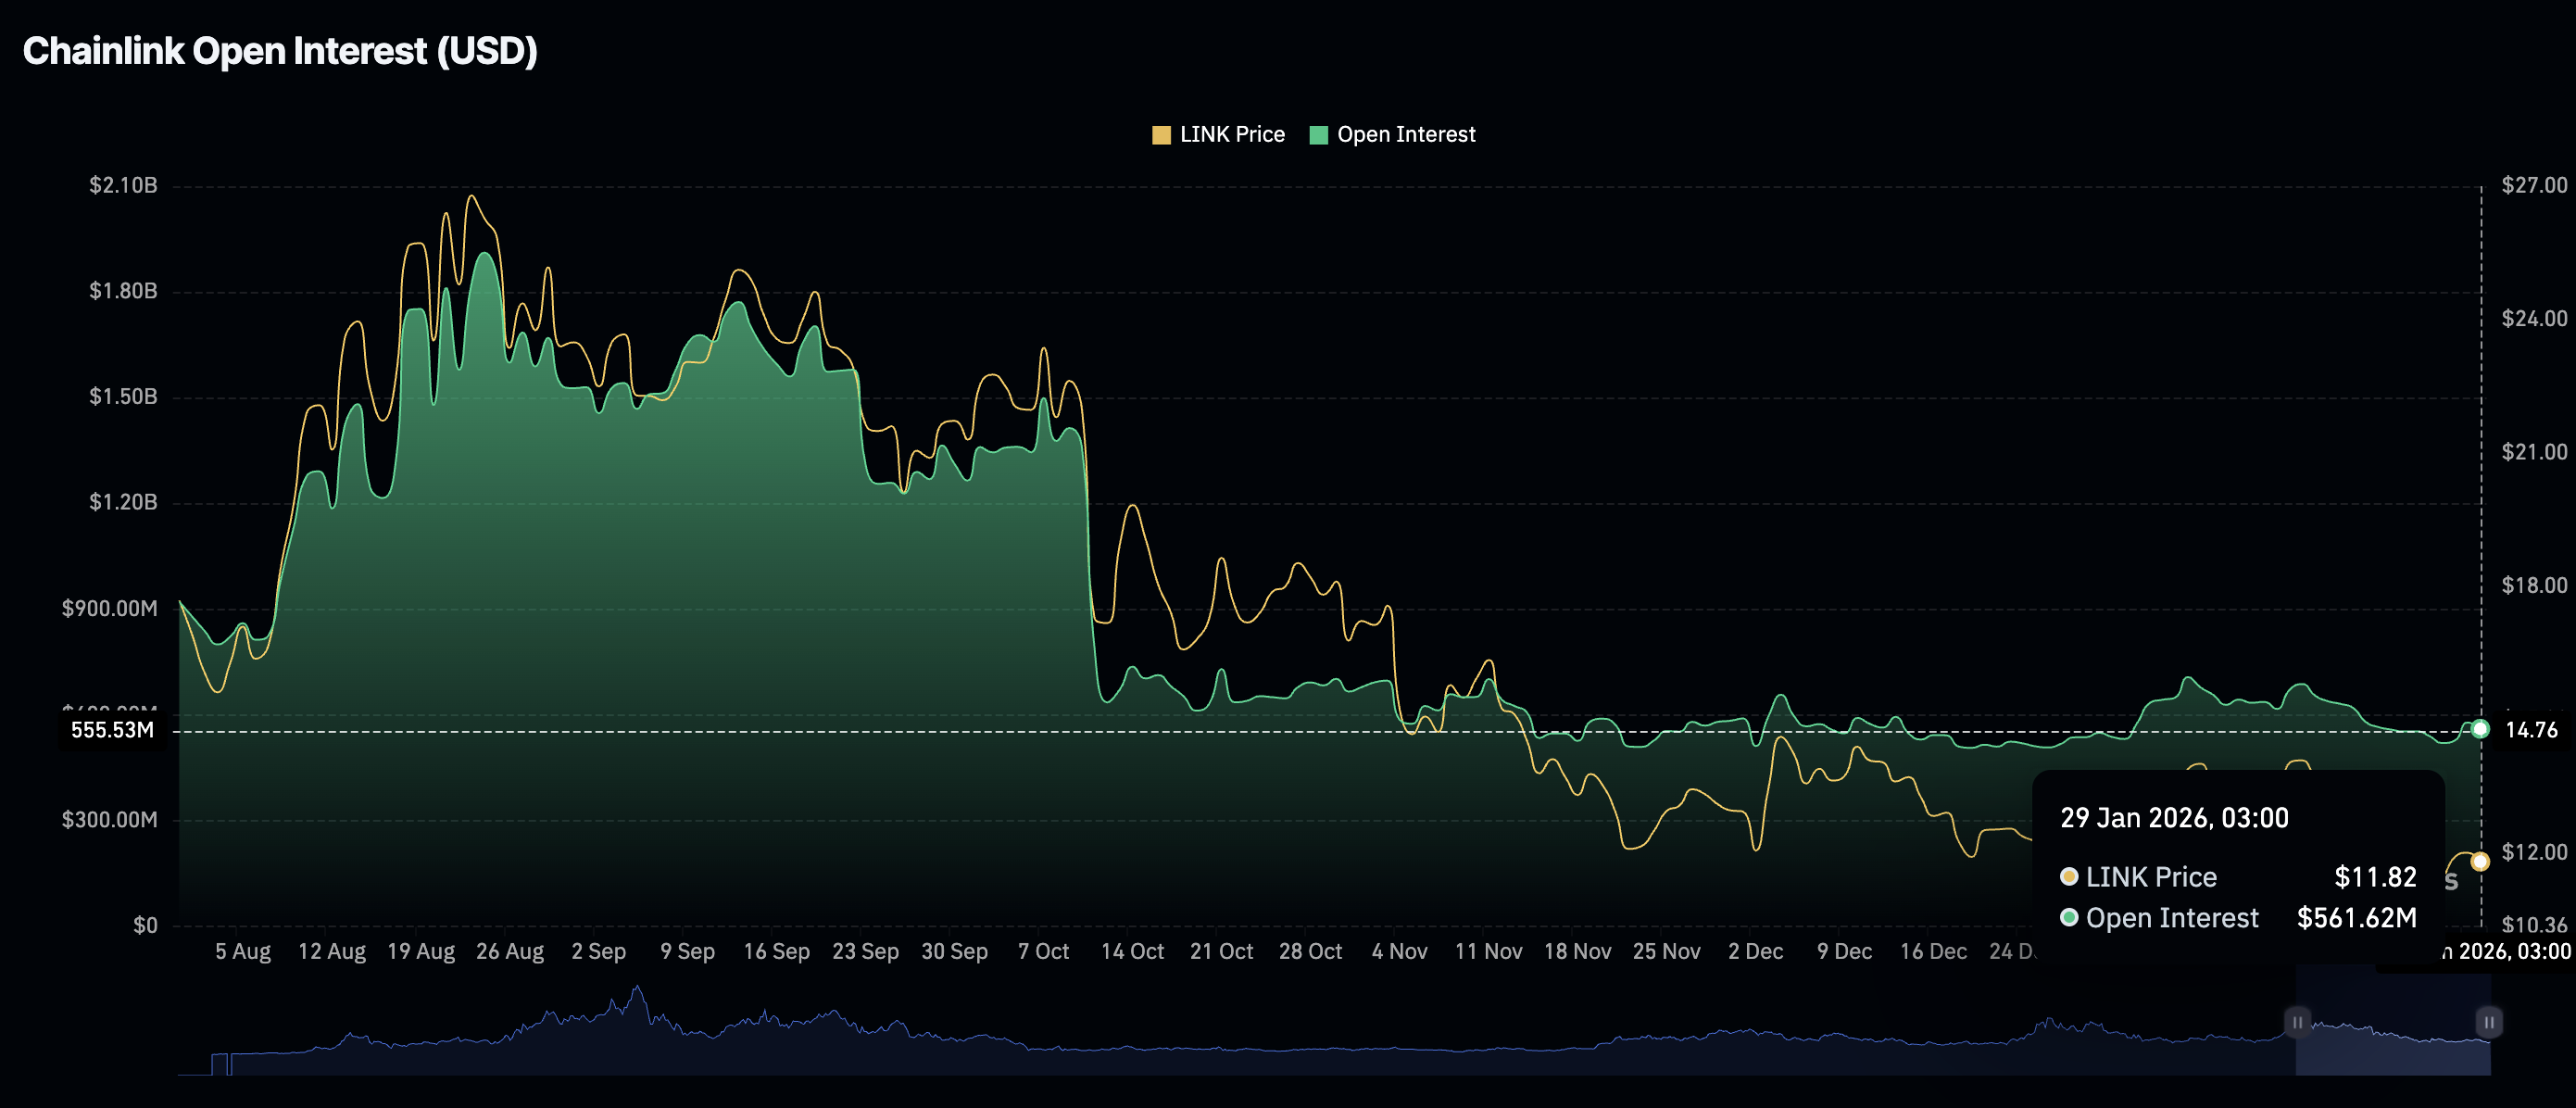
- Retail interest in LINK fades, with futures Open Interest dropping to $562 million.
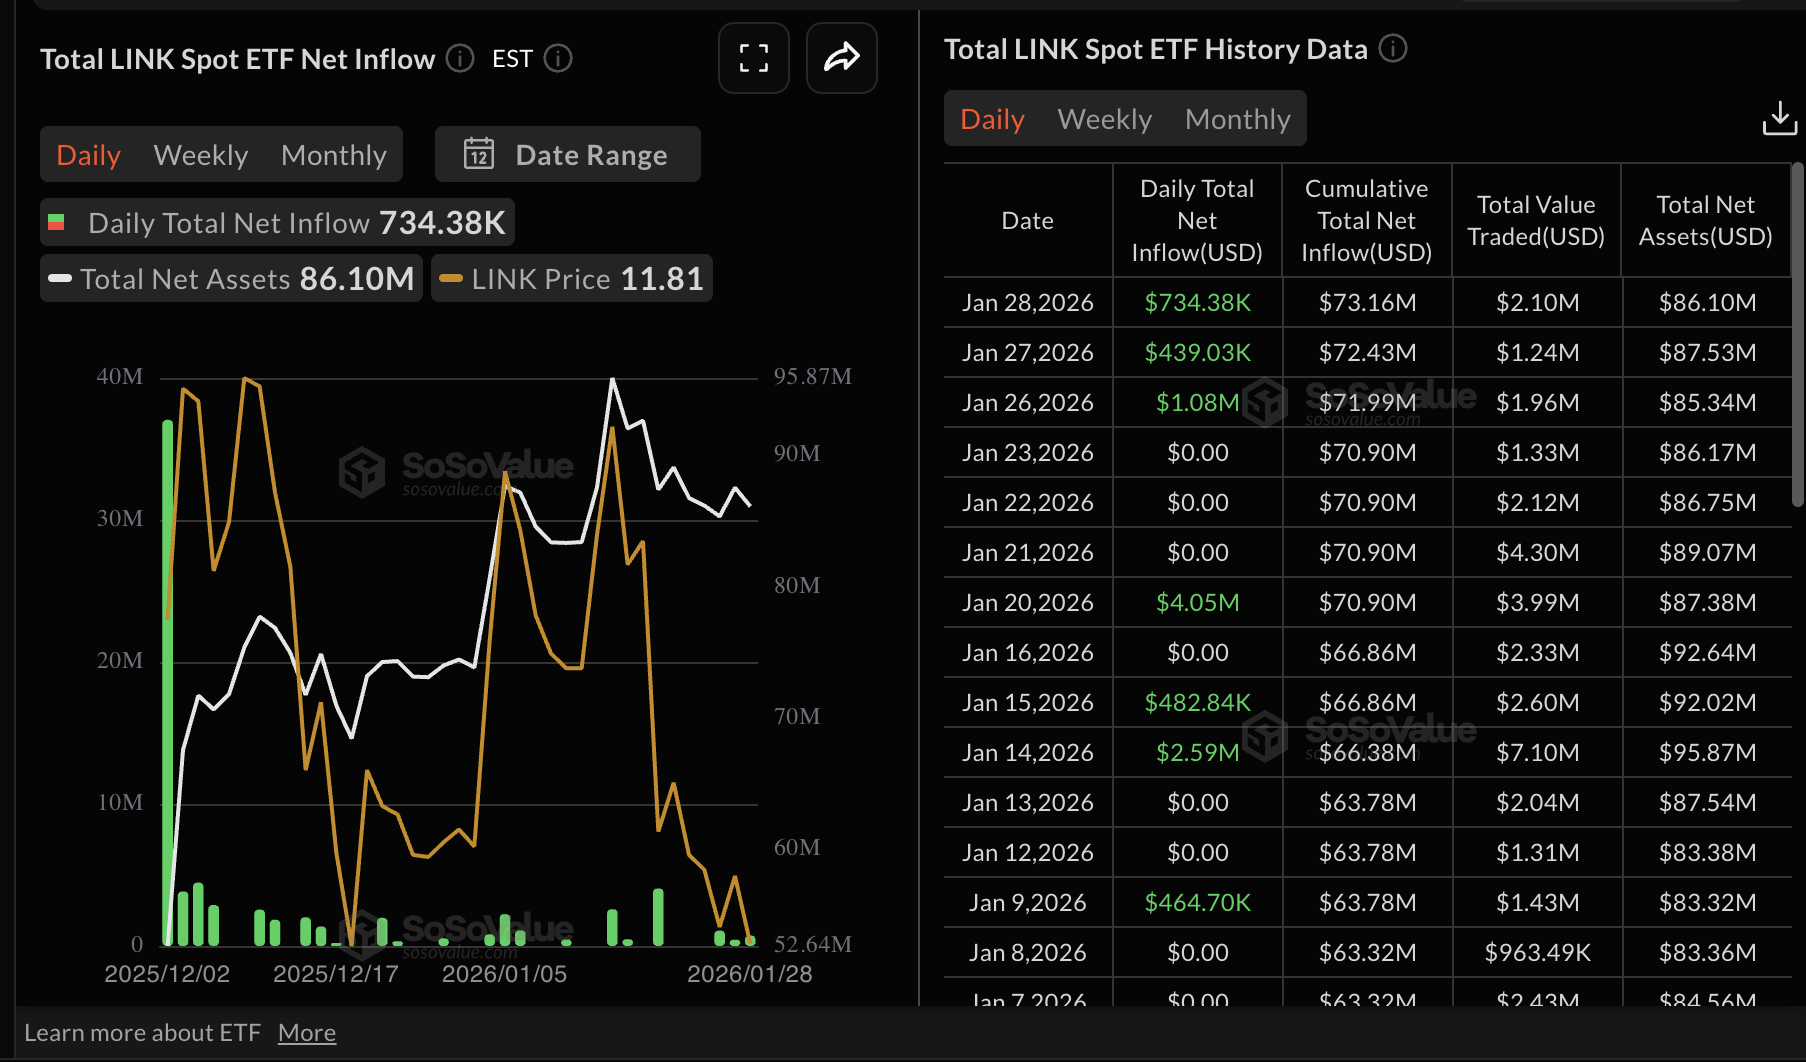
- LINK spot ETFs attract over $73 million in total inflows after pulling in $734,000 on Wednesday.
Chainlink (LINK) is trading at $11.16 at the time of writing on Thursday, extending its downtrend for the second consecutive day amid broader crypto market weakness.
The oracle token has declined by 9.4% over the last week, 5.5% over the past 24 hours, and 4.9% intraday. Sellers appear to be targeting the critical $11.00 psychological support level, a threshold that could determine whether LINK stabilizes or accelerates its correction below $10.00.
Chainlink trades under pressure as retail interest slows
Chainlink faces waning retail interest, with futures Open Interest (OI) dropping to $562 million on Thursday, from $580 million the previous day. The slump is part of a longstanding bearish trend, which has seen LINK’s derivatives’ OI plummet from a record high of $ 1.91 billion reached in August.
OI tracks the notional value of outstanding futures contracts; hence, low retail activity indicates that investors lack confidence in the token’s ability to sustain an uptrend. Also, it means investors are closing positions rather than opening new ones, depriving LINK of the tailwind that keeps its uptrend intact.
Despite retail investors sticking to the sidelines, Chainlink is attracting institutional investor interest through Exchange-Traded Funds (ETFs). Investors seeking altcoin-based ETFs deposited approximately $734,000 in LINK spot ETFs, bringing the total cumulative inflow to $73 million and assets under management to $86 million.
Technical outlook: Chainlink sellers tighten grip as losses extend
Chainlink is trading downward but holds above $11.00 as indicators flash bearish signals, aligning with weak sentiment in the broader cryptocurrency market. The Relative Strength Index (RSI) at 35 on the daily chart is near oversold territory, preserving the bearish outlook.
Meanwhile, the Moving Average Convergence Divergence (MACD) indicator remains below its signal line, while histogram bars extend below the zero line, prompting investors to offload LINK.
Below the immediate $11.00 support, Chainlink could extend its correction toward the next key level at $8.10.
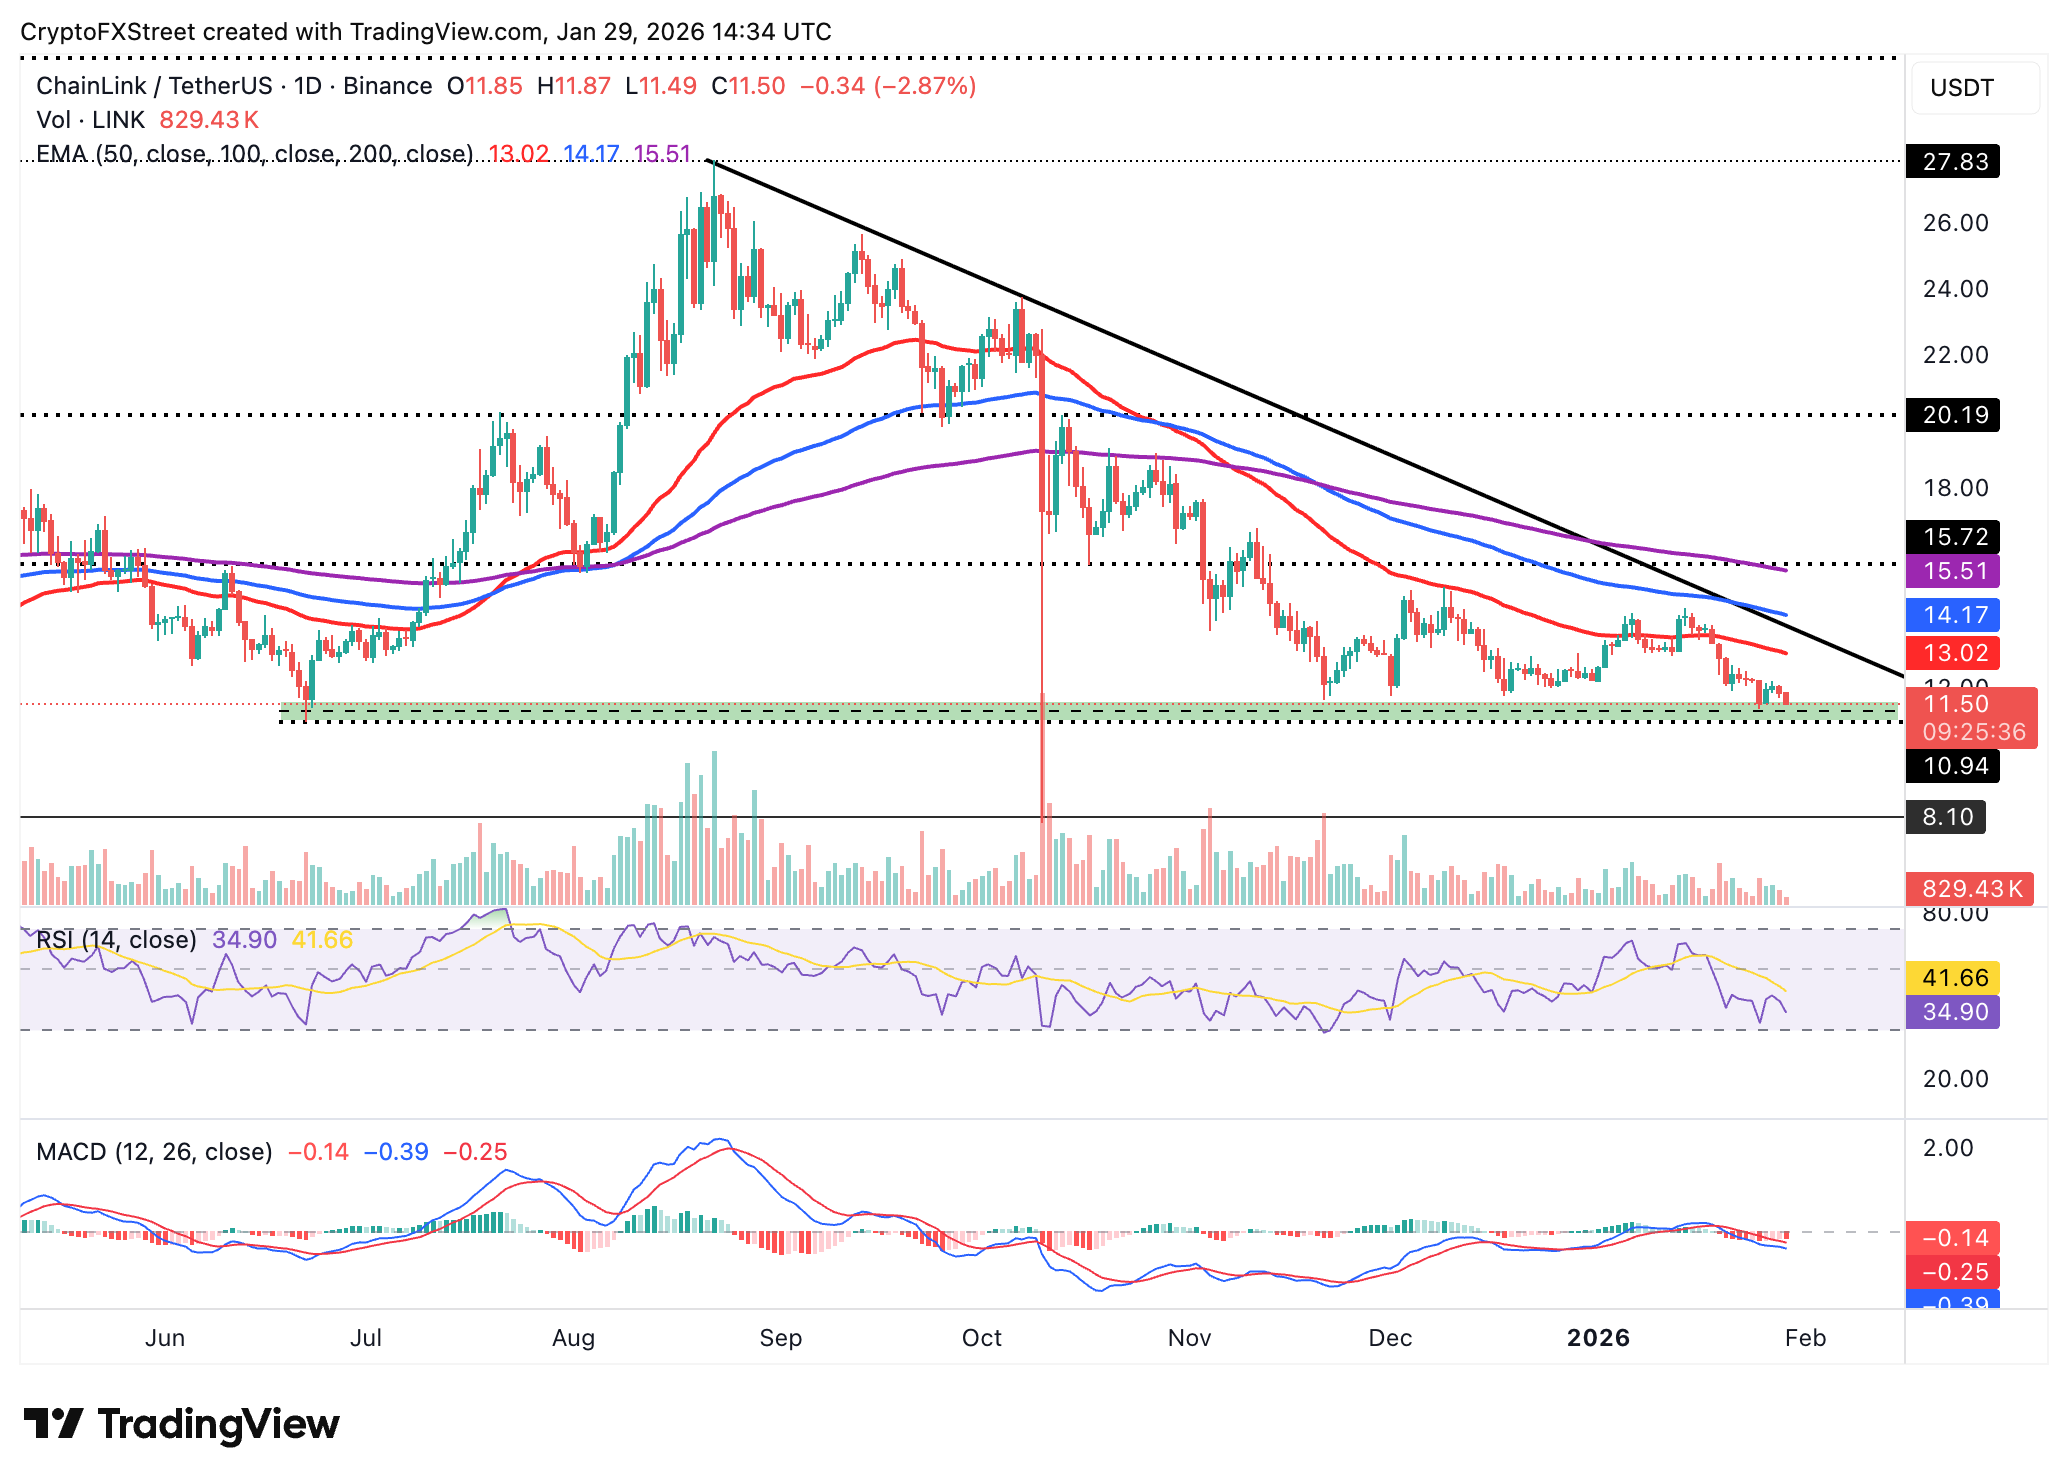
Any attempts to recover lost ground should be accompanied by immense volume and break above the 50-day Exponential Moving Average (EMA) at $13.02. The 100-day EMA caps the upside at $14.17 and the 200-day EMA at $15.51.
Crypto ETF FAQs
An Exchange-Traded Fund (ETF) is an investment vehicle or an index that tracks the price of an underlying asset. ETFs can not only track a single asset, but a group of assets and sectors. For example, a Bitcoin ETF tracks Bitcoin’s price. ETF is a tool used by investors to gain exposure to a certain asset.
Yes. The first Bitcoin futures ETF in the US was approved by the US Securities & Exchange Commission in October 2021. A total of seven Bitcoin futures ETFs have been approved, with more than 20 still waiting for the regulator’s permission. The SEC says that the cryptocurrency industry is new and subject to manipulation, which is why it has been delaying crypto-related futures ETFs for the last few years.
Yes. The SEC approved in January 2024 the listing and trading of several Bitcoin spot Exchange-Traded Funds, opening the door to institutional capital and mainstream investors to trade the main crypto currency. The decision was hailed by the industry as a game changer.
The main advantage of crypto ETFs is the possibility of gaining exposure to a cryptocurrency without ownership, reducing the risk and cost of holding the asset. Other pros are a lower learning curve and higher security for investors since ETFs take charge of securing the underlying asset holdings. As for the main drawbacks, the main one is that as an investor you can’t have direct ownership of the asset, or, as they say in crypto, “not your keys, not your coins.” Other disadvantages are higher costs associated with holding crypto since ETFs charge fees for active management. Finally, even though investing in ETFs reduces the risk of holding an asset, price swings in the underlying cryptocurrency are likely to be reflected in the investment vehicle too.

Hơn một triệu người dùng dựa vào FXStreet để có dữ liệu thị trường thời gian thực, công cụ biểu đồ, góc nhìn chuyên gia và tin tức Forex. Lịch kinh tế toàn diện và các hội thảo web giáo dục giúp nhà giao dịch luôn cập nhật và đưa ra quyết định có tính toán. FXStreet có khoảng 60 nhân sự, chia giữa trụ sở Barcelona và nhiều khu vực toàn cầu.
Đọc thêm


