
Crypto Market Overview: Bitcoin slides to $68,000 as Iran deadline looms – FET, AVAX, PEPE lead decline
Bởi Vishal Dixit
Đã cập nhật: 7 Apr 2026


BÀI VIẾT PHỔ BIẾN

The broader cryptocurrency market whipsaws as Tuesday’s 08:00 PM ET deadline imposed by US President Donald Trump on Iran nears, sending Bitcoin (BTC) below $69,000.
- Bitcoin hovers around $68,000 on Tuesday, retracing from $70,000 the previous day.
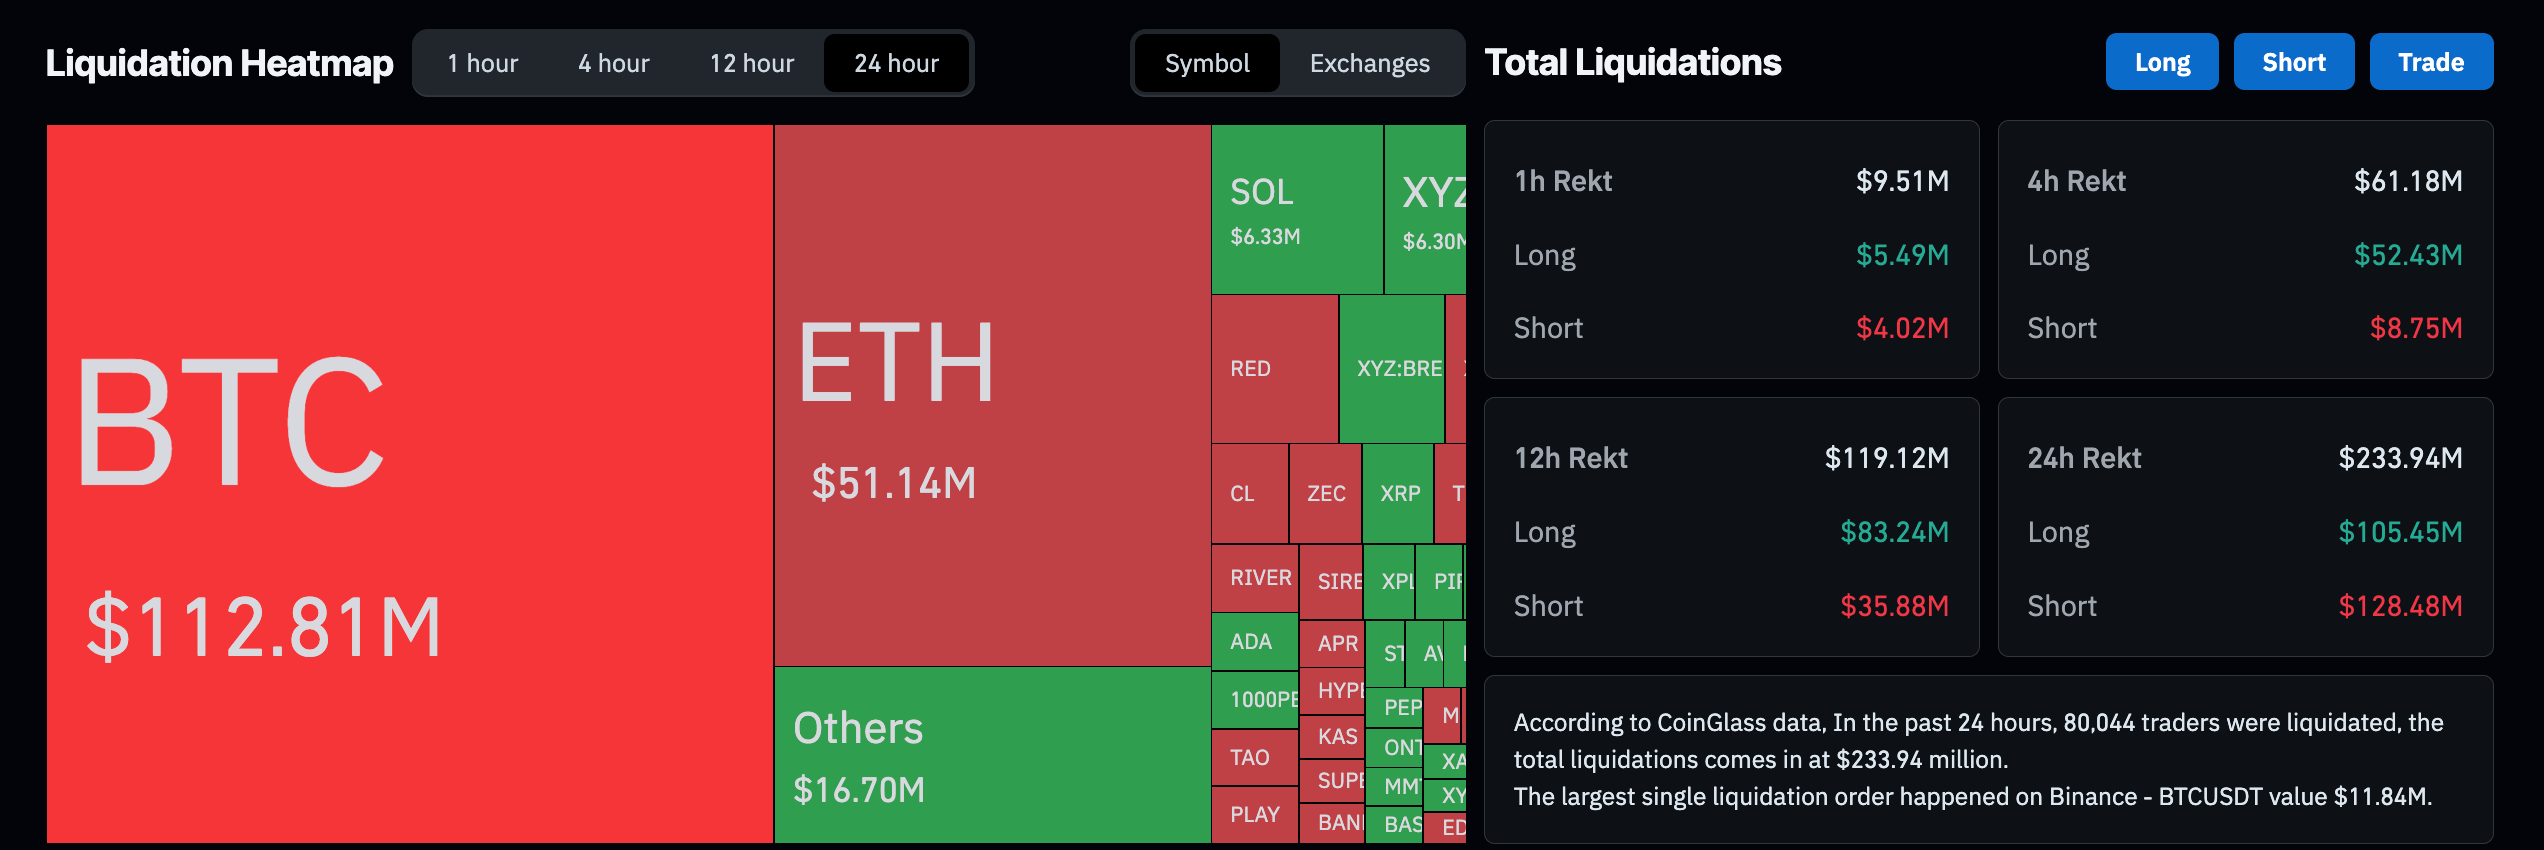
- Total liquidations over the last 24 hours surpass $230 million as markets whipsaw ahead of the Iran deadline.
- FET, AVAX, and PEPE are leading the decline over the last 24 hours.
The broader cryptocurrency market whipsaws as Tuesday’s 08:00 PM ET deadline imposed by US President Donald Trump on Iran nears, sending Bitcoin (BTC) below $69,000. Liquidations over the last 24 hours reached $230 million, while Artificial Superintelligence Alliance (FET), Avalanche, and Pepe (PEPE) are leading the losses.
Volatility spurs ahead of the Iran deadline
The US President Donald Trump insists on opening the Strait of Hormuz as part of the peace deal with Iran, while threatening Iranian power plants and bridges if the conditions are not met by Tuesday, 08:00 PM ET deadline.
On the other hand, Iran warns of attacking other Gulf countries and their energy infrastructure, which would further damage the global fuel supply.
CoinGlass data shows the total liquidations over the last 24 hours amount to $233 million, led by $128 million of short liquidations and $105 million in long liquidations. This indicates a more bearish-focused wipeout as volatility increases.
Technical outlook: FET, AVAX, PEPE fall back
FET holds steady at press time on Tuesday after a roughly 4% decline the previous day. The near-term bias is mildly bullish as price holds above the 100-day Exponential Moving Average (EMA), supporting a developing recovery structure.
Momentum has cooled from earlier overbought conditions, with the Relative Strength Index (RSI) retreating toward the 50 area and the Moving Average Convergence Divergence (MACD) drifting below its signal line near the zero mark, suggesting only modest upside pressure.
The overhead resistance for FET lies at the 78.6% Fibonacci retracement at $0.2622, measured from the $0.3149 high to the $0.1340 low.
On the downside, the 100-day and 50-day EMAs at $0.2219 and $0.2101 serve as crucial support levels.
On the other hand, Avalanche extends losses by over 2% at press time on Tuesday. AVAX reversed from the 50-day EMA at $9.45 on Monday, which continues to slope lower and cap recovery attempts. The 200-day EMA remains well above the market, underscoring a broader downtrend.
Momentum readings align with this tone: the MACD sits below its signal line in negative territory with a modestly negative histogram, suggesting persistent but not accelerating selling pressure, while the RSI near 42 signals sub-50 bearish momentum without reaching oversold extremes.
The immediate support for AVAX lies at the February 5 low at $8.24, followed by the February 6 low at $7.55.
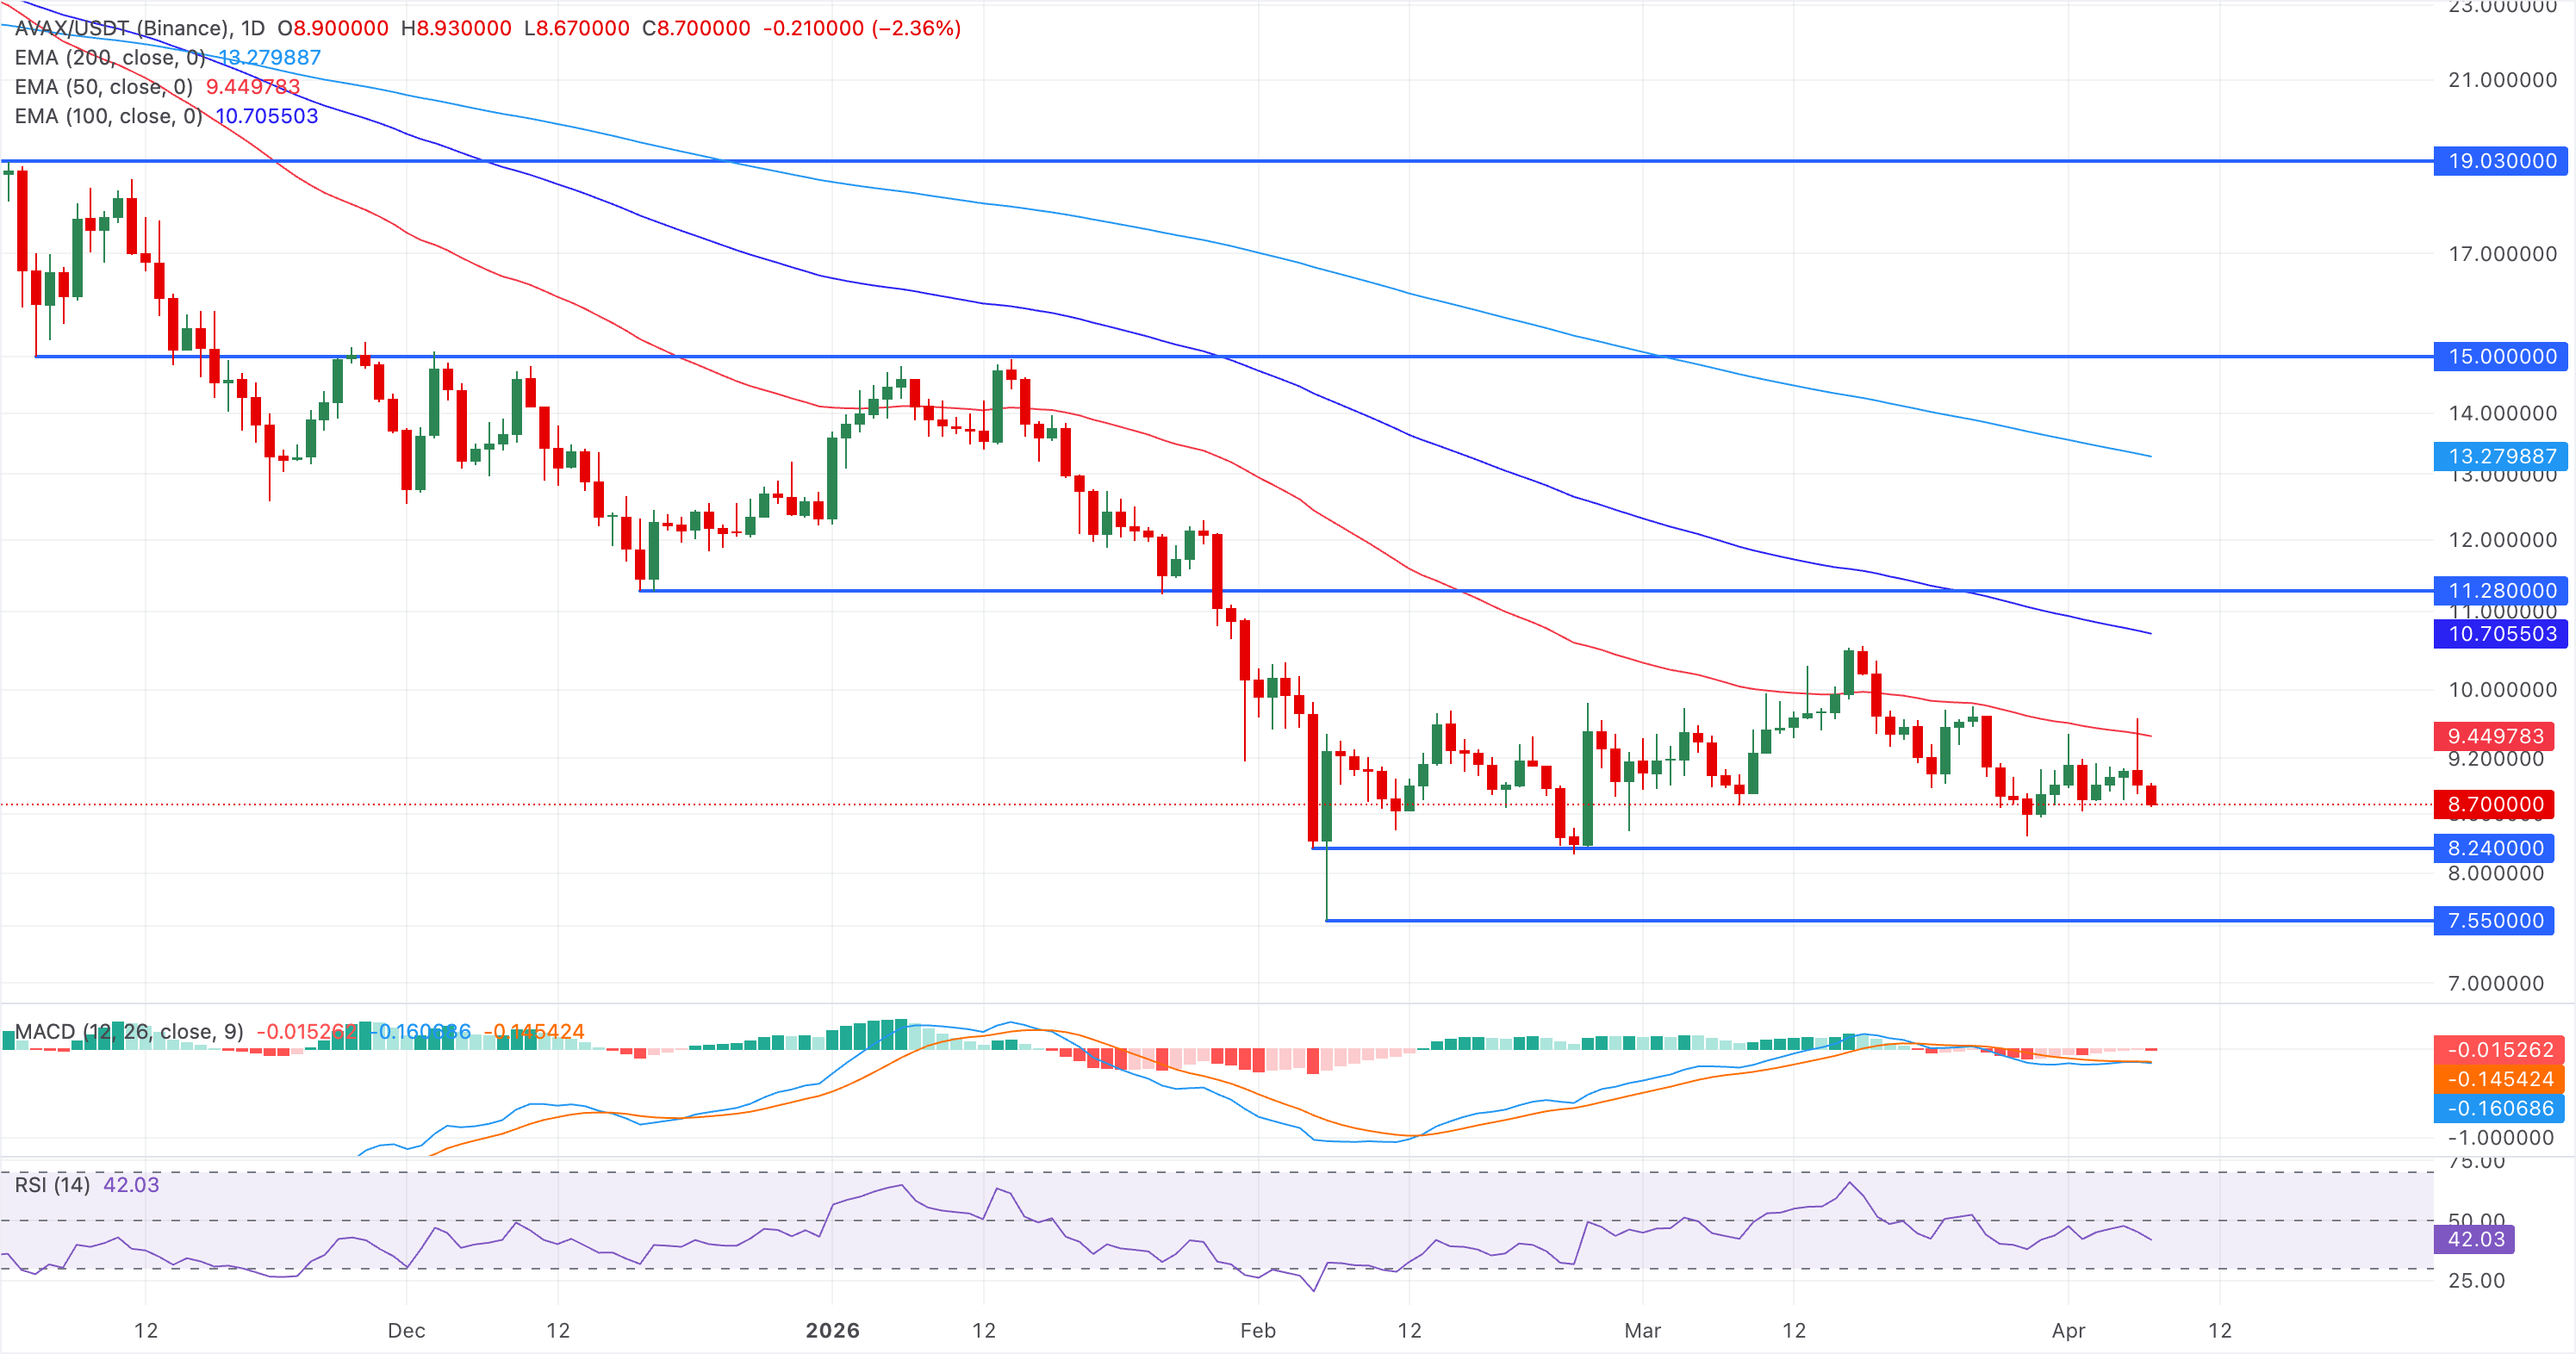
Looking up, the 50- and 100-day EMAs at $9.45 and $10.91, respectively, serve as overhead resistances.
Pepe shows minor recovery at the time of writing on Tuesday, after a roughly 5% drop on Monday from the 50-day EMA at $0.00000362. A descending resistance trend line overhead still frames the broader structure as heavy. The technical picture is effectively stalled, with price glued to the flat 50-, 100-, and 200-day EMAs, which removes any clear directional trend and keeps the near-term bias neutral.
The RSI holds in the mid-40s, aligning with this lack of momentum and suggesting neither buyers nor sellers dominate.
Immediate support PEPE lies at the February 6 low at $0.00000311, guarding the downside to the S1 Pivot Point at $0.00000298.
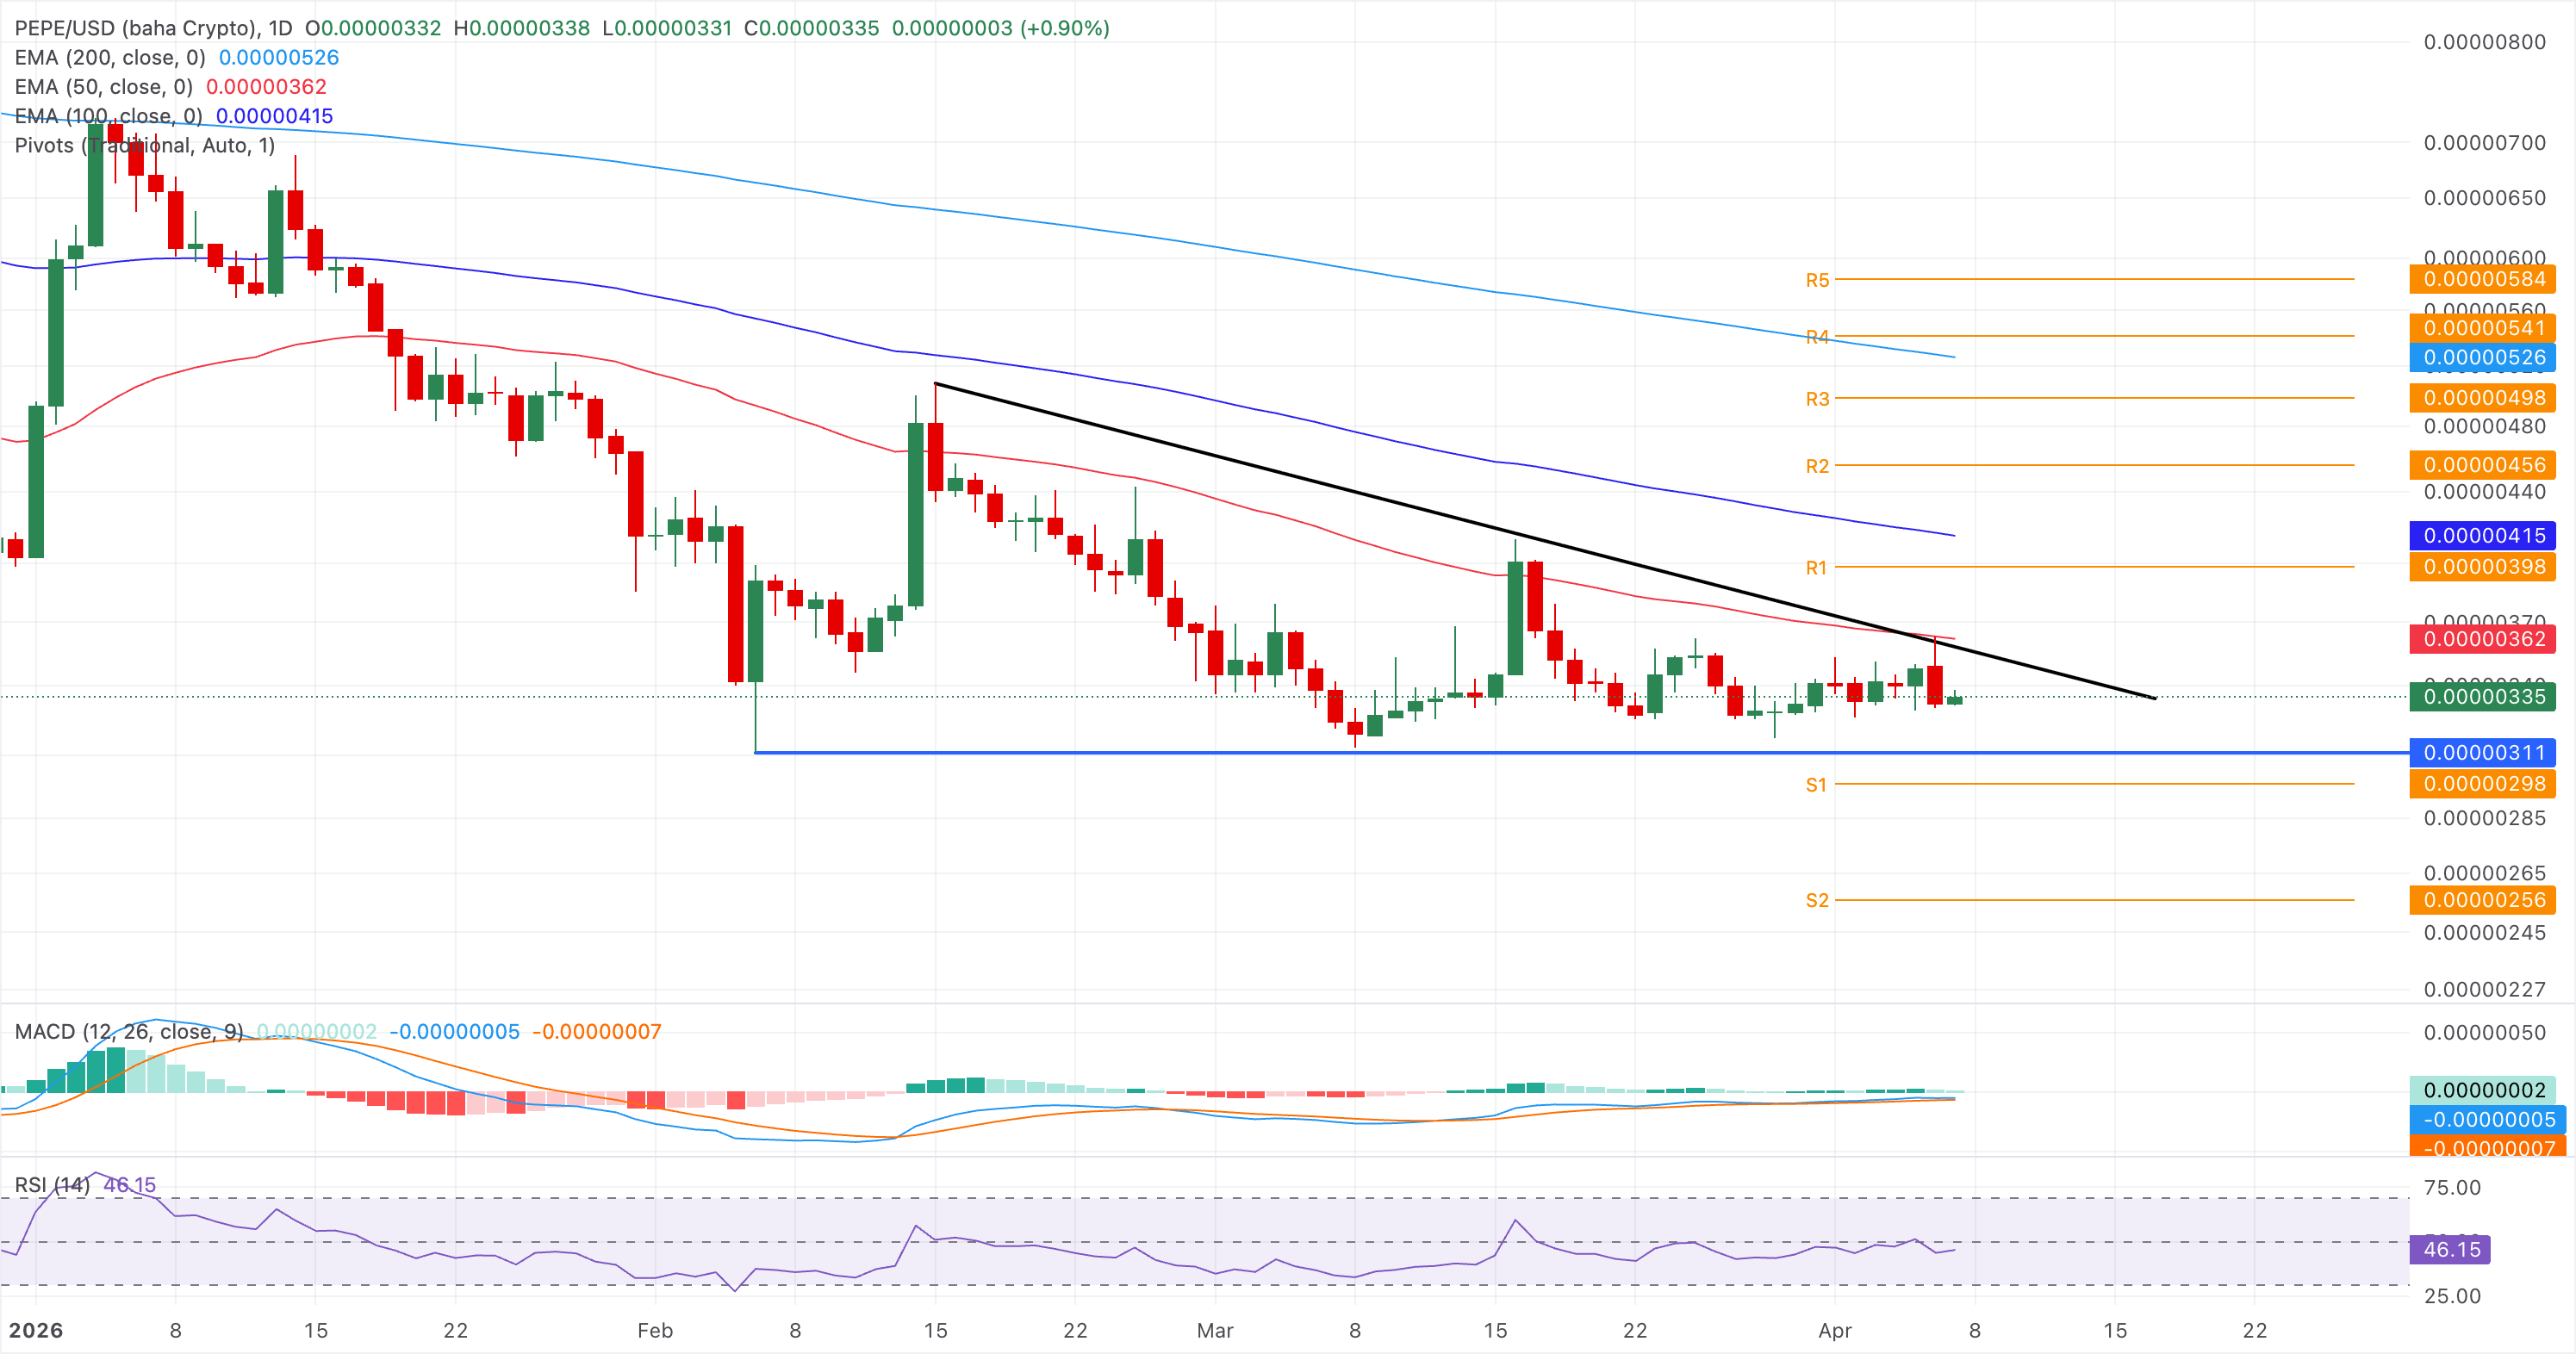
On the upside, PEPE must secure a daily close above the 50-day EMA at $0.00000362 for an extended recovery to the R1 Pivot Point at $0.00000398.
(The technical analysis of this story was written with the help of an AI tool.)

Hơn một triệu người dùng dựa vào FXStreet để có dữ liệu thị trường thời gian thực, công cụ biểu đồ, góc nhìn chuyên gia và tin tức Forex. Lịch kinh tế toàn diện và các hội thảo web giáo dục giúp nhà giao dịch luôn cập nhật và đưa ra quyết định có tính toán. FXStreet có khoảng 60 nhân sự, chia giữa trụ sở Barcelona và nhiều khu vực toàn cầu.
Đọc thêm


